Regulatory, Policy and Transportation Challenges to Gas Delivery:
|
|
|
- Kelley Heath
- 5 years ago
- Views:
Transcription
1 Regulatory, Policy and Transportation Challenges to Gas Delivery: OPOKU DANQUAH HART ENERGY Gas Renewables: Building a Cleaner Energy Bridge to a Sustainable Fuels Future November 9 th, 2010
2 Historical Overview First natural gas pipeline was laid in 1859 (5.5 miles, 2 inch diameter) First high-pressure long haul pipeline (120 miles) was built in 1891 from Indiana to Chicago Pipeline construction took off after World War II only after advances in metallurgical and welding techniques The US pipeline network is the most developed in the world with about 580,000 miles of pipe of which 53% are transmission (predominantly interstate) pipelines
3 Pipeline Schematic SUPPLY LONG-HAUL PIPES MARKET AREA gathering system residential/commercial (21%/14%) processing plants Industrial (27%) Imports (10%) power (30%) STORAGE
4 Miles (Thousands) Current Pipeline Network Intrastate Interstate 50 0 Source: Hart Energy Consulting Transmission Gathering Distribution Other Percentage of transmission that is interstate is increasing Other includes some cross-border pipelines and storage/lng headers

5 Pipeline System
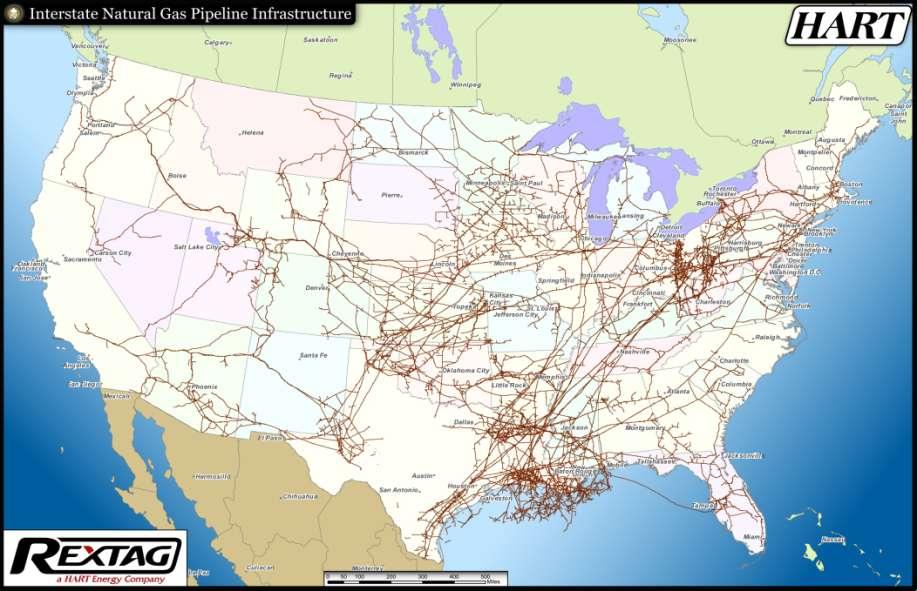
6 Interstate System
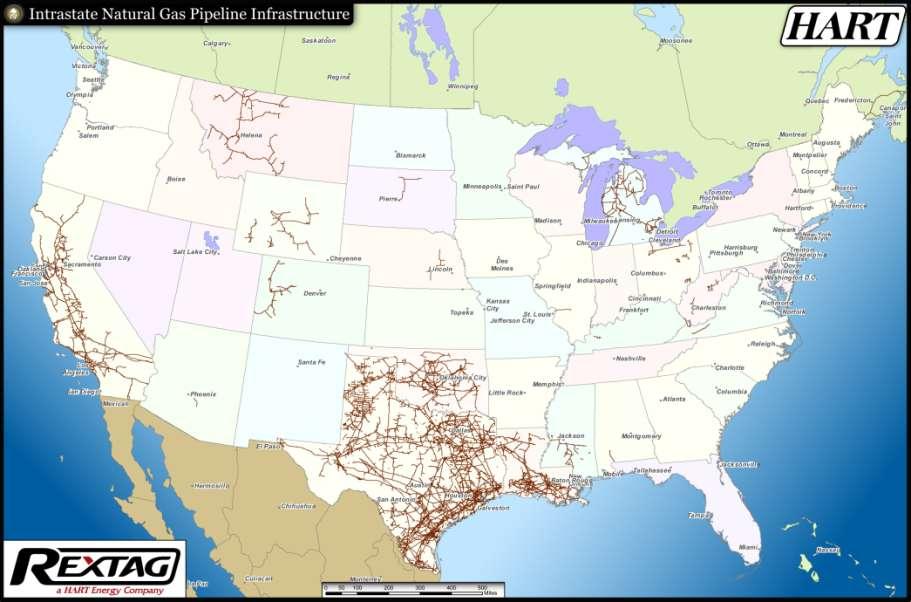
7 Intrastate System
8 Gathering Systems

9 Proposed Pipelines

10 Pipeline Process Construction of major pipeline or expansion takes 3 years on average 1. Open Season: 3 months 2. Financial and firm commitments: 3 months 3. Filing for regulatory approval: 15 months 4. Construction: 6-18 months 5. Commissioning/Testing: 1 month Source: EIA
11 tcf bcf mmcfd miles Growth Natural Gas Pipeline Mileage and Capacity Additions pipeline projects completed in 2008, whereas 43 projects were completed in 2009 (~ $10 billion) Additional Capacity (mmcfd) Additional Mileage Natural Gas Underground Storage Capacity major storage projects were completed in 2009 and approximately 15 are scheduled to be completed in Est. Maximum Working Capacity (tcf) Annual Working Capacity Additons (bcf) Source: Hart Energy Consulting, EIA
12 Growth Drivers FUNDAMENTALS Supply : Decline from conventional wells has been replaced by unconventional production. Domestic supply increased by over 7 bcfd from about 50 bcf in 2005 through 2007, and is set to increase to about 75 bcfd by 2025 Driven by technological enhancements (horizontal/pad drilling, multifrac completions); higher value shales (liquid rich plays); producer hedges; drilling lease maintenance programs; foreign investment via JV/M&A cost carries Demand : Currently at 63.5 bcfd but is set to increase to around 77 bcfd by 2025 BASIS DIFFERENTIALS The price difference between regional natural gas hubs determined by the opportunity cost to move gas from a producing region to a demand zone Source: Hart Energy Consulting, EIA
13 Regulation/Safety With the help of other federal agencies, FERC is responsible for the authorizing the construction and operations of interstate pipelines and interconnects related to storage fields and LNG facilities Pipeline safety standards and procedures are set within the US Department of Transportation s Pipeline and Hazardous Materials Safety Administration Pipeline Safety Improvement Act (PSIA) of 2002 required the Pipeline and Integrity Management Programs (IMP) transmission pipelines be implemented with a strong focus on high consequence areas (HCAs) All HCAs are required to be fully tested by 2012 and must be tested on a frequent basis Source: Hart Energy Consulting, EIA
14 Serious Incidents Related to Natural Gas Transmission Regulation/Safety No. of Incidents Fatalities Injuries Average of 14 fatalities per year from 1999 to 2009 Only 9 fatalities for the whole year in 2009 compared to less than a tenth of daily motor vehicles fatalities (93 daily) in that same year Source: Hart Energy Consulting, PHMSA
15 Flow Dynamics Western Central 4,451 3,016 Midwest Northeast 51 4, ,028 4,018 3,755 1, ,100 4,897 11, ,875 2,643 3,594 8,898 23, , , ,090 Southwest 405 2,491 Southeast Source: Hart Energy Consulting, EIA, Gas Tran
16 Challenges Access to construction capital will depend on market dynamics and projected profitability of projects. Narrowing of basis will be ongoing as key bottlenecks are eased. Less significant forward curve spreads could reduce arbitrage opportunities and hamper the incentive for storage additions Gauging resource potential and productivity accurately may take time and lengthy FERC procedures may affect the first-mover advantage that could realized for some efficient or more familiar regional operators. Ecological consequences of laying pipe will be relatively worse due to geographical and geological miscellany of shale plays. Environmental Impact Statements (EISs) will be more daunting to prepare and could ultimately contribute to timing delays and construction cost overruns. Richer gas could be a double-edged sword due to limited processing capacity and high pressure and high IP wells will require specialized gathering equipment
17 Production Process 1. Leasing and exploration 2. Clearing the site and drilling the well 3. Completing the well (hydraulic fracturing) 4. Gas production 5. Transporting gas to market 6. Well closure/plugging and land reclamation Steps in bold all represent the use of water. The most resonating and critical issue with regards shale gas development is water management


18 Site Clearing and Drilling Well Storm water runoff should be considered as a result of clearing land and other construction activities There is no standard procedure and operators follow different degrees of storm water management practices Active working areas are usually lined with waterproof synthetics and collect the water with hoses Drilling fluids consist of a large amount of water Depends on the depth, geology and lateral lengths of the well


19 Well Completion The most water consumption occurs during the hydraulic fracturing process On average a single well can use anywhere between million gallons of water Water is mixed with hazardous components (e.g. boric compounds, sulfuric acid, glycol ethers, light petroleum distillates, methanol, acetic anhydride and other various alcohols and proprietary components) Water is source from a nearby water body, well, public water supply, artificial lake and could be piped to the site or delivered by tanker Fracturing process causes contaminated flowback water to return to the surface which can be filtered and reused for future wells or must be treated and commercial disposed 2004 EPA study concluded that hydraulic fracturing activities poses little or no threat to underground sources of drinking water
20 Gas production Energy Type Water Use per MMBTU Gallons of Water RANGE MID-POINT Deep Shale Natural Gas Nuclear (Uranium ready to use in a power plant) Conventional Oil Synfuel coal gasification Coal (ready to use in a power plant) Oil Shale Tar Sands Fuel ethanol from corn 2,510 29,100 15,805 Biodiesel from soy 14,000 75,000 44,500 Source: Hart Energy Consulting, Ground Water Protection Counsel. DOE
21 Regulation Shale gas requires more wells than traditional conventional wells. State and local regulators are increasing drilling permit fees to ensure regular inspections Due to different nature of shale plays, state regulators are requiring more stringent well casing/cementing and design standards than federal mandates, as well as waste water management procedures. Disclosure of proprietary components in frac fluids is already in place for some states (Wyoming;Pennsylvania) and federal lands (CLEAR Act) but will soon become a standard procedure across the major producing states. The FRAC Act introduced to both houses of the US Congress on June 9, 2009 (H.R and S. 1215) will seek to repeal the exemption of full disclosure of frac fluid components that the Energy Policy Act of 2005 overlooked. Congress has recently commissioned the EPA to conduct another comprehensive study on the impact of hydraulic fracturing activities on water sources and public health. Preliminary results expected to be released in 2012
22 The industry is not immune to over-regulation. A zero-tolerance policy should be instituted across the board, but a one-size-fits-all approach will not be suitable to the conducive development of the industry Effective regulation and policy choices should not be a one-sided affair but all stakeholders should be involved in the decisions, especially in relation to technical issues. A combination of both prescriptive and performance-based regulation should be use Although the natural gas industry might seem old, development of shale gas is still in its infancy and technological advances will only make the safe exploitation of this resource better. Producers and midstream operators should collaborate to achieve economies of scale and operational efficiencies Industry participants should not focus on meeting current regulations since policies are evolving rapidly. Future municipal, state and federal regulations are still uncertain and will depend on demographics, geography, public perception, economics and politics