Economic Costs of Water Pollution on Rural Livelihood
|
|
|
- Patrick Hodges
- 5 years ago
- Views:
Transcription
 and Head, Project Planning and Monitoring Cell, Office of the Vice-Chancellor, University of")

1 Economic Costs of Water Pollution on Rural Livelihood R.S. Poddar1 and Shweta Byahatti2 1Professor (Agril. Economics) and Head, Project Planning and Monitoring Cell, Office of the Vice-Chancellor, University of Agricultural Sciences, Dharwad , Karnataka, India 2Graduate Assistant, University of Agricultural Sciences, Dharwad , Karnataka, India, 1


2 Introduction A growing world population, unrelenting urbanization and increasing scarcity of water resources are the driving forces behind accelerating global demand for water. Water use has been growing at more than twice the rate of population increase in the last century (FAO). Sector wise fresh water use in the world 10% Irrigation 20% Industry 70% Domestic use 2
3 Cont Water scarcity already affects more than 40 per cent of the people on our planet. By 2025, 1.8 billion people will be living in countries or regions with absolute water scarcity, and twothirds of the orld s population could be living under water stressed conditions (FAO, 2012). Up to 90 per cent of wastewater in developing countries flows untreated into rivers, lakes and highly productive coastal zones (World Water Development Report, 2012). Over 80 per cent of wastewater worldwide is not collected or treated, and urban settlements are the main source of pollution (WWDR,2012). 3
4 Cont Water pollution has emerged as a serious problem in the recent times and is posing a greater threat to the environment. Most of the Indian rivers and their tributaries have grossly polluted due to discharge of untreated sewage disposal and industrial effluents directly into the rivers. According to quality analysis done by the Karnataka State Pollution Control Board (KSPCB) the Bhima River fell under category C, which means the water could be only be drunk with conventional treatment followed by disinfection. 4


5 Map showing study area 5


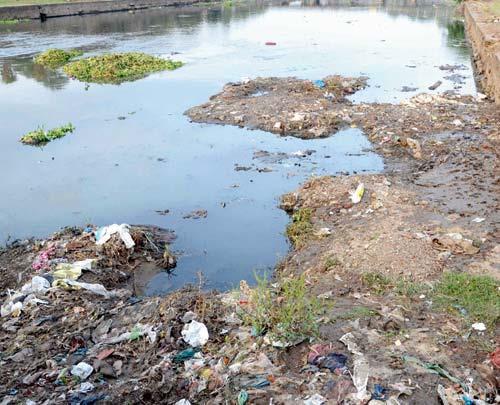
6 Pictures of water pollution in Bhima River and its tributaries 6

7 Bhima River 7
8 Objectives To make an agro- biological assessment of river water quality. To assess the economic impact of river water quality on agriculture, livestock and rural livelihoods. 8


9 Methodology Sampling Design Study Area Water pollution affected villages Water pollution non affected villages V1 LL-3,SF-3,MF-3,LF-3 V2 LL-3,SF-3,MF-3,LF-3 V3 LL-3,SF-3,MF-3,LF-3 V4 LL-3,SF-3,MF-3,LF-3 V5 LL-3,SF-3,MF-3,LF-3 V1 LL-3,SF-3,MF-3,LF-3 V2 LL-3,SF-3,MF-3,LF-3 V3 LL-3,SF-3,MF-3,LF-3 V4 LL-3,SF-3,MF-3,LF-3 V5 LL-3,SF-3,MF-3,LF-3 9
10 Cont To estimate water quality, water samples were collected from two polluted and two non polluted villages and tested for parameters and results of water samples tests were compared with Indian and WHO standards of water quality. Methods employed for the study included: Logistic regression Decomposition Model 10
11 Logistic Regression A logistic regression analysis was carried out to know the determinants of morbidity reported by the households. A dummy dependent variable assuming value 1 if the households report at least one sick member with skin itch, typhoid, diarrhea, fever which was major disease in the water polluted villages in reference period and otherwise zero has been generated. Li = ln (Pi / 1 Pi) = β1 + β2 Vil_c + β3ow_land + β4ow_livestock + β5 Edu_head+ β6agri_lab + β7family_size+ β8avg_age+ β9fuel + β10mig_lab+ β11caste + β12pvt_toilet. 11
12 Decomposition Model It was aimed to decompose the change in productivity of a principal crop (sugarcane) between water polluted villages and water non polluted villages into the impact due to polluted water used for irrigation and that due to change in use of inputs. Specifications of the model are as follows; For non polluted villages Y1 = a1 X11b11X12 b12. X1n b1ne (1) For polluted villages Y2 = a2 X21 b21 X22 b22. X2n b2ne (2) Where, Y1 = Gross output obtained in non polluted villages Y2 = Gross output obtained on polluted villages a1 and a2 are the intercept of non polluted and polluted villages, respectively X1n = Independent variables in non polluted villages X2n = Independent variables in polluted villages 12
13 Cont.. For sugarcane the independent variables included, X1 = Seeds (quintal) X2 = Organic manure (quintal) X3 = Human labour (man days) X4 = Bullock labour (pair days) X5 = Plant protection chemicals (Rs. /ha) X6 = No. of irrigations bi = output elasticity co-efficient of ith input Taking logarithm on both sides for equations 1, and 2, ln Y = lna + b lnx +b (3) In Y = lna +b lnx +b (4) lnx. + b n ln X1n lnx. + b n ln X2n 13
14 Cont.. To identify the structural break in the production relations that defined the yield levels in water polluted villages and water non polluted villages, a dummy variable with 1 for water polluted villages and zero for water non polluted villages was introduced in the production function of Cobb-Douglas setting. Decomposition Model for polluted V/s non polluted water was obtained by taking difference between equation (3) and (4). (lny2 ln Y1) = (lna2 lna1) + {(b21 lnx21 b11 lnx11) + (b22 lnx22 b12 lnx12) + + (b2nlnx2n b1n ln X1n) (5) 14

15 (mg/l) River water sample Bore well water sample Standard Fig.1 Total Dissolved Solid content in water samples 15
16 (mg/l) River water sample Bore well water sample Standard Fig. 2 Total Alkalinity in water samples 16
17 (mg/l) River water sample Bore well water sample Standard Fig. 3. Total Hardness in water samples 17
18 (mg/l) River water sample Bore well water sample Standard Fig. 4 Biological Oxygen Demand in water samples 18

 NTU =")
19 NTU River water sample Bore well water sample Standard Fig. 5 Turbidity in water samples (NTU) NTU = Naptholometric Furgibility Unit 19
20 Table 1: Decomposition of total difference in productivity of sugarcane crop in polluted and non polluted villages Sl. No Source of Difference I II Due to polluted water Due to difference in input use Seeds Organic manure Human labour Bullock labour Plant Protection Chemicals No. of irrigation Total due to inputs Total difference in output due to all sources III Percentage contribution
21 Table 2: Yield and income losses in sugarcane crop Yield Villages difference (tonnes/ ha) Income loss Dhulkhed and Yelgi ,408 Bhuyar and Hirebevnur ,084 Lachyan and Baragudi ,392 Shirnal and Halasangi , ,200 Chanegaon and Mananklagi 21
22 Table 3: Determinants of morbidity Coefficients t-value Vil_c ** Ow_land Ow_livestock Edu_head agri_lab family_size avg_age Fuel mig_lab Caste pvt_toilet Constant ** Significant at 5 percent of significance level 22
23 Table 4: Economic Impact of Water Pollution Non polluted Polluted illages villages ( ) Loss on 26,136 32, ,177.6 agriculture (66.23) (64.42) (57.74) Loss of 5,760 7,935 2,175 Employment (14.59) (15.82) (20.33) Loss on Human 7,050 8, , Health ( 17.86) (16.34) (10.71) Loss on ,710 1, Livestock Health ( 1.29) (3.40) (11.20) Total 39, , , (100) (100) (100) Source Difference % Difference Figures in the brackets indicate percentage 23
24 Conclusion Impact of consumption of Bhima river water had moderate negative effects on agriculture and rural livelihoods. If unchecked the degree of pollution in the river is expected to rise in the future. Study found that overall livelihood of farmers was negatively impacted by the polluted water. Reduced incomes and employment and increased expenditures on health of human beings and livestock caused a general loss in livelihood status. 24
25 Policy Implications The Karnataka State Pollution Control Board (KSPCB) has to expand its capabilities to continuously monitor river water quality in the state and laws should be strengthened to punish the guilty. Local government agencies should undertake regular water auditing for industries. Formulating integrated waste management programme to make sure that industrial waste does not contribute to the contamination of water. 25
26 Cont. Local community organizations should be strengthened and trained for social monitoring of surface and ground water bodies on a regular basis. Appropriate ameliorating measures should be initiated to insulate the farm house holds from adverse effects of water pollution on their agriculture and livelihoods. 26
27 Cont India needs to evolve a sound River Policy for protection of its invaluable water resources. Academia and research bodies should focus on social cost of pollution of water bodies to convince the policy makers. 27

28 28