Keeyask Infrastructure Project
|
|
|
- Angelina Cain
- 5 years ago
- Views:
Transcription


1 Keeyask Infrastructure Project Terrestrial and Aquatic Monitoring Plan Annual Report December 2014
2
3 KEEYASK INFRASTRUCTURE PROJECT TERRESTRIAL AND AQUATIC MONITORING PLAN Water Quality: Annual Report Report for MANITOBA CONSERVATION AND WATER STEWARDSHIP Prepared on Behalf of the Keeyask Hydropower Limited Partnership By North/South Consultants Inc. December 2014
4
5 TABLE OF CONTENTS 1.0 Introduction Methods Sampling Locations Sampling Methods and Parameters Quality Assurance/Quality Control (QA/QC) Results Looking Back Creek The Unnamed Tributary QA/QC Results References... 8 i
6 LIST OF TABLES Table 1. Table 2. GPS locations (NAD 83) and sampling dates for the water quality monitoring program conducted at the two stream crossings along the KIP access road, In situ data collected at water quality monitoring transects located near the KIP access road crossing at Looking Back Creek, Table 2. Continued Table 3. TSS results for water samples collected at water quality monitoring transects located near the KIP access road crossing at Looking Back Creek, Table 3. Continued Table 4. Nutrient results for water samples collected at water quality monitoring transects located near the KIP access road crossing at Looking Back Creek, Table 4. Continued Table 5. Table 6. Table 7. Table 8. In situ data collected at water quality monitoring transects located near the KIP access road crossing at unnamed tributary, TSS results for water samples collected at water quality monitoring transects located near the KIP access road crossing at Unnamed Tributary, Values in italics are considered suspect Nutrient results for water samples collected at water quality monitoring transects located near the KIP access road crossing at Unnamed Tributary, Results for QA/QC samples submitted to ALS and Maxxam Laboratories in Results exceeding five times the analytical detection limit are indicated in red ii
7 Figure 1. LIST OF FIGURES Location of water quality monitoring transects near stream crossings along the KIP access road, Figure 2. Clear-span bridge over Looking Back Creek Figure 3. Road crossing for the unnamed tributary Figure 4. Brook Stickleback in the culvert at the unnamed tributary on August 20, Figure 5. Exposed shorelines at Looking Back Creek on August 20, Figure 6. Figure 7. Sediment plume entering Looking Back Creek from the left-hand bank, August 20, Rip rap installation on each shore surrounding the clear-span bridge at Looking Back Creek, August 27, iii
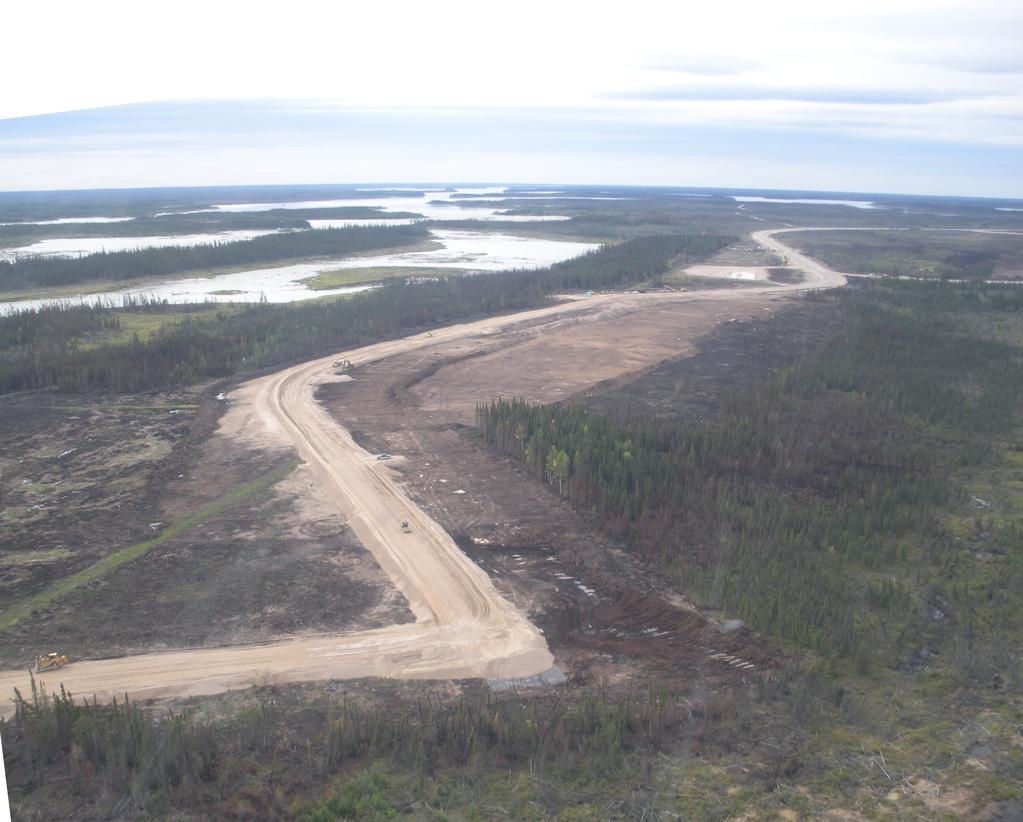
8 1.0 INTRODUCTION The Keeyask Hydropower Limited Partnership is constructing the Keeyask Infrastructure Project (the Project or KIP). The Project is located approximately 40 km southwest of Gillam, extending between Provincial Road (PR) 280 and Gull Rapids on the Nelson River. The Project includes a start-up camp and associated infrastructure, a 25 km all-weather access road and the first phase of a main camp. The start-up camp is located near the intersection of PR 280 and the access road, while the first phase of the main camp is located at the end of the access road on the north side of Gull Rapids. The predicted environmental effects of the KIP were described in the KIP Environmental Assessment Report (KHLP 2009; the EA Report). The following describes sampling methods and results from the water quality monitoring program conducted in the vicinity of two stream crossings along the KIP access road from April 1, 2013 to March 31, This work was conducted in accordance with Section 2.0 of the Keeyask Infrastructure Project Terrestrial and Aquatic Monitoring Plan. Water quality monitoring was conducted at two stream crossings: Looking Back Creek and an unnamed tributary to the South Moswakot River ( unnamed tributary ) (Figure 1). Sampling occurred on July 14 (Looking Back Creek only), August 20/August 23, September 10, and October 28, Sampling could not be conducted in May or June, and only at selected sites in July and October, because of the presence of low water conditions and/or ice on the creeks. Forest fires also dominated the area in July and sampling was only conducted when and where it was safe to do so. A permanent clear-span bridge was constructed over Looking Back Creek during 2012/early 2013 (Figure 2) and a culvert was installed in the unnamed tributary in early 2012 (Figure 3). Monitoring conducted in 2013 was intended to assess whether there were any differences in water quality upstream and downstream of each of the road crossings, post-construction. The water quality monitoring program is focussed on measurement of turbidity and total suspended solids (TSS) but also includes monitoring for nutrients during one sampling event. 1
9 Looking Back Creek supports upstream movements of Walleye (Sander vitreus) and Northern Pike (Esox lucius) at the crossing location. The Department of Fisheries and Oceans Canada deemed the installation of a culvert at the unnamed tributary to be of low risk to fish and fish habitat and no fish were observed in surveys conducted prior to During one sampling period in 2013 (August), several Brook Stickleback (Culaea inconstans; Figure 4) and small Northern Pike were observed at the crossing. 2
10 2.0 METHODS Monitoring was conducted in July and October by Manitoba Hydro and in August and September by North/South Consultants Inc. 2.1 SAMPLING LOCATIONS Water quality monitoring was conducted at transects located upstream and downstream of the two crossings (Figure 1; Table 1). At Looking Back Creek, four transects were located as follows: one approximately 15 m upstream of bridge (SC1-T1); one immediately downstream of the bridge (SC1-T2); one approximately 50 m downstream of bridge (SC1-T3); and, one approximately 100 m downstream of the bridge (SC1-T4). Up to three sites were sampled along each transect at Looking Back Creek; not all sites were sampled during each sampling event due to low water or ice. Sampling sites were located at mid-channel and approximately half way between mid-channel and each bank. Each transect was sampled and named starting from the left-hand bank (when facing upstream) to the righthand bank (i.e., -1, -2, -3 corresponds left, mid, and right, respectively). Exceptions occurred in July and October. In July, low water levels only allowed for two samples to be collected across the width of the creek, labelled as A and B. At that time, the samples were also labelled in reverse such that the upstream transect was sampled last and therefore labelled as Site 4 (e.g., LBC-4). Additionally, in October, the locations of the sampling sites were determined by the extent of ice formation and ability to safely access the area. No transect sampling was conducted; rather, one site upstream of the crossing and one site directly below the crossing (instead of being immediately downstream) were sampled. At the unnamed tributary, sampling was conducted at a single site within the main flow of the creek in the following locations: 3
11 upstream of the road crossing and the road footprint within the natural channel of the creek (SC2-T1); immediately upstream of the road crossing, located alongside the roadway within the ditch (SC2-T2); immediately downstream of the road crossing (SC2-T3); and, approximately 30 m downstream of the road crossing (SC2-T4). 2.2 SAMPLING METHODS AND PARAMETERS Both road crossings were accessed by truck. Sites located on Looking Back Creek were sampled by canoe, while sites located on the unnamed tributary were sampled from shore. During most seasons, water depth of each site was measured using either a handheld Digital Sonar system or a meter stick. Universal Transverse Mercator (UTM) coordinates were recorded using a hand-held Garmin etrex. At each sampling site, in situ measurements of turbidity were collected using an Analite NEP 160 turbidity meter. At Looking Back Creek, measurements in August and September were collected near the surface, at mid-depth and near the bottom; where water depths were < 1 m only surface and bottom measurements were taken. At the unnamed tributary measurements were taken from just below the surface. Measurements were not recorded at either crossing in July. In October, in situ turbidity was measured three days after samples were collected for analysis of TSS; turbidity was measured from a sample of water collected in a secondary vessel from just below the surface that was then stored three days until the turbidity meter was calibrated. At all sites and sampling times, water samples were collected for laboratory analysis of TSS. Additionally, water samples collected from Looking Back Creek in July and in the vicinity of both crossings in September were analysed for nutrients. Nutrients measured included: nitrate-n, nitrite-n, dissolved nitrate/nitrite-n, total Kjeldahl nitrogen (TKN; September only), total nitrogen (TN), total phosphorus (TP), and dissolved phosphorus (DP). All TSS and nutrient samples were collected as grab samples from just below the water surface (i.e., 4
12 0.3 m where water depths were sufficient). After collection, samples were kept cool and in the dark until submission to a Canadian Association for Laboratory Accreditations, Inc. (CALA) accredited laboratory (Maxxam Laboratories or ALS Laboratories, Winnipeg) for analysis. Samples collected in July for nitrite, nitrate/nitrite, and DP were analysed after the laboratory specified hold times. 2.3 QUALITY ASSURANCE/QUALITY CONTROL (QA/QC) Standard QA/QC measures were generally followed during sample collection (e.g., use of arm length gloves, standard labelling practices, meter verifications, sampling from downstream to upstream, etc.). As part of the monitoring program, a field blank and a trip blank were also collected in August and September, and a duplicate sample was collected in October. Details on the intent and methods used to assess these QA/QC samples can be found in BCMELP (1998). All water quality data were evaluated qualitatively for potential outliers and/or transcription or analytical errors. Where one sample differed notably from the others collected along a transect, the measurement was flagged as suspect. 5
13 3.0 RESULTS 3.1 LOOKING BACK CREEK Water quality monitoring results for Looking Back Creek are presented in Tables 2 to 4. TSS concentrations and turbidity measurements in Looking Back Creek were generally higher in July and August compared to September and October. However, during each sampling event, TSS and turbidity were similar upstream and downstream of the crossing and across transects. Turbidity was also similar throughout the water column at all sites sampled. TSS concentrations downstream of the Looking Back Creek crossing were consistently below the Manitoba water quality objectives for the protection of aquatic life (Manitoba Water Stewardship [MWS] 2011; i.e., induced change in TSS of 5 mg/l from background for an averaging duration of 30 days when background concentrations are less than 25 mg/l). At the initiation of monitoring on August 20, the sampling crew noted a sediment plume in Looking Back Creek (Figures 5 and 6). Monitoring was suspended and the Environmental Officer at the Keeyask Camp was notified. Additional rip-rap was installed on August 27 as sediment/erosion control (Figure 7). As noted above, water quality was similar upstream and downstream of the crossing following installation of the rip-rap, indicating the mitigation was effective. Similar to measures of water clarity, there was no indication that nutrients increased in Looking Back Creek downstream of the crossing. In fact, both TN and TP were lower downstream of the crossing than upstream in September; results obtained in August were similar between upstream and downstream areas. Nitrate, nitrite, and nitrate/nitrite were not detected at any sampling site in Looking Back Creek in August. Concentrations of these parameters were either below the analytical detection limits or relatively low in September. All concentrations of nitrate and nitrate/nitrite were well below the Manitoba water quality guideline for the protection of aquatic life (2.93 mg N/L; MWS 2011). 6
14 3.2 THE UNNAMED TRIBUTARY Water quality monitoring results for the unnamed tributary are presented in Tables 5 to 7. Turbidity and TSS downstream of the stream crossing were generally similar to or lower than at the upstream sites. A high TSS value was measured immediately upstream of the crossing (at SC2-T2) on September 10, but the value is considered suspect as in situ turbidity was low and similar to the downstream sites. TSS concentrations at the downstream sites were consistently below the Manitoba water quality objectives for the protection of aquatic life (MWS 2011). Nitrate, nitrite, and nitrate/nitrite were not detected at any sampling site along the unnamed tributary in September. All concentrations of nitrate and nitrate/nitrite were well below the Manitoba water quality guideline for the protection of aquatic life (2.93 mg N/L; MWS 2011). TKN and TN were slightly higher at the two sites downstream of the road crossing compared to these in the upstream reach. In contrast, DP was highest at upstream site (SC2- T1) but TP was similar across sites. 3.3 QA/QC RESULTS TSS, nitrate, nitrite, nitrate/nitrite, DP, and TP were not detected in the field or trip blanks (Table 8). TKN and TN nitrogen were detected in the field blank and the trip blank in September. These results suggest that TKN and TN may have been introduced to samples from the sample bottles and/or at the analytical laboratory. In addition, introduction of nitrogen to samples in the field may have also occurred since concentrations were higher, and greater than five times the analytical detection limit, in the field blank. TSS was not detected in either of the duplicate samples collected in October. 7
15 4.0 REFERENCES British Columbia Ministry of Environment, Lands, And Parks (BCMELP) Guidelines for interpreting water quality data. Version 1, May Prepared for the Land Use Task Force Resource Inventory Committee. Manitoba Water Stewardship Manitoba Water Quality Standards, Objectives, and Guidelines. Manitoba Water Stewardship Report Final Draft: November 28, pp. 8
16 Table 1. GPS locations (NAD 83) and sampling dates for the water quality monitoring program conducted at the two stream crossings along the KIP access road, Transect ID Date Zone Easting Northing Location Description 1 Looking Back Creek SC1-T1 14-Jul-13 15U m U/S of road crossing 23-Aug-13 15U Sep-13 15U Oct-13 not recorded SC1-T2 14-Jul-13 15U immediately D/S of road crossing 23-Aug-13 15U Sep-13 15U Oct-13 not recorded SC1-T3 14-Jul-13 15U m D/S of the road crossing 23-Aug-13 15U Sep-13 15U Oct-13 unsafe to sample SC1-T4 14-Jul-13 15U m D/S of the road crossing 23-Aug-13 15U Sep-13 15U Oct-13 unsafe to sample Unnamed Tributary SC2-T1 23-Aug-13 15U U/S of road crossing SC2-T2 23-Aug-13 15U Immediately U/S of crossing, located alongside the road SC2-T3 23-Aug-13 15U Immediately D/S of road crossing SC2-T4 23-Aug-13 15U Approximately 30 m D/S of road crossing 1 U/S = upstream; D/S = downstream 9
17 Table 2. In situ data collected at water quality monitoring transects located near the KIP access road crossing at Looking Back Creek, Transect Location 1 Transect ID Site ID Sample Date Sample Time Water Depth Sample Depth Turbidity (m) (m) (NTU) 100 m D/S SC1-T4 SC1-T Aug-13 14: m U/S SC1-T1 SC1-T Aug-13 14: SC1-T Aug-13 14: SC1-T Aug-13 14: Immediately D/S SC1-T2 SC1-T Aug-13 13: SC1-T Aug-13 14: SC1-T Aug-13 14: m D/S SC1-T3 SC1-T Aug-13 13: SC1-T Aug-13 13: SC1-T Aug-13 13: m D/S SC1-T4 SC1-T Aug-13 13: SC1-T Aug-13 13: SC1-T Aug-13 n/r m U/S SC1-T1 SC1-T Sep SC1-T Sep SC1-T Sep-13 13: Table 2. Continued. 10
18 Transect Location Transect ID Site ID Sample Date Sample Time Water Depth Sample Depth Turbidity (m) (m) (NTU) Immediately D/S SC1-T2 SC1-T Sep SC1-T Sep SC1-T Sep-13 13: m D/S SC1-T3 SC1-T Sep-13 13: SC1-T Sep SC1-T Sep-13 13: m D/S SC1-T4 SC1-T Sep-13 13: SC1-T Sep-13 13: SC1-T Sep-13 n/r m U/S (LHB 2 ) SC1-T1 SC1-T1 28-Oct :59 n/r At crossing (RHB 3 ) SC1-T2 SC1-T2 28-Oct :51 n/r m D/S SC1-T3 n/r n/r n/r 100 m D/S SC1-T4 n/r n/r n/r 1 U/S = upstream; D/S = downstream 2 Left-hand bank 3 Right-hand bank 4 Samples collected October 28 but analysed for turbidity on October
19 Table 3. TSS results for water samples collected at water quality monitoring transects located near the KIP access road crossing at Looking Back Creek, Transect Location 1 Transect ID Sample ID Laboratory ID Date Sampled Suspended Solids (mg/l) Analytical Detection Limit m U/S SC1-T1 LBC TSS-4A GX9200 7/14/ LBC TSS-4B GX9201 7/14/ Immediately D/S SC1-T2 LBC TSS-3A GX9198 7/14/ LBC TSS-3B GX9199 7/14/ m D/S SC1-T3 LBC TSS-2A GX9196 7/14/ LBC TSS-2B GX9197 7/14/ m D/S SC1-T4 LBC TSS-1A GX9194 7/14/ LBC TSS-1B GX9195 7/14/ Analytical Detection Limit m U/S SC1-T1 SC1-T1-1 L /23/ SC1-T1-2 L /23/ SC1-T1-3 L /23/ Immediately D/S SC1-T2 SC1-T2-1 L /23/ SC1-T2-2 L /23/ SC1-T2-3 L /23/ m D/S SC1-T3 SC1-T3-1 L /23/ SC1-T3-2 L /23/ SC1-T3-3 L /23/ m D/S SC1-T4 SC1-T4-1 L /23/ SC1-T4-2 L /23/ SC1-T4-3 L /23/ Analytical Detection Limit m U/S SC1-T1 SC1-T1-1 HL7129 9/10/ SC1-T1-2 HL7130 9/10/ SC1-T1-3 HL7131 9/10/ Immediately D/S SC1-T2 SC1-T2-1 HL7132 9/10/ SC1-T2-2 HL7133 9/10/2013 <4.0 SC1-T2-3 HL7134 9/10/ m D/S SC1-T3 SC1-T3-1 HL7135 9/10/2013 <4.0 SC1-T3-2 HL7136 9/10/ SC1-T3-3 HL7137 9/10/ m D/S SC1-T4 SC1-T4-1 HL7138 9/10/ SC1-T4-2 HL7139 9/10/ SC1-T4-3 HL7140 9/10/
20 Table 3. Continued. Transect Location1 Transect ID Sample ID Laboratory ID Date Sampled Suspended Solids (mg/l) Analytical Detection Limit m U/S (LHB 2 ) SC1-T1 SC1-T1 HY /28/ At crossing (RHB 3 ) SC1-T2 SC1-T2 HY /28/ m D/S SC1-T3 not sampled due to ice formation and log dams 100 m D/S SC1-T4 not sampled due to ice formation and log dams 1 U/S = upstream; D/S = downstream 2 Left-hand bank 3 Right-hand bank 13
21 Table 4. Nutrient results for water samples collected at water quality monitoring transects located near the KIP access road crossing at Looking Back Creek, Transect Maxxam Date Nitrate/ Kjeldahl Dissolved Transect Location 1 ID Sample Ids IDs Sampled Nitrate-N Nitrite-N Nitrite-N Nitrogen Nitrogen Phosphorus Phosphorus (mg/l) (mg/l) (mg/l) (mg/l) (mg/l) (mg/l) (mg/l) Analytical Detection Limit m U/S SC1-T1 LBC TSS-4A GX9200 7/14/2013 <0.020 <0.0050* <0.020* * LBC NP-4A GX9208 LBC P-4A GX9216 LBC TSS-4B GX9201 7/14/2013 <0.020 <0.0050* <0.020* * LBC NP-4B GX9209 LBC P-4B GX9217 Immediately D/S SC1-T2 LBC TSS-3A GX9198 7/14/2013 <0.020 <0.0050* <0.020* * LBC NP-3A GX9206 LBC P-3A GX9214 LBC TSS-3B GX9199 7/14/2013 <0.020 <0.0050* <0.020* * LBC NP-3B GX9207 LBC P-3B GX m D/S SC1-T3 LBC TSS-2A GX9196 7/14/2013 <0.020 <0.0050* <0.020* * LBC NP-2A GX9204 LBC P-2A GX9212 LBC TSS-2B GX9197 7/14/2013 <0.020 <0.0050* <0.020* * LBC NP-2B GX9205 LBC P-2B GX m D/S SC1-T4 LBC TSS-1A GX9194 7/14/2013 <0.020 <0.0050* <0.020* * LBC NP-1A GX9202 LBC P-1A GX9210 LBC TSS-1B GX9195 7/14/2013 <0.020 <0.0050* <0.020* * SC1-T4 LBC NP-1B GX9203 LBC P-1B GX
22 Table 4. Continued. Transect Maxxam Date Nitrate/ Kjeldahl Dissolved Transect Location ID Sample IDs IDs Sampled Nitrate-N Nitrite-N Nitrite-N Nitrogen Nitrogen Phosphorus Phosphorus (mg/l) (mg/l) (mg/l) (mg/l) (mg/l) (mg/l) (mg/l) Analytical Detection Limit m U/S SC1-T1 SC1-T1-1 HL7129 9/10/2013 < < SC1-T1-2 HL7130 9/10/2013 < < SC1-T1-3 HL7131 9/10/2013 <0.020 <0.002 < Immediately D/S SC1-T2 SC1-T2-1 HL7132 9/10/2013 <0.020 <0.002 < SC1-T2-2 HL7133 9/10/2013 <0.020 <0.002 < SC1-T2-3 HL7134 9/10/2013 < < m D/S SC1-T3 SC1-T3-1 HL7135 9/10/2013 <0.020 <0.002 < SC1-T3-2 HL7136 9/10/ SC1-T3-3 HL7137 9/10/2013 < < m D/S SC1-T4 SC1-T4-1 HL7138 9/10/2013 <0.020 <0.002 < SC1-T4-2 HL7139 9/10/2013 <0.020 <0.002 < SC1-T4-3 HL7140 9/10/2013 <0.020 <0.002 < U/S = upstream; D/S = downstream 15
23 Table 5. In situ data collected at water quality monitoring transects located near the KIP access road crossing at unnamed tributary, Transect Location 1 Transect ID Sample ID Sample Date Sample Time Water Depth Sample Depth Turbidity (m) (m) (NTU) U/S of road crossing SC2-T1 SC2-T1 23-Aug-13 16: Immediately U/S SC2-T2 SC2-T2 23-Aug-13 16: Immediately D/S SC2-T3 SC2-T3 23-Aug-13 16: m D/S SC2-T4 SC2-T4 23-Aug-13 15: U/S of road crossing SC2-T1 SC2-T1 10-Sep-13 15: Immediately U/S SC2-T2 SC2-T2 10-Sep-13 15: Immediately D/S SC2-T3 SC2-T3 10-Sep-13 14: m D/S SC2-T4 SC2-T4 10-Sep-13 14: U/S of road crossing SC2-T1 not sampled due to ice formation - Immediately U/S SC2-T2 SC2-T Oct :47 n/r n/r 0.66 Immediately D/S SC2-T3 SC2-T3 28-Oct :37 n/r n/r m D/S SC2-T4 not sampled due to ice formation - 1 U/S = upstream; D/S = downstream 2 Erroneously labelled as Site SC2-T1 but sample was collected near SC2-T2 (i.e., immediately upstream of the culvert) 3 Samples collected October 28 but analysed for turbidity on October
24 Table 6. TSS results for water samples collected at water quality monitoring transects located near the KIP access road crossing at Unnamed Tributary, Values in italics are considered suspect. Transect Location 1 Transect ID Sample ID Laboratory ID Date Sampled Suspended Solids (mg/l) Analytical Detection Limit 2.0 U/S of road crossing SC2-T1 SC2-T1 L Aug immediately U/S SC2-T2 SC2-T2 L Aug Immediately D/ SC2-T3 SC2-T3 L Aug m D/S of crossing SC2-T4 SC2-T4 L Aug Analytical Detection Limit 4.0 U/S of road crossing SC2-T1 SC2-T1 HL Sep Immediately U/S SC2-T2 SC2-T2 HL Sep Immediately D/S SC2-T3 SC2-T3-2 HL Sep-13 < m D/S of crossing SC2-T4 SC2-T4 HL Sep-13 <4.0 Analytical Detection Limit 4.0 U/S of road crossing SC2-T1 not sampled due to ice formation - Immediately U/S SC2-T2 SC2-T1 2 HY Oct-13 <4.0 Immediately D/S SC2-T3 SC2-T3 HY Oct-13 < m D/S of crossing SC2-T4 not sampled due to ice formation - 1 U/S = upstream; D/S = downstream 2 Erroneously labelled as Site SC2-T1 but sample was collected near SC2-T2 (i.e., immediately upstream of the culvert) 17
25 Table 7. Nutrient results for water samples collected at water quality monitoring transects located near the KIP access road crossing at Unnamed Tributary, Transect Location Sample ID Maxxam ID Date Sampled Nitrate- N Nitrite- N Nitrate/Nitrite- N Kjeldahl Nitrogen Nitrogen Dissolved Phosphorus Phosphorus (mg/l) (mg/l) (mg/l) (mg/l) (mg/l) (mg/l) (mg/l) Analytical Detection Limit U/S of road crossing SC2-T1 HL Sep-13 <0.020 <0.002 < Immediately U/S SC2-T2 HL Sep-13 <0.020 <0.002 < Immediately D/S SC2-T3 HL Sep-13 <0.020 <0.002 < m D/S SC2-T4 HL Sep-13 <0.020 <0.002 <
26 Table 8. Results for QA/QC samples submitted to ALS and Maxxam Laboratories in Results exceeding five times the analytical detection limit are indicated in red. Sample Type Sample ID Laboratory ID Date Sampled Suspended Solids Nitrate-N Nitrite-N Nitrate/ Nitrite-N Kjeldahl Nitrogen Nitrogen Dissolved Phosphorus Phosphorus (mg/l) (mg/l) (mg/l) (mg/l) (mg/l) (mg/l) (mg/l) (mg/l) Analytical Detection Limit 2.0 Field Blank SCL-T2-F L Aug-13 < Trip Blank SCL-T2-T L Aug-13 < Analytical Detection Limit Field Blank SJ-1 HL Sep-13 <4.0 <0.020 <0.002 < < < Trip Blank MJ-1 HL Sep-13 <4.0 <0.020 <0.002 < < < Duplicate SC2-T1 HY Oct-13 16:47 < Duplicate Field Duplicate HY Oct-13 16:47 <

27 Figure 1. Location of water quality monitoring transects near stream crossings along the KIP access road,


28 Figure 2. Clear-span bridge over Looking Back Creek. Figure 3. Road crossing for the unnamed tributary. 21


29 Figure 4. Brook Stickleback in the culvert at the unnamed tributary on August 20, Figure 5. Exposed shorelines at Looking Back Creek on August 20,


30 Figure 6. Sediment plume entering Looking Back Creek from the left-hand bank, August 20, Figure 7. Rip rap installation on each shore surrounding the clear-span bridge at Looking Back Creek, August 27,