When Energy Markets Go Crazy! Holly O Higgins Energy Analyst State Energy Office. Heating the Midwest Conference Green Bay April 29- May 1, 2014
|
|
|
- Peter Miller
- 5 years ago
- Views:
Transcription

1 When Energy Markets Go Crazy! Holly O Higgins Energy Analyst State Energy Office Heating the Midwest Conference Green Bay April 29- May 1, 2014
2 Overview Compare pricing of hea/ng fuels Review of hea/ng fuels used in Wisconsin and their characteris/cs Price/MMBtu The role of biomass for the residen/al market Prognos/ca/on Supply and pricing of winter fuels this summer, and upcoming winter


3 Residential Heating Fuels Source: US Census Bureau/American Community Survey
4 Fuel Characteristics Hea/ng Oil Similar to on- road diesel fuel; more sulfur and red dye Prices generally follow the crude oil market Demand is seasonal winter price peaked on February 24 at $3.712/gallon ($26.765/MMBtu) Average seasonal price $3.559/gallon ($25.661/MMBtu) Unregulated fuel Electricity Available across the state Most expensive fuel for space hea/ng with average seasonal price of $.135/kWh ($39.668/MMBtu) Seasonal consump/on more apparent in the summer Regulated fuel
5
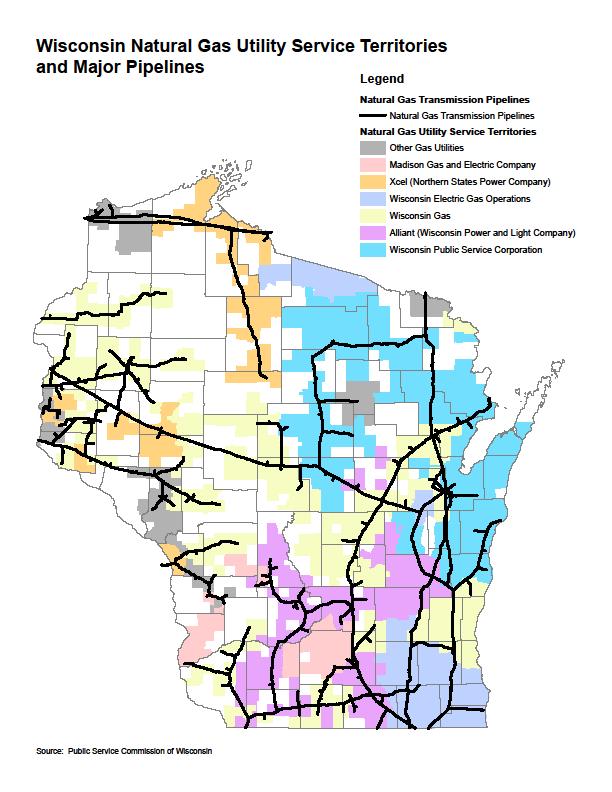
6 Fuel Characteristics Natural Gas Most popular, least expensive fuel for space hea/ng in Wisconsin. Average price for the season is $8.50/MMBtu Emissions: 117 lbs of CO2/MMBtu. HO, lbs/mmbtu; propane, 139 lbs/mmbtu. Regulated fuel U/lity price set by commodi/es market Propane Residen/al and agricultural customers Price set by commodi/es market; historically tracks petroleum, recently tracking natural gas Unregulated fuel
7 Residential Energy Prices Residen.al Energy Prices September 2010 through April 13, 2014 $ $ $ $/MMBtu $ $ $ $ /13/ /13/ /13/ /13/2010 1/13/2011 2/13/2011 3/13/2011 4/13/2011 5/13/2011 6/13/2011 7/13/2011 8/13/2011 9/13/ /13/ /13/ /13/2011 1/13/2012 2/13/2012 3/13/2012 4/13/2012 5/13/2012 6/13/2012 7/13/2012 8/13/2012 9/13/ /13/ /13/ /13/2012 1/13/2013 2/13/2013 3/13/2013 4/13/2013 5/13/2013 6/13/2013 7/13/2013 8/13/2013 9/13/ /13/ /13/ /13/2013 1/13/2014 2/13/2014 3/13/2014 4/13/2014 Hea/ng Oil Propane Natural Gas Electricity
8 Residential Energy Prices Residen.al Energy Prices September 2010 through April 13, 2014 $ $ $ $/MMBtu $ $ $ $ /13/ /13/ /13/ /13/2010 1/13/2011 2/13/2011 3/13/2011 4/13/2011 5/13/2011 6/13/2011 7/13/2011 8/13/2011 9/13/ /13/ /13/ /13/2011 1/13/2012 2/13/2012 3/13/2012 4/13/2012 5/13/2012 6/13/2012 7/13/2012 8/13/2012 9/13/ /13/ /13/ /13/2012 1/13/2013 2/13/2013 3/13/2013 4/13/2013 5/13/2013 6/13/2013 7/13/2013 8/13/2013 9/13/ /13/ /13/ /13/2013 1/13/2014 2/13/2014 3/13/2014 4/13/2014 Hea/ng Oil Propane Natural Gas Electricity Wood Pellets Wood Chips
9 What s in a Price? 1. Supply and Demand 2. Seasonality 3. Regulation
10 Supply and Demand Keeping supply and demand in balance Commodities market Propane, heating oil and natural gas Price planning keeping stable pricing for customers Supply variables Storage Pipeline capacity, allocation Demand variables Weather Availability of other fuels
11 LP Production LP production increases with the development of natural gas from shale formations
12 LP Exports

13 LP Inventories 10/2013 In October 2013, US propane stocks, middle of historic range

14 Record Domestic Demand for LP Domes/c demand hits a record high


15 Wet Fall Wet fall for crop harves/ng
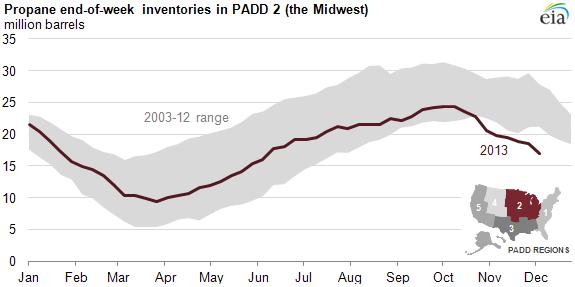
16 LP Inventories 12/2013
17 Very Cold Winter Very cold winter; 19.7% more hea/ng degree days than the previous winter Normal Population-Weighted HDDs ( ) and Actual Population-Weighted HDDs, January 2013 to March 2014 Hea.ng Degree Days, NOAA Normals, Popula.on- Weighted January February March April May June July August September October November December January February March Hea.ng Degree Days, Popula.on- weighted January 2013 to March 2014 Hea/ng Degree Days, Popula/on Weighted, NOAA Normals, HDDs - - Jan to March 2014

18 Midwest LP Supply Disruptions Midwest terminals unable to replenish supply acer large demand for crop drying Rail delivery disrup/ons Cochin Pipeline reversal
19 Result? High LP Prices Very Cold Winter Reduced Inventories High LP Prices High Domes/c Demand Supply Disrup/ons Exports
20 Natural Gas Pricing Cold weather High demand Spot market volume and percentage $1.40 $1.20 $1.00 $0.80 $0.60 $0.40 $0.20 Wisconsin Residen.al Natural Gas Prices Per Them (includes u.lity meter charge) April $ Per Therm $0.00 Jan Feb Mar Apr May Jun Jul Aug Sep Oct Nov Dec
21 0 Mar Jan Nov Sep Jul May Mar Jan Nov Sep Jul May Mar Jan Nov Sep Jul May Mar Jan Nov Sep Natural Gas Pricing Henry Hub Natural Gas Spot Price (Dollars per Million Btu) Henry Hub Natural Gas Spot Price (Dollars per Million Btu) 2 1
22 Regulation and Pricing Regulated Price increases are less dramatic Unregulated Price spikes are more dramatic Datasets
23 Danger of High Prices The danger with high prices Demand destruction Example Gasoline prices in 2008 LP prices in 2013?
24 Role of Biomass? Biomass as space heating fuel Fuel switching Primary vs. secondary thermal source Costs Emissions Resource proximity and availability
25 trillion Btu/year Residential Biomass Consumption Residen.al Wood Energy Use Fireplaces Stoves
26 Fuel Switching Wood vs. LP Energy cost savings are not guaranteed Savings? It depends. Thermal portfolio diversification thermal peak shaving Who are the customers?
27 Pros and Cons - - Homegrown fuel, supports Wisconsin and the Midwest economy, and adds jobs - - Carbon neutral - - Displaces fossil fuels - - Sustainable and renewable fuel with rela/vely stable pricing - - Variable energy content - - Requires physical presence to tend the unit - - Requires physical strength to load wood or pellets - - Emissions must be controlled
28 the Crystal Ball Says Prices Summer Spot prices will con/nue to decline. Average Henry Hub price in 2014 expected to be $4.44/MMBtu (the price was $6/MMBtu in February and is now $4.90/MMBtu) Prices will be slightly higher this summer Winter EIA is es/ma/ng that households using natural gas can expect to pay about 13% more this winter. Supply Natural Gas The working gas in storage at the end of March this year was the lowest in 11 years. A large rebuild is expected through October. EIA expects that demand from the power sector will be lower due to higher prices, but demand from the residen/al, industrial and commercial sectors is expected to offset the drop in
29 the Crystal Ball Says
30 the Crystal Ball Says Prices Winter EIA is projec/ng that households will spend 2% less this winter than last winter due to an/cipated 5% decrease in price and 3% increase in consump/on. Supply Hea/ng Oil Inventories of dis/llates are projected to start the summer 6 million barrels lower than last summer, and 26 million barrels lower than the 5- year average. These inventories will build throughout the summer, and are expected to be on par with inventories at the end of last summer, which were well below the 5- year average.
31 the Crystal Ball Says Prices Winter EIA is projec/ng that households will spend 9% more this winter in the midwest and 54% higher na/onwide. Supply Propane Exports of propane are expected to con/nue climbing which puts pressure on inventories and supply. The summer build in of supply has begun slowly. The loss of the Cochin pipeline will reduce supply in the Midwest which is being addressed through three new terminals, two in MN and one in WI. These terminals will be served by rail car.
32 the Crystal Ball Says Prices Electricity EIA es/mates an increase of about 2% in overall seasonal cost. The pressure on electric prices is the result of commodity costs for fuel and power plant fuel switching.
33 Questions? Holly O Higgins Energy Analyst (608) holly.ohiggins@wisconsin.gov Wisconsin State Energy Office 101 East Main St., 6 th Floor Madison, WI energyindependence.wi.gov