From footprint to ferns: Alberta Biodiversity Monitoring Institute supporting forestry planning
|
|
|
- Elfrieda Lane
- 5 years ago
- Views:
Transcription


1 From footprint to ferns: Alberta Biodiversity Monitoring Institute supporting forestry planning Alberta Biodiversity Monitoring Institute

2 ABMI Goal Monitor status (distribution and abundance) and trend (change over time) of biodiversity throughout Alberta Species Human footprints Native vegetation Main focus on assessing cumulative effects on biodiversity Multi-species Regional scale But also wish to understand stressor-response relationships Alberta Biodiversity Monitoring Institute


3 Taxa Surveyed Birds Mammals Vascular Plants Mosses Lichens Mites Aquatic Vascular Plants Aquatic Invertebrates Alberta Biodiversity Monitoring Institute Data collection Lab processing Data verification & storage Analyses Reporting
 - 3002 bird (ARU) - 610 plant - 54 other Alberta Biodiversity Monitoring")
4 Species Data ,039 systematic sites 4,370 targeted sites all taxa mammals (camera) mammal (snow tracking) bird (ARU) plant - 54 other Alberta Biodiversity Monitoring Institute 4

5 Data collation partnerships BBS n=7538 BAM n = ABMI n=9367 EVERYBODY! Alberta Biodiversity Monitoring Institute 5

 3x7 km sampling site 1,656 sites 20 km grid 5.")
6 Land Surface Monitoring and Outcomes Two key data types are created to detect, assess and report on relationships between land-use patterns and biodiversity in AB Land Cover Inventory Province-wide (Wall to wall ) Human Footprint Inventory Sample-based (3x7 km sites) 3x7 km sampling site 1,656 sites 20 km grid 5.25% of Alberta Alberta Biodiversity Monitoring Institute 6

7 Land Surface Monitoring and Outcomes Provincial scale Land Cover inventory: Complete seamlessly created representation of provincial scale Land Cover inventory for AB Alberta Biodiversity Monitoring Institute 7 Castilla, G., Hird, J., Hall, R., Schieck, J. and McDermid, G Completion and updating of a Landsat-based land cover polygon layer for Alberta, Canada. Canadian Journal of Remote Sensing, 40:2, pp
 by mapping: 21 layers of HF types")

8 Land Surface Monitoring and Outcomes Human Footprint: key driver of biodiversity change ABMI produces AB-wide Human Footprint Inventory (HFI) by mapping: 21 layers of HF types More than 115 feature types More than 4 million features Available 2007, 2010, 2012, 2014; 2016 in progress Area of Human Footprint per Township [%] Alberta Biodiversity Monitoring Institute 8


9 Land Surface Monitoring and Outcomes AHFMP: Well sites enhancements Alberta Biodiversity Monitoring Institute 9

10 Human Footprint for Biodiversity Monitoring Final AB-wide Human Footprint Inventory (HFI) based on 21 layers of HF types Available 2007, 2010, 2012, 2014 versions; 2016 in progress Alberta Biodiversity Monitoring Institute 10
 American")
 Human Footprint")
")

11 Species Models >900 species (cumulative effects) American Redstart Habitat Suitability (forested regions) Human Footprint Vegetation Change From Reference (Intactness / Cumulative Effects) Current Habitat Suitability Alberta Biodiversity Monitoring Institute Reference Habitat Suitability


")

12 Species Models >900 species Detections White Zone Perennial Sow Thistle (not native to Alberta) Green Zone Human Footprint Vegetation Reference Condition Predicted Current Conditions Change From Reference (Intactness / Cumulative Effects) Was Not Present Historically Alberta Biodiversity Monitoring Institute

 American Redstart then")
13 Integration Among Species Moose Sow Thistle Convert each pixel to a common scale 100 = abundance equal to reference. 0 = abundance very different than reference (either decrease or increase) Biodiversity Intactness (birds, mammals, plants, mosses, lichens, mites) American Redstart then Average across species Alberta Biodiversity Monitoring Institute


14 Response to Disturbance (Green Zone) % Population Change Brown Creeper All Birds % Population Change 23 Species >100% Shrubby, urban & open-country birds eg. Orange-crowned Warbler Alder Flycatcher 25 Species >50% Top 10 Black-throated Green Warbler Bay-breasted Warbler Cap-may Warbler Golden-crowned Kinglet Western Tanager Winter Wren Brown Creeper Canada Warbler Boreal Chickadee Red-breasted Nuthatch Ovenbird All Plants 10 Species >200% Mainly grasses & sedges including non-native species Alberta Biodiversity Monitoring Institute % Population Change 98 Species >50% Top 10 Twayblade Peppergrass Speedwell Smartweed Buttercup White Gernaium Anemone Crowberry Hedge Nettle Fruited Sedge Bog Orchid
15 The Ultimate Goal Challenges Waiting for significant trend in a population risks changes we do not want to see happen So we increasingly use models to predict the status of wildlife populations and link to survey data to see if things are as we expect them to be BUT waiting for newest habitat and footprint layers means there is a delay in predictions about state of biodiversity Working towards real time monitoring of state of environment and biodiversity via deep learning & artificial intelligence Alberta Biodiversity Monitoring Institute 15

16 Geospatial Product Innovation Predictive Land Cover Monitoring System Near-real time monitoring Predictive mapping and modeling Dynamic system to account for natural variability vs. human-driven landscape changes Alberta Biodiversity Monitoring Institute 16

 scale:")


17 ABMI Geospatial Data Land Cover Data and Product Sample-based (3x7 km) scale: Vegetation/Land Cover mapping (1:500/1,500) Alberta Biodiversity Monitoring Institute 17

18 ABMI Geospatial Data Land Cover Data and Product Sample-based (3x7 km) scale: land cover mapping at 1:500/1,500 scale Internal QA/QC process External audit process Used for validation of other Land Cover products, e.g., newly developed Probability of Wetland dataset Very detailed & attribute rich data: 9 moisture classes 21 non-vegetation classes 8 management classes 28 modified wetland classes 22 tree species Alberta Biodiversity Monitoring Institute 18


19 Geospatial Product Innovation Landcover monitoring: continuous, integrated system for predictive mapping of landcover and vegetation in Alberta Topographic information o AB-wide DEM o Catchment boundaries Hydrographic information o Current surface water o Hydro-temporal variarion (hydroperiod) Landcover information o Probability of wet/dry o Probability of Fen cover Alberta Biodiversity Monitoring Institute 19
 TandemX DEM data (German Space Agency collaboration) Alberta Biodiversity Monitoring Institute 20")
20 Predictive Landcover system for Biodiversity Monitoring AB-wide DEM from ALOS (Japan Space Agency) circa 2011 LiDAR-based DEM (GOA collaboration) TandemX DEM data (German Space Agency collaboration) Alberta Biodiversity Monitoring Institute 20


21 Predictive Landcover system for Biodiversity Monitoring Catchment delineation for ABMI s wetlands Pre-processing: filling the sinks/depressions and breaching Alberta Biodiversity Monitoring Institute 21


22 Predictive Landcover system for Biodiversity Monitoring Current surface water in LAR Alberta Biodiversity Monitoring Institute 22
: % of time each pixel is water Alberta Biodiversity")


23 Predictive Landcover system for Biodiversity Monitoring Hydro-temporal variation (hydroperiod): % of time each pixel is water Alberta Biodiversity Monitoring Institute Tracks if a lake/waterbody is permanent or recurring Uses pixel stack 104 billion pixels across time/space DeLancey E.R., Kariyeva J., Cranston J., Brisco B Monitoring hydro temporal variability in Alberta, Canada with multi-temporal Sentinel-1 SAR data. Canadian Journal of Remote Sensing. In review. 23

24 Geospatial Product Innovation Probability of Wet Area in LAR Probability of Fen in LAR Alberta Biodiversity Monitoring Institute 24


25 Geospatial Product Innovation Probability of Wet/Dry in LAR Alberta Biodiversity Monitoring Institute 25

26 Geospatial Product Innovation Predictive Land Cover in LAR Probability of Wet Area Probability of Fen Alberta Biodiversity Monitoring Institute 26
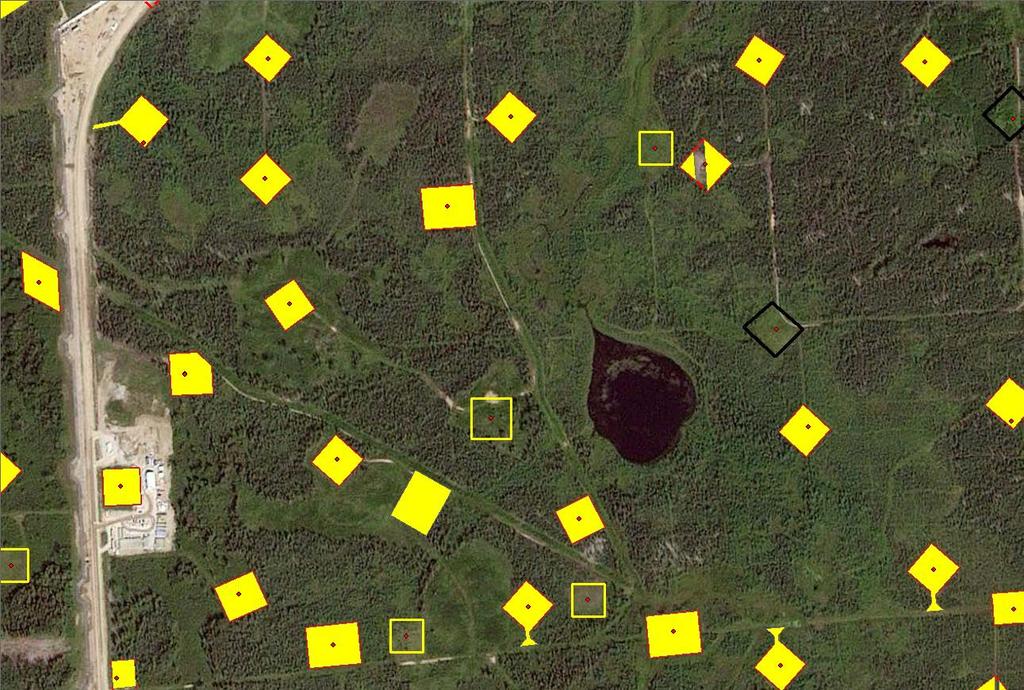
27 Future species models Why try and guess what species like? A lot of time and effort goes into developing layers that describe whether something is a fen, a bog, etc. We then put these into wildlife models and use a lot of arbitrary human decision to see what is predictive. An alternative approach we are currently working on is image processing using neural networks. Here we provide raw images of the landscape and let the artificial intelligence know where the species were and were not found. Results on a few species show better predictive accuracy than traditional modelling approaches Alberta Biodiversity Monitoring Institute 27


28 AI and autonomous monitoring Alberta Biodiversity Monitoring Institute 28
29 Thanks for listening Alberta Biodiversity Monitoring Institute 29