Assessing Real Time - Drainage Water Management
|
|
|
- Frank Gibson
- 5 years ago
- Views:
Transcription
 344-7117 Photo Credit: Purdue")
1 Assessing Real Time - Drainage Water Management Jim Klang, PE Kieser & Associates, LLC 536 East Michigan Ave / Suite 300, Kalamazoo, MI (269) Photo Credit: Purdue Engineering
2 Today s Talk K&A s project role Selected watersheds DRAINMOD modeling progress Early indications Next steps Preliminary indications Open discussion/feedback
3 K&A s Role in this Project Provide an assessment of the potential benefits from using Real Time Drainage Water Management in two watersheds Precipitation evaluation Stream flow characteristics Field scale water storage evaluation DRAINMOD model; developed by Dr. Wayne Skaggs, North Carolina State University Mass balance approach for hydrology Regionally representative site selection: 2 watersheds; 2-3 representative crops; 2 dominant soil classifications Watershed evaluation Extrapolate representative field scale storage benefit results up to watershed scale using a Geographic Information System spatial analysis

4 Selected Watersheds 1. Pigeon River Drains to Saginaw Bay; Huron Lake Hydrologic Unit Code: River Raisin Drains to Lake Erie Hydrologic Unit Code:
5 Water Storage Benefits Water storage can benefit rivers and lakes by: Reducing peak hydrographs and thereby assisting with bank stabilization Reducing volume and associated pollutant loading
6 DRAINMOD Hydrology mass budget approach Model Inputs: Rainfall (or Irrigation) Surface Storage & Runoff Infiltration Evapotranspiration (ET) Tile Drainage Deep Infiltration (or Seepage)
 River Raisin Watershed 1,042 square miles (~666,880")
7 DWM Stream Flow Benefits are Influenced by Scale Pigeon River Watershed 125 square miles (~80,000 acres) River Raisin Watershed 1,042 square miles (~666,880 acres)
8

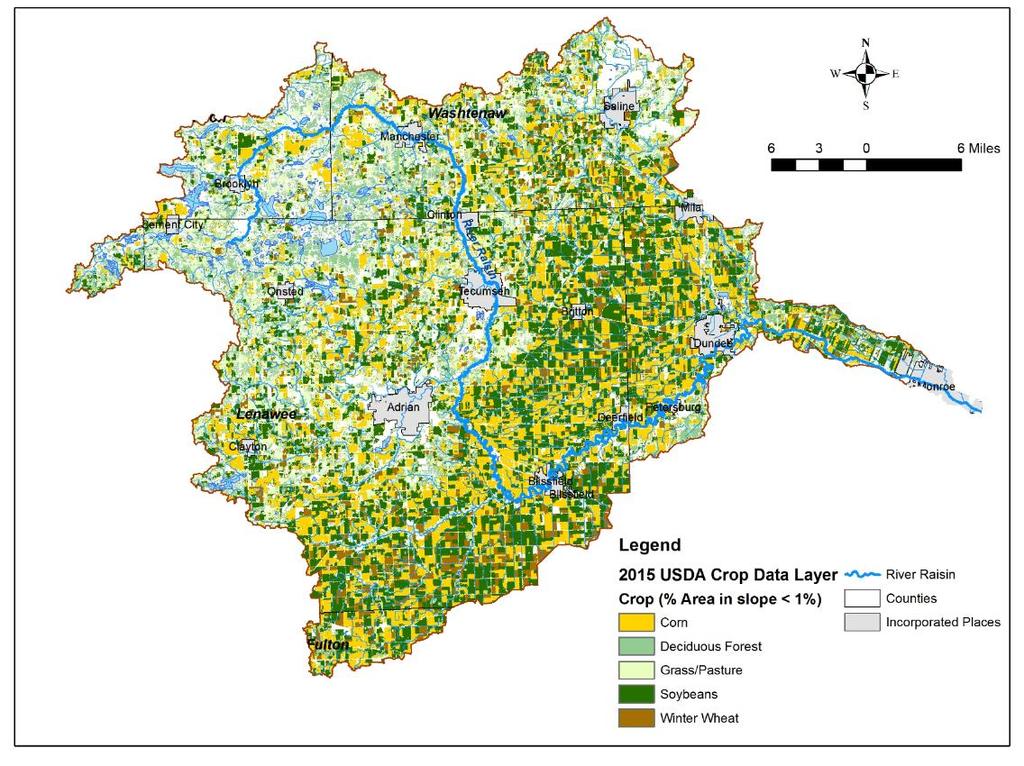
9 River Raisin DWM Available Sites
10 DWM Water Storage Benefits are Influenced by Timing Timing of precipitation, as: Rainfall Snow melt Timing of field preparation and planting Timing of increased crop evapotranspiration As evidenced by current stream flows
11 Average Growing Season Rainfall at Adrian, Michigan
12 River Raisin Precipitation 6 years (20%) 3 years (10%) 1 year (3%)
13 River Raisin Hydrograph Probability of Occurrence
 Clay layer often at ~32 inches DWM coverage for 80% of field Design could be used for")
14 Tile Design Typical in River Raisin Lateral tile: Diameter 4 (in) Spacing (ft) Tile depth (in) 1 percent slope Trunk tile 8-12 (in) Clay layer often at ~32 inches DWM coverage for 80% of field Design could be used for subirrigation
15 Current DWM Operation Winter weir height 12 inches from surface Farmers currently have 1 to 5 structures per field Planting and prep weir height 24 inches from surface Pulled from snow melt through mid June Raised back to 18 inches from surface Mid June through prep for harvest Field access for management needed within one day of finding pest problems If a three inch rain occurs weirs are pulled
16 Estimating DWM s Potential Benefits at Watershed Scale Field scale DRAINMOD model results (before and after DWM installation) Use representative sites: Soil specific (using dominant 1% slope soils) Crop rotations Drainage system design DWM weir depth and dates changed Limited to 2001 to 2016 because of ET data Results scaled up for watershed benefits using Geographic Information System (GIS)
17 Next Steps Calibrate DRAINMOD to local tile flow monitoring data Subtract DWM daily rates from standard tile rates Convert output into summed weekly acrefeet Evaluate potential for storage benefits in years with moderate weather events Identify drought and wet weather limitations
18 Preliminary Findings Highest flows are prior to periods of crop growth Highest precipitation prior to periods of crop growth Crops thrive on winter and spring soil moisture increases These factors may limit storage benefits of Real Time DWM from July to September
19 Open discussion/ feedback
20 Thank you for your participation! Jim Klang, PE Kieser & Associates, LLC 536 East Michigan Ave / Suite 300, Kalamazoo, MI (269)
21 Investigating Hydrograph Peak Flow Reduction Potential Appendix of Current Project Findings
22 Pigeon River Precipitation Statistical Analysis Bad Axe, Michigan 30-yr period of record ( ) Focus on flows from March October Summed weekly events for statistical analysis of: Recurrence Intervals Event counts Probability
23 River Raisin Precipitation Statistical Analysis Averaged Adrian and Ann Arbor, Michigan Sites 30-yr period of record ( ) Focus on flows from March October Summed weekly events for statistical analysis of: Recurrence Intervals Event counts Probability


24 30 Years of Weekly Rainfall; River Raisin (Averaging Adrian & Ann Arbor)
25 City of Ann Arbor Precipitation Totals for Seven Days Starting July 19 th Recurrence interval Probability of occurrence in a year Year Sorted by Highest Total Week Total (inches) Recurrence Interval (Years) Probability of Occurrence In an Given Year Year Sorted by Rank Week of July % % % % % % % % % % % % % % % % Note: Only rain exceeding 50% of week s data presented here.
26 Number of Months Exceeding River Raisin Precipitation 250 March to October (240 Months over 30-Yrs) Months With At Least One Week of Precipitation Exceeding Total Inches of Rain in a Week Greater Than:
27 Number of Months Exceeding River Raisin Precipitation year Record of July Weekly Rainfall Occurrences Exceeding years (20%) 3 years (10%) Weekly Total Inches of Rain Greater Than; Using a Ann Arbor and Adrian Average Value 1 year (3%)
28 Example Crop Evapotranspiration (in a stress free cropping year)
29 Inches of Precipitation, ET o and Corn ET Precipitation Comparison with Evapotranspiration 2014 Comparison of Weekly Precipitation and Corn ET at Petersburg, Michigan Precipitation (inches) DRAINMOD; ET for Corn (Inches)
30 Stream Flow Statistical Analysis 1. Pigeon River USGS station # , Caseville, MI Period of Record: 10/1/1986-9/30/1993 & 10/1/2014 Present Contributing watershed 125 square miles (~80,000 acres) 2. River Raisin USGS station # , Monroe, MI Period of Record: 10/1/ Present Contributing watershed 1,042 square miles (~666,880 acres)
31 Flow ac-ft/week River Raisin Hydrograph Probability of Occurrence Weekly Flow Data 140, , ,000 80,000 July 19 Max Flow 23,776 Acre-Feet 60,000 40,000 20,000-1-Mar 1-Apr 1-May 1-Jun 1-Jul 1-Aug 1-Sep 1-Oct Week of Year Average Max Average+2 STD
32 River Raisin Comparison of Precipitation & Flow River Raisin Flow (acre-feet, Week of July 19) Recurrence Interval (Years) Probability of Occurrence in a Given Year Year Sorted by Rank Week of July % , % , % , % , % , % , % , % , % , % , % , % , % , % , % , % ,560 Ann Arbor Precipitation, (inches, Week of July 19) Recurrence Interval (Years) Probability of Occurrence In an Given Year Year Sorted by Rank Week of July % % % % % % % % % % % % % % % % Note: Only heaviest flow/most rainy 50% of data presented here.
33 River Raisin Hydrograph Probability of Occurrence
34 River Raisin Week Comparison of Precipitation & Flow River Raisin Flow Week of July 26 (acre-feet) Recurrence Interval (Years) Probability of Occurrence in a Given Year Year Sorted by Rank Week of July % , % , % , % , % , % , % , % , % , % , % , % , % , % , % , % ,064 Precipitation Week of July 19 (inches, at Ann Arbor, MI) Recurrence Interval (Years) Probability of Occurrence In an Given Year Year Sorted by Rank Week of July % % % % % % % % % % % % % % % % Note: Only heaviest flow/most rainy 50% of data presented here.
35 River Raisin Hydrograph Probability of Occurrence