Updated Vulnerability Assessment and Scoring of Wellhead Protection Areas Regional Municipality of York
|
|
|
- Amie Lily Blair
- 5 years ago
- Views:
Transcription

1 Addendum Report Updated Vulnerability Assessment and Scoring of Wellhead Protection Areas Regional Municipality of York Prepared For: The Regional Municipality of York Environmental Services Environmental Promotion and Protection November 2009 Prepared by: 3363 Yonge Street Toronto, Ontario M4N 2M6
2

3 Earth Science Information Systems November 2009 Tanya Kampherm Martin, M.Sc. Program Coordinator, Water Resources Environmental Services Regional Municipality of York Yonge Street Newmarket, ON L3Y 6Z1 T: x5106 F: RE: Update to Vulnerability Assessment and Scoring of Wellhead Protection Areas for the Regional Municipality of York Dear Tanya: We are pleased to provide a copy of our addendum report for your review. Part 1 of this report describes work conducted to update the vulnerability scoring and mapping in accordance with the new Technical Rules for the Clean Water Act, issued in November 2008 (and amended in December 2008). Part 2 of this report shows updated Wellhead Protection Areas (WHPA) and Intrinsic Vulnerability Scoring (IVS) maps for the Nobleton, Schomberg and Mount Albert wellfields, based on revised EA reports and updated geology in those areas. We thank you again for the opportunity to work with you on this important Source Water Protection project. Yours truly, Earthfx Incorporated Dirk Kassenaar, M.Sc., P.Eng. E.J. Wexler, M.Sc., M.Sc. (Eng) Steve Shikaze, M.Sc., P.Eng Region of York Acknowledgement: This project has received funding support from the Ontario Ministry of Environment. Such support does not indicate endorsement by the Ministry of the contents of this material 3363 Yonge St., Toronto, Ontario, Canada M4N 2M6 T: F:
4 Update to Vulnerability Assessment and Scoring of Wellhead Protection Areas, Regional Municipality of York EXECUTIVE SUMMARY Table of Contents 1 INTRODUCTION SCOPE OF WORK Part 1 Updating the Existing Vulnerability Scoring Part 2 Updating the Vulnerability Assessment and Scoring of Nobleton, Schomberg and Mount Albert Wellfields Task 1: Assessment and Mapping of Aquifer Vulnerability in the WHPA Task 2: Assignment and Mapping of Vulnerability Scores Task 3: Analysis and Rating of Uncertainty BACKGROUND METHODOLOGY Model Selection Modelling Approach Vulnerability Assessments Methods Intrinsic Vulnerability Scores Uncertainty Assessment STUDY RESULTS PART Update of Intrinsic Vulnerability Scores PART Assessment and Mapping of Aquifer Vulnerability in the WHPA for Nobleton, Schomberg and Mount Albert Wells Assignment and Mapping of Intrinsic Vulnerability Scores for Nobleton, Schomberg and Mount Albert Wells Analysis and Rating of Uncertainty Vulnerability Mapping Uncertainty Uncertainty Related to Data Distribution within the TOT Zones...14 LIMITATIONS REFERENCES CITED...17 Earthfx Inc. 4
5 LIST OF FIGURES Figure 1: Updated Intrinsic Vulnerability Scoring around the Aurora and Newmarket wells Figure 2: Updated Intrinsic Vulnerability Scoring around the Holland Landing and Queensville wells Figure 3: Updated Intrinsic Vulnerability Scoring around the Ballantrae wells Figure 4: Updated Intrinsic Vulnerability Scoring around the Stouffville wells Figure 5: Updated Intrinsic Vulnerability Scoring around the King City wells Figure 6: Updated Intrinsic Vulnerability Scoring around the Kleinburg wells Figure 7: Updated Intrinsic Vulnerability Scoring around the Ansnorveldt wells Figure 8: Starting Points for the WWAT Analysis for the Nobleton Wells Figure 9: Starting Points for the WWAT Analysis for the Schomberg Wells Figure 10: Starting Points for the WWAT Analysis for the Mount Albert Wells Figure 11: High, Medium and Low Vulnerability Areas based on WWAT values for the Nobleton Wells.. 29 Figure 12: High, Medium and Low Vulnerability Areas based on WWAT values for the Schomberg Wells Figure 13: High, Medium and Low Vulnerability Areas based on WWAT values for the Mount Albert Wells Figure 14: Intrinsic Vulnerability Scoring for the Nobleton Wells Figure 15: Intrinsic Vulnerability Scoring for the Schomberg Wells Figure 16: Intrinsic Vulnerability Scoring for the Mount Albert Wells LIST OF TABLES Table 1: Pumping rates for the Nobleton, Schomberg and Mount Albert wellfields Table 2: Wellhead Protection Vulnerability Scores Table 3: Wellhead Protection Area Zone Definitions Table 4: High, Medium, and Low vulnerability categories as related to WWAT values (from MOE, 2006) Table 5: Aquifer location of the new wells in Nobleton, Schomberg and Mount Albert Table 6: Summary of the uncertainty assessment for each wellfield Earthfx Inc. 5
6 Update to Vulnerability Assessment and Scoring of Wellhead Protection Areas, Regional Municipality of York 1 Introduction In November 2007, Earthfx Incorporated (Earthfx) and Azimuth Environmental Consulting Incorporated (AEC) completed an analysis of intrinsic vulnerability to contamination at all 38 active municipal wells in the Regional Municipality of York (Earthfx, 2007). The study was completed as part of York Region s source water protection initiative supported through the Ministry of Environment s (MOE) Source Protection Grant Program. The project was carried out in accordance with the objectives outlined in the MOE Draft Guidance Module 3 for Groundwater Vulnerability Analysis (MOE, 2006). Results of this study were intended to provide the foundation for future Water Quality Risk Assessment and analysis of threats to municipal drinking water sources and supplies. Since that time, the Technical Rules for preparing Source Water Assessment reports have been finalized (November 2008) and amended (December 2008) and the MOE Draft Guidance Module has been superseded. Technical changes have been made to the methodology for scoring vulnerability within Wellhead Protection Area (WHPA) Zone D (WHPA-D). Changes have also been made to the terminology and to the mapping standards. These changes require that the results presented in the 2007 Earthfx report be updated and submitted in an Addendum report. In addition, new production wells have been constructed in Nobleton, Schomberg, and Mount Albert. Environmental Assessment (EA) reports have been completed for each of these wellfields (MMM Group, 2007; Genivar, 2007; MMM Group 2006). The pumping rates and resulting WHPAs from these EA reports are included here, and are used for the WWAT analyses (with the exception of Mount Albert, which required a new simulation for this current report). For Nobleton, Simulation 2 from EA report uses the proposed permitted rates from 2007 in order to determine the WHPA limits (MMM Group, Appendix. E Groundwater Resource Exploration). This simulation is used in this current report in the assessment of vulnerability for the Nobleton wells. At Schomberg, the EA report (Genivar, 2007) used the maximum permitted rates at each well. These pumping rates and the resulting WHPA are used for the vulnerability assessment in this current report. In the Mount Albert EA report (MMM Group, 2006, App. E. Groundwater Resource Exploration) all three wells are pumped at their permitted rates. However, for this current report, a new simulation was performed, with only wells 1 and 3 pumping at their individual permitted rates (permitted rates were only used at wells 1 and 3 because well 2 is located on the same site as well 1). Although we recognize that the combined pumping rate is still above the PTTW, this represents a conservative approach and at any given time, any one well could be pumping at its maximum permitted rate. Pumping rates used are provided in the table below: Earthfx Inc. 6
7 Table 1: Pumping rates for the Nobleton, Schomberg and Mount Albert wellfields. Municipal Well Permitted Maximum Pumping Rate (m 3 /d) Simulated Pumping Rate (m 3 /d) Nobleton Well Nobleton Well Nobleton Well Schomberg Well Schomberg Well Schomberg Well Mount Albert Well Mount Albert Well Mount Albert Well Two separate cycles are outlined for Nobleton: Cycle 1 indicates that Nobleton wells 3 and 4 may be operated up to a maximum of 2,496 m 3 /day and 1,964 m 3 /day, respectively - Cycle 2 indicates that Nobleton wells 4 and 2 may be operated up to a maximum of 2,496 m 3 /day and 1964 m 3 /day, respectively. In addition, condition 3.4 indicates that Nobleton well 2 and 3 shall NOT be operated simultaneously. 2 For the Mount Albert wells, the maximum permitted rate is shown for each well; however, the maximum combined daily taking from any combination of Mount Albert wells 1, 2, or 3 shall NOT exceed 4990 m3/day. The current study and the one completed in November 2007 (Earthfx, 2007) make use of a conceptual geologic and numerical groundwater flow model that was developed as part of the Oak Ridges Moraine Hydrogeology Program conducted by York, Peel and Durham Regions, the City of Toronto, and the Conservation Authorities of the Moraine Coalition (YPDT-CAMC). The YPDT-CAMC groundwater model is described by Kassenaar and Wexler (2006). 1.1 Scope of Work This study serves as an addendum to the existing study (Earthfx, 2007), and has been divided into two parts, described below Part 1 Updating the Existing Vulnerability Scoring The purpose of Part 1 of this addendum report is to revise the vulnerability scoring and mapping for all of York Region s municipal wells (excluding Nobleton, Schomberg and Mount Albert, which are addressed in Part 2 of this report). After a review of the Technical Rules for the Clean Water Act, which were re-issued in November 2008, and amended in December 2008, the vulnerability scoring and mapping was updated with the new scoring values. This update of the intrinsic vulnerability scoring (IVS) maps does not involve any new groundwater flow or particle tracking simulations. The new maps are generated by assigning new IVS values to the existing water table-to-well-advectiontime (WWAT) zones, which were presented in the 2007 Earthfx report. In the new Technical Rules, only the IVS values within WHPA-D (5-25 year time-of-travel, or TOT) have changed (IVS values with WHPA-A, WHPA-B and WHPA-C remain unchanged from the November 2007 report). The new rules (MOE, 2008) have IVS values of 6, 4 and 2 for high, Earthfx Inc. 7
8 medium and low areas of relative vulnerability within WHPA-D, respectively. In the previous study (Earthfx, 2007), the IVS values for the high, medium and low areas of relative vulnerability within WHPA-D were: 8, 6 and 2. The new vulnerability scoring is shown below: Table 2: Wellhead Protection Vulnerability Scores. GW Vulnerability Category for Area WHPA-A WHPA-B WHPA-C WHPA-D High Medium Low Note that in the previous work (Earthfx, 2007), IVS maps were included for Pathogens and dense non-aqueous phase liquids (DNAPLs), as well as General Contaminants and each of these sets of maps had its own scoring rules. However, it is our understanding that the updated Technical Rules (MOE, 2008) only require a single set of maps Part 2 Updating the Vulnerability Assessment and Scoring of Nobleton, Schomberg and Mount Albert Wellfields The purpose of Part 2 of this project is to assess the vulnerability of the WHPAs at the new municipal well sites in Nobleton, Schomberg and Mount Albert. The scope of work includes several subtasks, outlined below Task 1: Assessment and Mapping of Aquifer Vulnerability in the WHPA Earthfx will conduct a vulnerability assessment for the WHPAs at the three new well sites using the WWAT approach that scores vulnerability in terms of travel time through the saturated zone to the well. As in the November 2007 analyses (Earthfx, 2007), the unsaturated-zone-advective time (UZAT) is assumed to be small and will be ignored in this vulnerability scoring. The UZAT estimations would have a high-degree of uncertainty associated with them, due to the numerous variables associated with unsaturated flow and the limited data available for these variables. In addition, where potential sources of contamination lie below the ground surface, either within the unsaturated zone or at the water table (e.g., underground storage tanks), the WWAT approach may provide a more realistic representation of the vulnerability of the water supply. Where potential sources of groundwater contamination are located at ground surface, the WWAT approach would provide a conservative estimate of the travel time of potential contaminants to the well, which would be favourable from the perspective of protecting the municipal well supplies. As the existing WHPAs for the three new production wells are consistent with the framework outlined in the Technical Rules, no refinement of these WHPAs is expected for this task, with the exception of Mount Albert, where pumping rates have changed for the current report (see above). The WWAT analysis will be conducted within the entire WHPAs, including areas that extend beyond the boundaries of York Region. Definitions of the four WHPA zones are provided in the table below: Earthfx Inc. 8
9 Table 3: Wellhead Protection Area Zone Definitions. WHPA Definition Type WHPA-A metre radius around the well WHPA-B Area outside WHPA-A in which time of travel to the well is less than 2 years WHPA-C Area in which the time of travel to the well is between 2 and 5 years WHPA-D Area in which the time of travel to the well is between 5 and 25 years Earthfx will apply the YPDT-CAMC Core Model of the Oak Ridges Moraine (Kassenaar and Wexler, 2006) for determining potentials needed for the vulnerability assessment and scoring. The same version of the Core Model that was used to delineate the previous WHPAs will be used for this vulnerability study. Forward particle tracking techniques, identical to those in the November 2007 study, will be applied to assess advective travel times in a manner consistent with the previous study. The maps of travel times within the WHPA will provide a relative indication of the susceptibility of the aquifer to contamination from potential surface sources Task 2: Assignment and Mapping of Vulnerability Scores For all three wellfields, Earthfx will assign vulnerability scores to zones within each WHPA zone based on the advective travel times. The vulnerability scoring process involves two main steps: categorizing the relative vulnerability of the aquifer as either High (0-to-5 year advective travel time), Medium (5-to-25 years), or Low (> 25 years), and then assigning vulnerability scores ranging from 2 (lowest vulnerability) to 10 (highest vulnerability) within the different time of travel WHPA zones as shown in Table 2. The vulnerability scoring shall be conducted within the entire WHPA, including those areas that extend beyond the boundaries of York Region Task 3: Analysis and Rating of Uncertainty Earthfx analyzed and rated the uncertainty in the vulnerability assessment mapping and vulnerability scoring at the new well sites. This analysis included a characterization of high or low for the level of uncertainty, as required by the Technical Rules (MOE, 2008). The following factors shall be considered in the analyses: the distribution, variability, quality and relevance of data used in conducting the analyses; the ability of the methods and models to accurately reflect the flow processes in the groundwater system; the quality assurance/quality control procedures applied; the extent and level of calibration and validation achieved for models used; and the accuracy to which the groundwater vulnerability categories effectively assess the relative vulnerability of the underlying hydrogeological features Many of these factors were addressed in the November 2007 report. The findings will be updated in light of any new information or results obtained as part of this study 1.2 Background This updated source water assessment is based on a comprehensive understanding of the physical characteristics of the local groundwater system and its functioning within the larger context of the regional groundwater flow system. The reader is referred to the November 2007 report (Earthfx, 2007) for relevant background material. Earthfx Inc. 9
10 The Oak Ridges Moraine study (Kassenaar and Wexler, 2006) has provided a high level of understanding needed to delineate the wellhead protection areas utilizing three-dimensional modelling techniques. A general description of the geologic and hydrogeologic setting of York Region is provided in the November 2007 report (Earthfx, 2007); the reader is referred to Kassenaar and Wexler (2006) for more detailed discussions. 1.3 Methodology The Time-of-Travel (TOT) method is the approach specified by MOE Guidance Module 3 (MOE, 2006) for delineating wellhead protection areas around municipal supply wells. As described in the November 2007 report (Earthfx, 2007), three-dimensional advective flow modelling was applied, which is the preferred method because numerical models can represent spatial variability of aquifer and aquitard properties and recharge rates. Furthermore, because the model covers all of York Region, mutual interference between supply wells and the effect of surface water features on the groundwater flow patterns can also be represented. Additional details and limitations of this method are described in Earthfx (2007) Model Selection The U.S. Geological Survey (USGS) MODFLOW code was selected for use in this study because this code is recognized worldwide and has been extensively tested and verified. To simulate groundwater flow paths and travel times which, in turn, were used to define TOT zones for the York Region municipal wells, the U.S. Geological Survey MODPATH code was used. Additional details and limitations of these codes are described in Earthfx (2007), and Kassenaar and Wexler (2006) Modelling Approach MODFLOW/MODPATH results were used to delineate the primary wellhead protection TOT zones for each municipal well (2-, 5- and 25-year TOT zones, which correspond to the WHPA sensitivity zones B, C, and D, respectively). WHPA-A was created by drawing a circle with a 100-metre radius around each well. Simulated pumping rates for all municipal wells (excluding Nobleton, Schomberg and Mount Albert) are shown in Table 3 from the November 2007 report (Earthfx, 2007). For the remaining three well fields, pumping rates are shown in Table 1. Additional details on both the MODFLOW and MODPATH approaches are described in the 2007 Earthfx report and the 2006 Kassenaar and Wexler report Vulnerability Assessments Methods MOE Guidance Module 3 (MOE, 2006) presents a detailed description of the methodologies available for assessing the relative vulnerability of the aquifers that supply water to the municipal wells. Earthfx provide relevant background material in the 2007 report, which describes and compares the different methods of assessing the intrinsic vulnerability of aquifers. For the 2007 project, Earthfx and York Region staff determined that the WWAT method would be the most appropriate method of calculating travel times. WWAT values were determined by placing virtual water particles at the water table in all model grid cells within the 0 to 25-year TOT zones. If the water-table was below the base of a Model Layer 1, the particles were released from the top of the uppermost active model layer. The MODPATH code was used to track each virtual particle forward from its starting point to a discharge point which could be a either a well or a stream. The travel time for each track that ends up in a well was determined and then assigned to the originating cell. Appendix 4 of Guidance Module 3 (MOE, 2006) Earthfx Inc. 10
11 recommends translating the travel times obtained from the WWAT analyses into relative measures of intrinsic vulnerability as summarized in Table 4. A more detailed description of this methodology is provided in the 2007 Earthfx report. Table 4: High, Medium, and Low vulnerability categories as related to WWAT values (from MOE, 2006). WWAT Value IV Category > 25 years Low (L) 5 to 25 Years Medium (M) 0 to 5 years High (H) Intrinsic Vulnerability Scores The WHPA sensitivity zones (WHPA-A, WHPA-B, WHPA-C and WHPA-D) determined through the TOT analyses were intersected with the relative aquifer vulnerability zones (H, M, L). Final intrinsic vulnerability scores (IVS) ranging from 2 (low vulnerability) to 10 (high vulnerability) were then assigned to sub-zones within the WHPA zones. Table 2 shows the new IVS values to be applied for WHPA-A, WHPA-B, WHPA-C and WHPA- D, using WWAT methods. In the previous study, separate maps were created for DNAPL and pathogen zones, as described in Earthfx (2007). The updated Technical Rules, however, do not include intrinsic vulnerability scoring for these different zones, and therefore, only a single set of maps (equivalent to general contaminants ) is provided here. The methodology for assignment of IVS values is described in further detail in the 2007 Earthfx report Uncertainty Assessment There is a level of uncertainty associated with the results of applying the WWAT and IVS methods. The uncertainty is a product of the underlying uncertainties associated with each of the three processes used to develop the final IVS values: (1) the numerical groundwater flow model, (2) the time-of-travel analyses, and (3) the WWAT and IVS methodologies. Earthfx described these different areas of uncertainty in more detail in the previous study (Earthfx, 2007). Earthfx Inc. 11
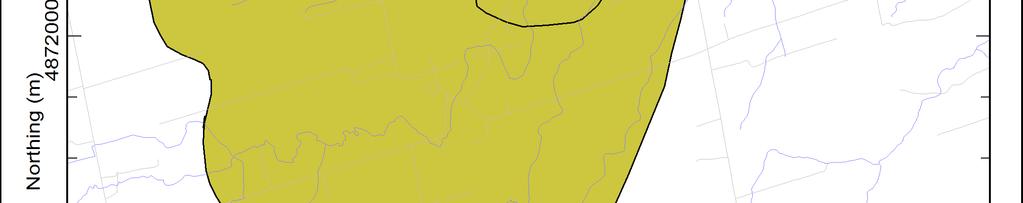
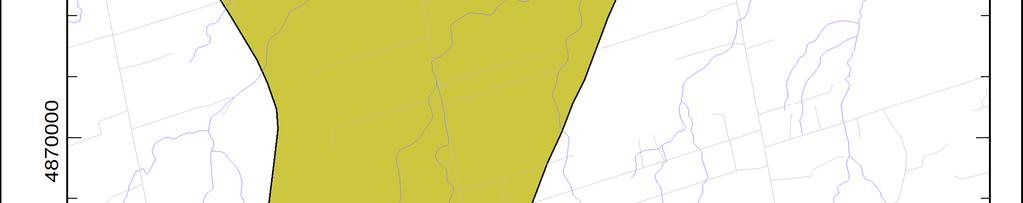
12 2 Study Results 2.1 Part Update of Intrinsic Vulnerability Scores New IVS maps for all municipal wellfields in York Region (excluding Nobleton, Mount Albert and Schomberg, which will be discussed in Part 2) have been generated using the new Technical Rules for the Clean Water Act, issued in November 2008, and amended in December These new maps are identical to the General Contaminant maps presented in the November 2007 report (Earthfx, 2007), for WHPA-A, WHPA-B and WHPA-C; however, within WHPA-D the new maps differ from those shown in the November 2007 report (Earthfx, 2007), as the new Technical Rules have a new scoring scheme within this WHPA zone (see Table 2). Figure 1 shows the IVS at the Aurora and Newmarket wells; Figure 2 shows the IVS at the Holland Landing and Queensville wells. IVS mapping was generated for the other wells and is presented in separate figures for the Ballantrae wells (Figure 3), Stouffville (Figure 4), King City wells (Figure 5), Kleinburg wells (Figure 6), and Ansnorveldt wells (Figure 7). Some observations can be made with regards to the results shown in these figures. The IVS zones generally match the corresponding TOT zones for wells which are screened in the Oak Ridges Aquifer Complex (ORAC), which is the uppermost aquifer in this area. These wells include Newmarket Well 14, and Stouffville Wells 3, 5 and 6. Newmarket wells 1, 2, 13, and 16 have relatively large zones of medium to high intrinsic vulnerability around the wells. The reason for the short travel times (0 to 5 years) is that the particles were started in Layer 5 (TAC), because the simulated heads were below the base of the Newmarket Till. As a result, the travel times do not account for the extremely long time of travel through the unsaturated Halton and Newmarket Tills. Newmarket well 15, the Aurora wells, the Holland Landing wells, and the Queensville wells generally have small areas of medium intrinsic vulnerability surrounded by areas of low vulnerability. A small area of high intrinsic vulnerability lies to the south of Queensville wells 3 and 4. This is associated with a small zone of thin Newmarket Till interpreted to be present in this area. The simulated water table lies below the base of this thin Newmarket Till, and as a result, particles in this area were started in Layer 5. The analysis shows that, even though the 25-year TOT zones from the different wellfields coalesce, much of the 25-year TOT for the Holland Landing/Queensville wellfields and the eastern part of the Aurora/Newmarket 25-year TOT have low intrinsic vulnerability. For Ballantrae, medium vulnerability is present throughout most of the WHPA zones, with low values around the edges of the 25-year WHPA. At King City, medium intrinsic vulnerability scores appear in an area to the east of the wells, while the remaining areas are assigned low intrinsic vulnerability scores. For Kleinburg, medium intrinsic vulnerability scores are assigned to areas near the wells, with low intrinsic vulnerability in the remaining areas. For Ansnorveldt, low intrinsic vulnerability scores are assigned throughout all WHPA zones. 2.2 Part Assessment and Mapping of Aquifer Vulnerability in the WHPA for Nobleton, Schomberg and Mount Albert Wells The procedure for generating the vulnerability maps based on WWATs is outlined in the November 2007 report (Earthfx, 2007). Virtual water particles were placed along the top face (water table) of all model grid cells within the 25-year WHPA. To ensure that no possible Earthfx Inc. 12
13 pathways were missed, particles were also placed in a small buffer area surrounding the 25- year WHPA. If the water table was below the base of Model Layer 1, particles were released from the top of the uppermost active model layer. Figure 8, Figure 9, and Figure 10 show the starting layers for particles for the Nobleton, Schomberg and Mount Albert wellfields. While some of these particles end up discharging to streams and other wells, the starting cells for particles that reach the municipal wellfields are assigned a value based on the length of time required for the particle to reach the municipal well. These values are then mapped to create High, Medium, and Low (H. M, L) zones of vulnerability. For Nobleton, Schomberg and Mount Albert, these vulnerability maps are shown in Figure 11, Figure 12, and Figure 13 respectively. For Nobleton and Schomberg, these WWAT maps are similar to those in the November 2007 report, except that the small Medium zone north of the Nobleton Wells is no longer present, and at Schomberg, there are small Low zones near the pumping wells. For Mount Albert, the WWAT map shows Medium zones around the wells, and another Medium zone to the south, with the remaining area shown as Low Assignment and Mapping of Intrinsic Vulnerability Scores for Nobleton, Schomberg and Mount Albert Wells New IVS maps Nobleton, Schomberg and Mount Albert have been generated using the new Technical Rules for the Clean Water Act, issued in November 2008, and amended in December 2008, and are shown in Figure 14, Figure 15, and Figure 16, respectively. For Nobleton and Schomberg, the IVS values are the minimum or Low IVS values within each TOT zone. For Mount Albert, almost the entire area within each TOT zone is the minimum or Low IVS, except for areas around the pumping wells, and the area in the south end of the 25-year TOT. The new wells at these three sites are located Table 5: Aquifer location of the new wells in Nobleton, Schomberg and Mount Albert. Well Nobleton #4 Schomberg #4 Mount Albert #3 Aquifer Scarborough Thorncliffe Thorncliffe Analysis and Rating of Uncertainty The November 2007 report discusses uncertainty in detail, as it relates to the WWAT and IVS analyses. As mentioned in that report, it is impossible to provide a quantitative assessment of the level of uncertainty. Rather, one can only say that the level is low or high. Appendix 6 of the MOE Guidance Module (MOE, 2008) indicates that it would be reasonable to expect a low level of uncertainty in areas where data density is high, where hydrogeologic studies have been conducted, and where numerical models have been developed. This study generally satisfies all three of these MOE criteria. It is recognized, however, that all hydrogeologic analyses have an intrinsic level of uncertainty because of data limitations and the requirement for professional interpretation. Uncertainty in the WWAT and IVS analyses can be ascribed to the three processes involved in developing final IVS values: (1) the numerical groundwater flow model, (2) the TOT delineation, and (3) the WWAT assessment. Discussion of the uncertainty in these three processes is presented in more detail in the November 2007 report. Earthfx Inc. 13
14 Vulnerability Mapping Uncertainty The WWAT method is the most scientifically sound technique to evaluate aquifer vulnerability. It is based on assessing true travel times using locally determined hydraulic properties that have been adjusted and refined through model calibration. The models that the WWAT analyses were based on were developed using recognized hydrogeologic and hydraulic principles and have been calibrated to match the observed heads and, more importantly, the model was calibrated to best match the observed directions of flow by carefully representing factors that influence flow patterns such as local variations in aquifer properties, recharge rates, aquifer and aquitard thickness and continuity as well as the effects of pumping from nearby wells and the influence of streams. However, it is difficult to quantitatively assess the certainty of the TOT zones in an unbiased way and it is even more difficult to assess uncertainty in the WWAT values within the TOT zones. Because the WWAT method does not include travel time from the ground surface to the water table (UZAT), vulnerability likely has higher degree of uncertainty in areas where water table is deeper, because particles start deeper in WWAT assessment and therefore confining, overlying units are missed. Using this WWAT approach, however, is a conservative approach with respect to wellhead protection Uncertainty Related to Data Distribution within the TOT Zones As discussed in detail in the November 2007 report, the degree of confidence related to the TOT and IVS assessment also depends on data density. Once the TOT zones were delineated, it was possible to look at the distribution of geologic and hydrologic data as well as monitoring data within or near the TOT zones. The location of monitoring and private wells in the vicinity of the Nobleton and Schomberg wellfields is shown in Figure 105 of the November 2007 report, while the location of monitoring and private wells in the vicinity of the Mt. Albert wellfield is shown in Figure 107 of the November 2007 report. Some general observations are that, while there are over 20,000 private wells within York region, most are shallow and do not provide information on aquifer properties or the degree of confinement in the vicinity of the supply wells. There are also fewer wells in the database that are located in urban areas. Uncertainties related to geologic setting and data density were assessed for Nobleton, Schomberg and Mount Albert and are summarized to produce a general uncertainty estimate for each wellfield (Table 6). The individual results are discussed below: Nobleton: The Nobleton wells are deep and interpreted to be in the Scarborough aquifer complex (SAC) but the Sunnybrook aquitard is thin or missing in the area. There are few monitoring wells in the vicinity and limited distribution of MOE Water Well Information System (WWIS) wells to the north (in particular, within WHPA-C), leading to a higher overall uncertainty rating. Schomberg: The Schomberg wells are interpreted to be near the edge of a tunnel channel. There is little information on the Sunnybrook aquitard in that area so the degree of protection afforded by that unit is uncertain. There is a large number of WWIS wells to the southeast of Schomberg but relatively few elsewhere. There are deep monitoring wells in the vicinity of the pumping wells but limited monitoring elsewhere considering the size of the TOT zones. Earthfx Inc. 14
15 Mt. Albert: The Mt. Albert wells are also interpreted to be near the edge of a tunnel channel. There are a few monitoring wells within the TOT zones and several high quality wells to the north of the 25-year TOT. Table 6: Summary of the uncertainty assessment for each wellfield. Wellfield Uncertainty Type Zone B Zone C Zone D (2-Year TOT) (5-Year TOT) (25-Year TOT) Numerical Model Uncertainty Low High Low Nobleton Time of Travel Analysis Uncertainty Low High Low Vulnerability Mapping Low High Low Resultant Uncertainty Low High Low Numerical Model Uncertainty Low High High Schomberg Time of Travel Analysis Uncertainty Low High High Vulnerability Mapping Low Low Low Resultant Uncertainty Low High High Numerical Model Uncertainty Low Low Low Mt. Albert Time of Travel Analysis Uncertainty Low Low Low Vulnerability Mapping Low Low Low Resultant Uncertainty Low Low Low Earthfx Inc. 15
16 Limitations Services performed by Earthfx Incorporated for York Region were conducted in a manner consistent with that level of care and skill ordinarily exercised by members of the environmental engineering and consulting profession. This report presents the results of data compilation and computer simulations of a complex geologic setting. Data errors and data gaps are likely present in the information supplied to Earthfx, and it was beyond the scope of this project to review each data measurement and infill all gaps. Models constructed from this data are limited by the quality and completeness of the information available at the time the work was performed. Computer models represent a simplification of the actual geologic and hydrogeologic conditions. The applicability of the simplifying assumptions may or may not be applicable to a variety of applications. This report does not exhaustively cover an investigation of all possible environmental conditions or circumstances that may exist in the study area. If a service is not expressly indicated, it should not be assumed that it was provided. It should be recognized that the passage of time affects the information provided in this report. Environmental conditions and the amount of data available can change. Discussions relating to the conditions are based upon information that existed at the time the conclusions were formulated. All of which is respectively submitted, EARTHFX INC. Dirk Kassenaar, M.Sc. P.Eng. Earthfx Inc. E.J. Wexler, M.Sc., M.Sc. (Eng) Earthfx Inc. Steve Shikaze, M.Sc., P.Eng. Earthfx, Inc Earthfx Inc. 16
17 3 References Cited Earthfx, Inc., Vulnerability Assessment and Scoring of Wellhead Protection Areas. Regional Municipality of York. Prepared for: The Regional Municipality of York. Project P p. Genivar, Desktop Study for Groundwater Resource Exploration in the Schomberg area. Prepared for: Regional Municipality of York., November Kassenaar, J.D.C. and Wexler, E.J., 2006, Groundwater Modelling of the Oak Ridges Moraine Area: CAMC-YPDT Technical Report # Available at MMM Group, Class EA and Water Resource Exploration for Water Supply and Storage in the Community of Nobleton, Project # Prepared for: Regional Municipality of York. September MMM Group, Class EA and Water Resources Exploration for Water Supply in the Community of Mount Albert. Project , Prepared for: Regional Municipality of York. December Ontario Ministry of the Environment, 2006, Assessment Report: Draft Guidance Module 3 Groundwater Vulnerability Analysis, October, Ontario Ministry of the Environment, 2008, Technical Rules Assessment Report, Clean Water Act, 2006, December Earthfx Inc. 17
18 Figures Earthfx Inc. 18


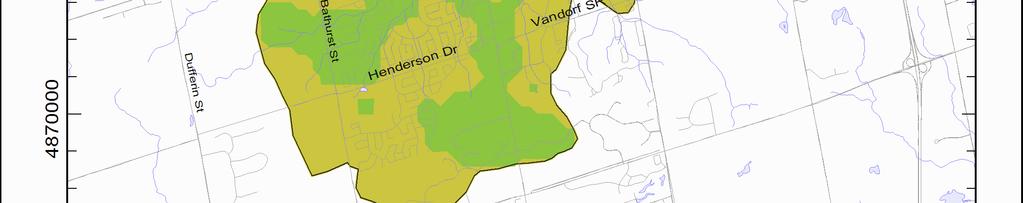
19 Figure 1: Updated Intrinsic Vulnerability Scoring around the Aurora and Newmarket wells. Earthfx Inc. 19


20 Figure 2: Updated Intrinsic Vulnerability Scoring around the Holland Landing and Queensville wells. Earthfx Inc. 20

21 Figure 3: Updated Intrinsic Vulnerability Scoring around the Ballantrae wells. Earthfx Inc. 21


22 Figure 4: Updated Intrinsic Vulnerability Scoring around the Stouffville wells. Earthfx Inc. 22


23 Figure 5: Updated Intrinsic Vulnerability Scoring around the King City wells. Earthfx Inc. 23


24 Figure 6: Updated Intrinsic Vulnerability Scoring around the Kleinburg wells. Earthfx Inc. 24

25 Figure 7: Updated Intrinsic Vulnerability Scoring around the Ansnorveldt wells. Earthfx Inc. 25


26 Figure 8: Starting Points for the WWAT Analysis for the Nobleton Wells. Earthfx Inc. 26


27 Figure 9: Starting Points for the WWAT Analysis for the Schomberg Wells. Earthfx Inc. 27


28 Figure 10: Starting Points for the WWAT Analysis for the Mount Albert Wells. Earthfx Inc. 28


29 Figure 11: High, Medium and Low Vulnerability Areas based on WWAT values for the Nobleton Wells. Earthfx Inc. 29
30 Figure 12: High, Medium and Low Vulnerability Areas based on WWAT values for the Schomberg Wells. Earthfx Inc. 30


31 Figure 13: High, Medium and Low Vulnerability Areas based on WWAT values for the Mount Albert Wells. Earthfx Inc. 31


32 Figure 14: Intrinsic Vulnerability Scoring for the Nobleton Wells. Earthfx Inc. 32


33 Figure 15: Intrinsic Vulnerability Scoring for the Schomberg Wells. Earthfx Inc. 33

34 Figure 16: Intrinsic Vulnerability Scoring for the Mount Albert Wells. Earthfx Inc. 34