Indicator for Manufacturing Execution System
|
|
|
- David Roberts
- 5 years ago
- Views:
Transcription
1 ISO Standardization of Key Performance Indicator for Manufacturing Execution System Yoshiro Fukuda, Hosei University Prof. Yoshiro Fukuda, Department of System & Design, Hosei University
2 目的 MES の標準化を意図したが 既に多くの MES が商用で売られていたり 使用されているので 標準化には適しない MESの情報を厳格に標準化するよりは 利用者視点で情報を標準化する方が利点がある 生産システムの生産性指標を標準化することで ベンチマーキングが可能になる 生産性指標を定義することで センサー 制御機器など 制御機器などから必要なデータを容易に収集 編集が可能になる 経営的な情報と生産システムの現場との情報を統合的に可視化することができる Prof. Yoshiro Fukuda, Department of System & Design, Hosei University 2
3 MES の生産性指標の標準化 NWI 提案 DIN 2008 年 5 月 TC184/SC5にWG9 を設立 (2009 年 5 月 ) NWI の投票 (2009 年 9 月 ) NWI の成立 (2009 年 12 月 ) ドイツ フランス スエーデン スペイン アメリカ 韓国 中国 日本 -2 2 発行 (2013 年 ) -1 発行準備中 (2014 年 ) Prof. Yoshiro Fukuda, Department of System & Design, Hosei University 3
4 Part 構成 ISO was prepared by Technical Committee ISO/TC 184, Automation systems and integration, Subcommittee SC 5, Interoperability, integration and architectures of automation systems and applications. ISO consists of the following parts, under the general title Manufacturing operations management : Part 1: Overview, concepts and terminology Part 2: Definitions and descriptions of key performance indicators Part 3: Templates and categories of KPIs Part 4: Exchange and use of KPIs Prof. Yoshiro Fukuda, Department of System & Design, Hosei University 4

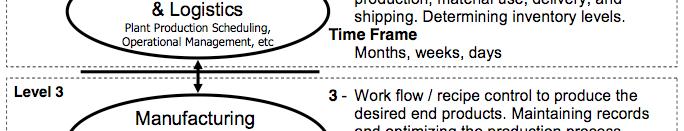
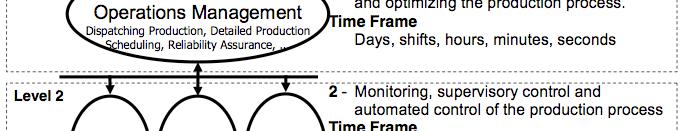
5 対象 IEC ISO62264(JWG5) の Level3 が対象領域 Prof. Yoshiro Fukuda, Department of System & Design, Hosei University 5
6 対象 IEC ISO62264(JWG5) の Level3 が対象領域 Level 4 Level 3 Performance data (KPI) Detailed schedule data Job order data Product data Materials data Quality data Work-Time data Process data Equipment data Level 2 and below Manufacturing automation & control domain data Prof. Yoshiro Fukuda, Department of System & Design, Hosei University 6
7 KPI 35 KPI definition on this standard(part2 9.1~9.35) Efficiency indicators 9 Quality indicators 9 Capacity index 4 Environmental indicators 4 Inventory management indicators 6 Maintenance indicators 3 Prof. Yoshiro Fukuda, Department of System & Design, Hosei University 7
8 KPI 35 KPI definition on this standard(part2 9.1~9.35) Efficiency indicators 9 Quality indicators 9 Capacity index 4 Environmental indicators 4 Inventory management indicators 6 Maintenance indicators 3 Prof. Yoshiro Fukuda, Department of System & Design, Hosei University 8
9 方法 1 KPI の定義 Time Model の定義 Calendar day planned times OT Operation time Planned PBT allocation time times without production planned stops Busy time BT DoT, TT, WT actual stops Processing time PCT DeT fault caused interruptions Main usage time Time model for Production units Time model for manufacturing order Time model for employment PDT actual (measured) times ESUT actual set-up time Prof. Yoshiro Fukuda, Department of System & Design, Hosei University 9
10 方法 2 KPI の記述のフレームワーク Name / Title of indicator: IDa Description Benefit / Application: Time behaviour Definition and calculation Formula: Unit / Dimension: Rating: Analysis / Drill down: Remarks Notes / Explanation: Corporate level Effect model Production type: a ID is not used in this part of ISO 22400, whose scope does not include KPI implementation and exchange of KPIs. Prof. Yoshiro Fukuda, Department of System & Design, Hosei University 10
11 方法 3 Example KPI information relation model Overall Equipment Effectiveness (OEE) Index Produc t Plant Production order Production unit Machine group Workplace group Operation sequence Machine / Workplace Production time Produced quantity Good quantity Production time per unit Operation calendar Calendar day Machine/workplac e Operation time Planned busy time Prof. Yoshiro Fukuda, Department of System & Design, Hosei University 11
12 Table 2 Effect model diagram key Arrow Definition results, through use of a formula, in a KPI includes (a 1:1 relationship) has (i.e. is booked or entered) consists of (a 1:n relationship) Prof. Yoshiro Fukuda, Department of System & Design, Hosei University 12
13 記述例 Name / Title of indicator: Description Benefit / Application: Time behaviour Definition and Calculation Formula: Unit/Dimension: % Rating: Min: 0% Analysis / Drill Down: Remarks Notes / Explanation: Overall Equipment Effectiveness Index Overall Equipment Effectiveness (OEE) is a measure for the efficiency of machines and/or plants, manufacturing cells with several machines or an entire assembly line. The OEE Index forms the basis for improvements by better production information, identification of production losses, and improvement of the product quality by optimized processes. The OEE Index represents the used availability, the effectiveness of the production unit, and their quality rate summarized in a characteristic number. demand-oriented, periodic OEE Index = Availability * Effectiveness * Quality rate Corporate level Effect model: see A.8 Production type: continuous, batch, discrete Max: 100% Trend: the higher, the better. Related to production unit, product, period (day), and error types. With the bench mark of manufacturing processes by means of the OEE Index the criteria for a comparability are to be examined before. Master, Chief, Management Prof. Yoshiro Fukuda, Department of System & Design, Hosei University 13
14 9.14 Scrap degree Name / Title of indicator: Description Benefit / Application: Scrap Degree Time behaviour Definition and Calculation Formula: Unit/Dimension: % Rating: Min: 0% Analysis / Drill Down: Remarks Notes / Explanation: The Scrap Degree takes into account process-conditioned scrap. It should stay below one hundred percent. demand-oriented, periodic, online Scrap Degree = SQ / PSQ Max: 100% Trend: the lower, the better. Related to production unit, product, and errors. Corporate level: Effect model: see A.16 Production type: continuous, batch, discrete The Scrap Degree supports the monitoring of the target demand. The planned scrap quantity (that which can be expected) is normally already defined in the ERP system in order to ensure also the necessary material allocation. This characteristic number is suitable as on-line characteristic number for the worker level. Worker, Master, Chief, Management Prof. Yoshiro Fukuda, Department of System & Design, Hosei University 14
15 9.16 Scrap ratio Name / Title of indicator: Description i Benefit / Application: Scrap Ratio Time behaviour Definition and Calculation Formula: Unit/Dimension: % Rating: Min: 0% Analysis / Drill Down: Remarks Notes / Explanation: The Scrap Ratio represents the percentage portion of the entire production that is scrap. demand-oriented, periodic, online Scrap Ratio = SQ / PQ Corporate level: Effect model: see A.18 Production type: continuous, batch, discrete Max: 100% Trend: the lower, the better. Related to production unit, product, production order, and error types. The Scrap Ratio gives a quality evaluation of the production and a balance evaluation. The smaller the value, the better is the productivity. This characteristic number is suitable as on-line characteristic number for the worker level. Worker, Master, Chief, Management Prof. Yoshiro Fukuda, Department of System & Design, Hosei University 15
16 9.23 Ratio of used material Name / Title of indicator: Description Benefit / Application: Time behaviour Definition and Calculation Formula: Unit/Dimension: Rating: Analysis / Drill Down: Remarks Notes / Explanation: Corporate level: Effect model: Production type: Ratio of Used Material Manufacturing that reduces the amount of used materials in the process will lessen its impact on the environment. A study indicates that if material reduction is fully utilized this will result in lowered carbon dioxide emission from transportation and energy production. demand-oriented Ratio of Used Material = total amount of material used / VA ton / unit currency Related to product, production unit, and plant. According to the definition by the World Business Council for Sustainable Development, materials used are all materials bought, excluding packaging, water and fuel. Scrap Degree and Scrap Ratio already exist in this part of ISO and it is therefore necessary to focus on total amount of materials used. Worker, Master, Chief to be determined continuous, batch, discrete Prof. Yoshiro Fukuda, Department of System & Design, Hosei University 16
17 Harmful substances Name / Title of indicator: Description Benefit / Application: Time behaviour Definition and Calculation Formula: Unit/Dimension: Rating: Analysis / Drill Down: Remarks Notes / Explanation: Corporate level: Effect model: Production type: Harmful Substances Successful reduction of harmful substances in production will lead to lowered danger of hazardous accidents and therefore lowered risk of cost associated with sanitation for the producer and the society. The global restoration of environmental devastation has been estimated to $125 billion. Production of harmful substances in the European Union has unfortunately increased from 259 million tons in1996 to 317 million tons in demand-oriented Harmful Substances = total used amount of harmful substances in tons / VA ton / unit currency Related to product, production unit, and plant. Total weight of substances used are defined in the KEMI classification list and REACH (European Union Directive for the registration, ti evaluation, authorization ti and limitation it ti of chemicals). Worker, Master, Chief to be determined continuous, batch, discrete Prof. Yoshiro Fukuda, Department of System & Design, Hosei University 17
18 9.25 Hazardous waste ratio Name / Title of indicator: Hazardous Waste Ratio Description Benefit / Application: The total amount of hazardous waste in the EU was 84.4 million tons in 2006, an increase by 14 % from In the hazardous waste has increased with 54.7 % from 2003 to The manufacturing industry is responsible for the majority of total hazardous waste. UN ECE Agenda 21 suggests several actions for governments in order to strengthen the international capacity of handling hazardous waste such as invest in R&D associated with waste management, increase information and education on the subject, improving waste handling infrastructure, establish legal frameworks etc. Actions incurring an estimated global cost of USD 18.5 billion yearly. As the amount of hazardous waste increases and incurs great costs to society, this indicator is highly relevant. Time behaviour demand-oriented Definition iti and Calculation l Formula: Hazardous Waste Ratio = total amount of hazardous waste / VA Unit/Dimension: ton / unit currency Rating: Min: infinite Max: infinite Trend: the lower, the better Analysis / Drill Down: Related to product, production unit, and plant. Remarks Notes / Explanation: The quantity of hazardous waste in comparison to total waste varies between countries. Corporate level: Worker, Master, Chief Effect model: to be determined Production type: continuous, batch, discrete Prof. Yoshiro Fukuda, Department of System & Design, Hosei University 18
19 9.26 Comprehensive energy consumption Name / Title of indicator: Description Benefit / Application: Time behavior Definition and Calculation Formula: Comprehensive Energy Consumption Indicators to measure the consumption of energy are used by enterprises for energy savings, environmental protection, and cost reduction. Though energy can be considered as a form of raw material, it helps to evaluate the consumption of energy using distinct indicators. Comprehensive Energy Consumption is the ratio between all the energy consumed in a production cycle and produced quantity. demand-oriented, periodic e = E/PQ =( Mi*Ri + Q)/ PQ where e: unit energy consumption of statistical object, standard quantity / ton E: comprehensive energy consumption, standard quantity Mi: actual consumption of certain kind of energy, ton (kilowatt hour) Ri a : conversion coefficient of certain kind of energy, standard quantity / ton Q: algebraic sum of effective energy exchanges with environment, standard quantity PQ is expressed in tons Unit/Dimension: standard quantity / ton Rating: Min: 0 Max: related to product Analysis / Drill Down: Remarks Notes / Explanation: Trend: the lower, the better. Related to product and statistics unit Energy consumption is an important factor impacting the production costs and final profits. Corporate level Worker, Master, Chief, Management Effect model: to be determined Production type: continuous, batch, discrete a The conversion coefficient Ri is used to unify the measurement modes of different energy types, by which a certain kind of energy can be changed into standard quantity. (e.g. the unit of Ri for water is standard quantity / ton; for electricity the unit of Ri is standard quantity / kilowatt-hour.) The Comprehensive Energy Consumption indicator is used with a collection of standard quantity conversion tables, which are unique for different industries. Prof. Yoshiro Fukuda, Department of System & Design, Hosei University 19