Course Title: Hydrology, Irrigation and Flood Management Course Code: CE 4163 Credit: 3
|
|
|
- Ophelia Perkins
- 5 years ago
- Views:
Transcription
1 Course Title: Hydrology, Irrigation and Flood Management Course Code: CE 4163 Credit: 3 Reference Books 1. Hydrology by H.M. Raghunath 2. A Text Book of Hydrology - P. Jaya Rami Reddy 3. Engineering Hydrology - K. Subramanya 4. Irrigation Engineering and Hydraulic Structures by S.K. Garg 5. Irrigation: Theory and Practice by A. M. Michael 6. Irrigation and Water Power Engineering by B.C. Punmia 7. Irrigation, Water Resources and Water Power Engineering by P.N. Modi Course Content Hydrologic cycle; hydrologic measurement: precipitation, evaporation and stream flow; hydrographs Plant-soil-water relationship; consumptive use and estimation of irrigation water requirements methods of irrigation; quality of irrigation water; problems of irrigated land Flood and its management
2 Hydrology, Irrigation and Flood Management (CE 4163) Chapter: Introduction Reference Book: Hydrology by H.M. Raghunath 2 nd Edition Lecture prepared by Md Nuruzzaman Lecturer, Department of Civil Engineering Bangladesh Army University of Engineering and Technology (BAUET)
3 Hydrology Introduction Hydrology is the science, which deals with the occurrence, distribution and disposal of water on the planet earth; it is the science which deals with the various phases of the hydrologic cycle.
4 Scope of Hydrology Introduction The study of hydrology helps us to know (i) the maximum probable flood that may occur at a given site and its frequency; (ii) the water yield from a basin its occurrence, quantity and frequency, etc; (iii) the ground water development (iv)the maximum intensity of storm and its frequency for the design of a drainage project in the area.
5 Introduction Hydrologic Data The basic hydrological data required are: (i) Climatological data (ii) Hydrometeorological data like temperature, wind velocity, humidity, etc. (iii) Precipitation records (iv) Stream-flow records (v) Seasonal fluctuation of ground water table or piezometric heads (vi) Evaporation data (vii) Cropping pattern, crops and their consumptive use (viii) Water quality data of surface streams and ground water (ix) Geomorphologic studies of the basin, like area, shape and slope of the basin, (x) Hydrometeorological characteristics of basin:
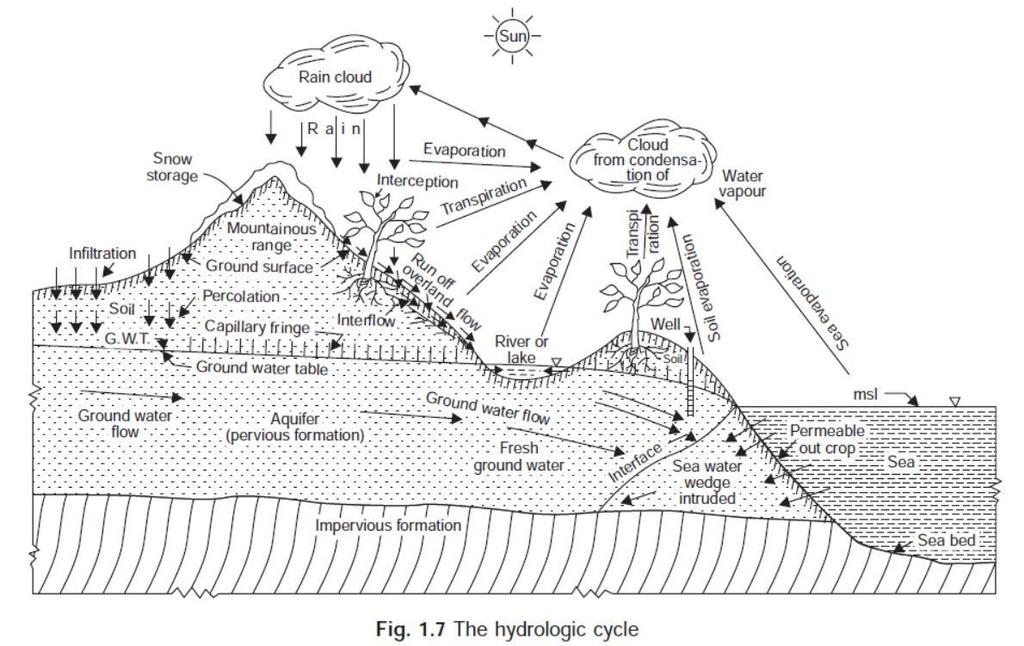
6 Water Cycle Introduction
7 Introduction
8 Hydrology, Irrigation and Flood Management (CE 4163) Chapter: Precipitation Reference Book: Hydrology by H.M. Raghunath 2 nd Edition (Chapter 2) Lecture prepared by Md Nuruzzaman Lecturer, Department of Civil Engineering Bangladesh Army University of Engineering and Technology (BAUET)
9 Precipitation Forms of Precipitation 1. Drizzle 2. Rain the condensed water vapour of the atmosphere falling in drops (>0.5 mm, maximum size 6 mm) from the clouds. 3. Glaze. 4. Sleet Snow 5. Snow flakes 6. Hail 7. Dew 8. Frost 9. Fog 10.Mist a very thin fog
10 Types of Precipitation Precipitation 1. Thermal convection (convectional precipitation) 2. Conflict between two air masses (frontal precipitation) 3. Orographic lifting (orographic precipitation) 4. Cyclonic (cyclonic precipitation)
11 Precipitation Measurement of Precipitation 1. Non-Recording Rain Gauge 2. Recording Rain Gauge There are three types of recording rain gauges 1. Tipping bucket gauge 2. Weighing gauge 3. Float gauge
12 Precipitation
13 Precipitation
14 Precipitation
15 Precipitation
16 Precipitation
17 Precipitation
18 Precipitation
19 Precipitation
20 Precipitation
21 Precipitation
22 Precipitation
23 Precipitation

24 Optimum Rain-gauge Network Design Precipitation
25 Precipitation
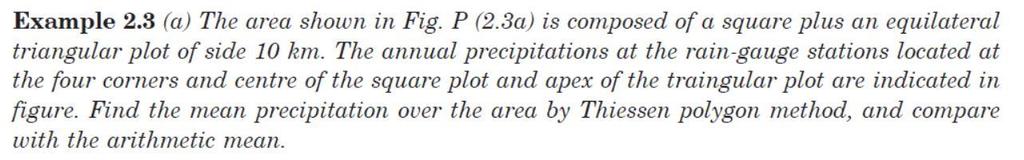
26 Precipitation
27 Precipitation
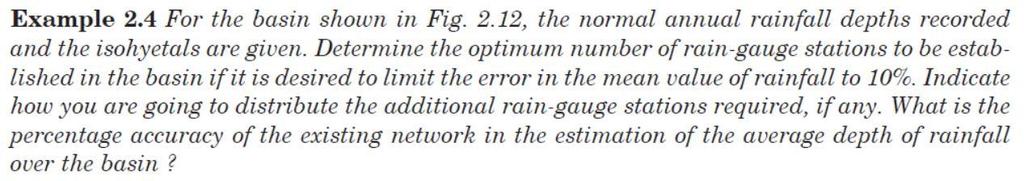
28 Precipitation
29 Precipitation
30 Precipitation GRAPHICAL REPRESENTATION OF RAINFALL Hyetograph A hyetograph is a bar graph showing the intensity of rainfall with respect to time and is useful in determining the maximum intensities of rainfall during a particular storm as is required in land drainage and design of culverts.
31 Precipitation GRAPHICAL REPRESENTATION OF RAINFALL Mass curve A mass curve of rainfall (or precipitation) is a plot of cumulative depth of rainfall against time. From the mass curve, the total depth of rainfall and intensity of rainfall at any instant of time can be found
32 ANALYSIS OF RAINFALL DATA Precipitation
33 Precipitation ANALYSIS OF RAINFALL DATA Recurrence interval Recurrence interval is the average number of years during which a storm of given magnitude (maximum depth or intensity) may be expected to occur once, i.e., may be equalled or exceeded. Frequency Frequency F is the percentage of years during which a storm of given magnitude may be equalled or exceeded.
34 ANALYSIS OF RAINFALL DATA Precipitation
35 ANALYSIS OF RAINFALL DATA Precipitation
36 Precipitation
37 Precipitation
38 Precipitation
39 Precipitation
40 Precipitation Moving Averages Curve In order to depict a general trend in the rainfall pattern, the averages of three or five consecutive years are found out progressively by moving the group averaged, one year at a time known as moving average curve
41 Precipitation Probable Maximum Precipitation (PMP) The probable maximum precipitation (PMP) for a given region is the precipitation resulting from the most critical meteorogical combinations that are considered probable ofoccurrence.
42 Hydrology, Irrigation and Flood Management (CE 4163) Chapter: Evaporation Reference Book: Hydrology by H.M. Raghunath 2 nd Edition (Chapter 2 Water Losses) Lecture prepared by Md Nuruzzaman Lecturer, Department of Civil Engineering Bangladesh Army University of Engineering and Technology (BAUET)
43 Evaporation Water Losses (i) Interception loss-due to surface vegetation, i.e., held by plant leaves. (ii) Evaporation: (a) from water surface, i.e., reservoirs, lakes, ponds, river channels, etc. (b) from soil surface, appreciably when the ground water table is very near the soil surface. (iii) Transpiration from plant leaves. (iv) Evapotranspiration for consumptive use from irrigated or cropped land. (v) Infiltration into the soil at the ground surface. (vi) Watershed leakage ground water movement from one basin to another or into the sea.

44 Evaporation Evaporation from water surfaces (Lake evaporation) 1. Storage reservoirs of more depth and less surface area, i.e., by choosing a cross section of the reservoir like a deep gorge 2. By growing tall trees like Causerina on the windward side of the reservoirs to act as wind breakers. 3. By spraying certain chemicals or fatty acids and formation of films. 4. By allowing flow of water, temperature is reduced and evaporation is reduced; i.e., by designing the outlet works so that the warmer surface water can be released. 5. By removing the water loving weeds and plants like Phreatophytes from the periphery of the reservoir.
45 Evaporation Methods of Estimating Lake Evaporation (i) The storage equation P + I ± O g = E + O ± S...(3.4) where P = Precipitation, I = surface inflow, O g = subsurface inflow or outflow, E = evaporation, O = surface outflow, S = change in surface water storage (ii) Auxiliary pans like land pans, floating pans, Colarado sunken pans, etc. (iii) Evaporation formula
46 Evaporation Methods of Estimating Lake Evaporation (iv) Humidity and wind velocity gradients (v) The energy budget this method involves too many hydrometeorological factors (variables) with too much sophisticated instrumentation and hence it is a specialist approach (vi) The water budget similar to (i) (vii) Combination of aerodynamic and energy balance equations Penman s equation (involves too many variables)
land")

47 Evaporation Pans (i) Floating pans (ii)land pan (iii)colarado sunken pan Evaporation Land pan
48 EVAPORATION PANS Evaporation
49 Evaporation Pan coefficient The small volume of water in the metallic pan is greatly affected by temperature fluctuations in the air or by solar radiations in contrast with large bodies of water (in the reservoir) with little temperature fluctuations. Thus the pan evaporation data have to be corrected to obtain the actual evaporation from water surfaces of lakes and reservoirs, i.e., by multiplying by a coefficient called pan coefficient and is defined as Pan coefficient.
50 Evaporation Measures to Reduce Lake Evaporation 1. Storage reservoirs of more depth and less surface area, i.e., by choosing a cross section of the reservoir like a deep gorge. 2. By growing tall trees like Causerina on the windward side of the reservoirs to act as wind breakers. 3. By spraying certain chemicals or fatty acids and formation of films. 4. By allowing flow of water, temperature is reduced and evaporation is reduced; i.e., by designing the outlet works so that the warmer surface water can be released. 5. By removing the water loving weeds and plants like Phreatophytes from the periphery of the reservoir.
51 Evaporation Measures to Reduce Lake Evaporation 6. By straightening the stream-channels the exposed area of the water surface (along the length) is reduced and hence evaporation is reduced. 7. By providing mechanical coverings like thin polythene sheets to small agricultural ponds and lakes. 8. By developing undergound reservoirs, since the evaporation from a ground water table is very much less than the evaporation from a water surface. 9. If the reservoir is surrounded by huge trees and forest, the evaporation loss will be less due to cooler environment.
52 Evaporation Soil Evaporation The evaporation from a wet soil surface immediately after rain or escape of water molecules with more resistance when the water table lies within a meter from the ground is called soil evaporation. Evaporation opportunity Soil evaporation is expressed as a percentage of evaporation from free water surface, which is called evaporation opportunity.
53 Evaporation Evapotranspiration Evapotranspiration (E t ) or consumptive use (U) is the total water lost from a cropped (or irrigated) land due to evaporation from the soil and transpiration by the plants or used by the plants in building up of plant tissue.
54 Evaporation Estimation of Evapotranspiration (i) Tanks and lysimeter experiments (ii) Field experimental plots (iii) Installation of sunken (colarado) tanks (iv) Evapotranspiration equations as developed by Lowry-Johnson, Penman, Thornthwaite, Blaney- Criddle, etc. (v) Evaporation index method, i.e., from pan evaporation data as developed by Hargreaves and Christiansen.
55 Blaney-Criddle Formula Evaporation
56 Evaporation Example 3.2 Determine the evapotranspiration and irrigation requirement for wheat, if the water application efficiency is 65% and the consumptive use coefficient for the growing season is 0.8 from the following data :
57 Evaporation
58 CE 4127 Chapter: Hydrographs Reference Book: Hydrology by H.M. Raghunath 2 nd Edition (Chapter 5) Lecture prepared by Md Nuruzzaman Lecturer, Department of Civil Engineering Bangladesh Army University of Engineering and Technology (BAUET)
59 Hydrograph HYDROGRAPHS A hydrograph is a graph showing discharge (i.e., stream flow at the concentration point) versus time.
60 HYDROGRAPHS
61 HYDROGRAPHS Recession curve After the peak of hydrograph, GWT declines and the hydrograph again goes on depleting in the exponential form called the ground water depletion curve or the recession curve.
62 Baseflow Separation HYDROGRAPHS
63 Baseflow Separation HYDROGRAPHS (i) Simply by drawing a line AC tangential to both the limbs at their lower portion. (ii) Extending the recession curve existing prior to the occurrence of the storm up to the point D directly under the peak of the hydrograph and then drawing a straight line DE, where E is a point on the hydrograph N days after the peak, and N (in days) is given by N = 0.83 A 0.2 where A = area of the drainage basin, km 2
64 Baseflow Separation HYDROGRAPHS (iii) Simply by drawing a straight line AE, from the point of rise to the point E, on the hydrograph, N days after the peak. (iv) Construct a line AFG by projecting backwards the ground water recession curve after the storm, to a point F directly under the inflection point of the falling limb and sketch an arbitrary rising line from the point of rise of the hydrograph to connect with the projected base flow recession.
65 HYDROGRAPHS Unit Hydrograph The hydrograph of direct surface discharge measured at the outlet of drainage area, which produces a unit depth of direct runoff (i.e., a P net of 1 cm over the entire area of the catchment) resulting from a unit storm of specified duration (called unit period) is called a unit hydrograph of that duration.
66 HYDROGRAPHS
67 HYDROGRAPHS Elements of unit hydrograph Base width (T) The period of direct surface runoff (due to a unit storm) of the unit hydrograph is called the time base or the base width. Unit storm The storm of unit duration (i.e., duration of the unit hydrograph) regardless of its intensity is called unit storm.
68 HYDROGRAPHS Elements of unit hydrograph Lag time (tp) The time from the centre of a unit storm to the peak discharge of the corresponding unit hydrograph is called lag time. Recession time (Tr) The duration of the direct surface runoff after the end of the excess or net rainfall, is called recession time in hydrograph analysis.
69 HYDROGRAPHS Assumptions of Unit Hydrograph (i) The net rainfall is of uniform intensity within its duration (i.e., unit period). (ii) The net rainfall uniformly occurs over the entire area of the drainage basin. (iii) For a given drainage basin, the base period of the hydrographs of direct runoff corresponding to net rains of different intensities but same unit duration, is constant. (iv) The ordinates of direct runoff hydrographs due to net rains of different intensities (but same unit duration) are proportional. (v) A unit hydrograph reflects all the physical characteristics of the basin.
70 HYDROGRAPHS Propositions of the Unit Hydrograph (i) Same runoff duration. For all unit storms of different intensities, the period of surface runoff (i.e., time base, base width or base period) is approximately the same, although they produce different runoff volumes. (ii) Proportional ordinates. For unit storms of different intensities, the ordinates of the hydrograph at any given time, are in the same proportion.
71 HYDROGRAPHS Propositions of the Unit Hydrograph (iii) Principle of superposition. If there is a continuous storm and/or isolated storms of uniform intensity net rain, they may be divided into unit storms and hydrographs of runoff for each storm obtained, and the ordinates added with the appropriate time lag to get the combined Hydrograph. (iv) Same distribution percentages. If the total period of surface runoff (i.e., time base or base width) is divided into equal time intervals the percentage of surface runoff that occurs during each of these periods will be same for all unit storms of different intensities.
72 HYDROGRAPHS APPLICATION OF UNIT HYDROGRAPH The application of unit hydrograph consists of two aspects: (i) From a unit hydrograph of a known duration to obtain a unit hydrograph of the desired duration, either by the S-curve method or by the principle of superposition. (ii) From the unit hydrograph so derived, to obtain the flood hydrograph corresponding to a single storm or multiple storms.
73 HYDROGRAPHS Limitation of the Unit Hydrograph 1. The design storm continuing for several unit periods may not have the same areal distribution for each time increment. 2. Storm movements also affect the proportions of the unit hydrograph if the basin is large. Hence, the unit hydrograph can not be applied for basins larger than 5000 km 2.
74 HYDROGRAPHS Synthetic Unit Hydrographs There are many drainage basins (catchments) for which no streamflow records are available and unit hydrographs may be required for such basins. In such cases, hydrographs may be synthesised directly from other catchments, which are hydrologically and meteorologically homogeneous, or indirectly from other catchments through the application of empirical relationship. This is known as Synthetic unit hydrograph.
75 HYDROGRAPHS Example 5.1 (a) The runoff data at a stream gauging station for a flood are given below. The drainage area is 40 km 2. The duration of rainfall is 3 hours. Derive the 3-hour unit hydrograph for the basin and plot the same.
76 HYDROGRAPHS Example 5.1 (a)
77 HYDROGRAPHS Example 5.1 (a)- Solution
78 HYDROGRAPHS Example 5.1 (a)- Solution
79 HYDROGRAPHS Example 5.1 (a)- Solution
80 HYDROGRAPHS Example 5.1 (a)- Solution
81 HYDROGRAPHS Example 5.1 (a)- Solution
82 HYDROGRAPHS
83 HYDROGRAPHS
84 HYDROGRAPHS
85 HYDROGRAPHS S-CURVE S-curve or the summation curve is the hydrograph of direct surface discharge that would result from a continuous succession of unit storms producing 1 cm in certain duration of the unit graph (t r hr).
86 HYDROGRAPHS Example 5.4 The ordinates of a 4-hour unit hydrograph for a particular basin are given below. Derive the ordinates of (i) the S-curve hydrograph, and (ii) the 2 hour unit hydrograph, and plot them, area of the basin is 630 km 2.
87 HYDROGRAPHS
88 HYDROGRAPHS
89 HYDROGRAPHS
90 HYDROGRAPHS Example 5.11 The design storm of a water shed has the depths of rainfall of 4.9 and 3.9 cm for the consecutive 1-hr periods. The 1-hr UG can be approximated by a triangle of base 6 hr with a peak of 50 cumec occurring after 2 hr from the beginning. Compute the flood hydrograph assuming an average loss rate of 9 mm/hr and constant base flow of 10 cumec. What is the area of watershed and its coefficient of runoff?
91 HYDROGRAPHS Example 5.11 (Solution)
92 HYDROGRAPHS Example 5.11 (Solution)
93 HYDROGRAPHS Example 5.11 (Solution)
94 HYDROGRAPHS Example 5.13 The successive three-hourly ordinates of a 6-hr UG for a particular basin are 0, 15, 36, 30, 17.5, 8.5, 3, 0 cumec, respectively. The flood peak observed due to a 6-hr storm was 150 cumec. Assuming a constant base flow of 6 cumec and an average storm loss of 6 mm/hr, determine the depth of storm rainfall and the streamflow at successive 3 hr interval.
95 HYDROGRAPHS Example 5.13 (Solution)
96 Hydrology, Irrigation and Flood Management (CE 4163) Chapter: Stream Gauging and Runoff Reference Book: Hydrology by H.M. Raghunath 2 nd Edition (Chapter 4 Runoff and Chapter 6 Stream Gauging) Lecture prepared by Md Nuruzzaman Lecturer, Department of Civil Engineering Bangladesh Army University of Engineering and Technology (BAUET)
97 Runoff Overland flow When a storm occurs, a portion of rainfall infiltrates into the ground and some portion may evaporate. The rest flows as a thin sheet of water over the land surface which is termed as overland flow. Catchment The entire area of a river basin whose surface runoff (due to a storm) drains into the river in the basin is considered as a hydrologic unit and is called drainage basin, watershed or catchment area of the river flowing. Drainage divide The boundary line, along a topographic ridge, separating two adjacent drainage basins is called drainage divide.
98 Runoff Concentration point The single point or location at which all surface drainage from a basin comes together or concentrates as outflow from the basin in the stream channel is called concentration point or measuring point. Concentration time The time required for the rain falling at the most distant point in a drainage area (i.e., on the fringe of the catchment) to reach the concentration point is called the concentration time.
99 RUNOFF FACTORS AFFECTING RUNOFF
100 RUNOFF FACTORS AFFECTING RUNOFF
101 RUNOFF Runoff Estimation (i) Empirical formulae, curves and tables (ii) Infiltration method (iii) Rational method (iv) Overland flow hydrograph (v) Unit hydrograph method (vi) Coaxial Graphical Correlation and API
102 RUNOFF Empirical formulae, curves and tables
103 RUNOFF Empirical formulae, curves and tables
104 RUNOFF Rational Method A rational approach is to obtain the yield of a catchment by assuming a suitable runoff coefficient. Yield = CAP where A = area of catchment P = precipitation C = runoff coefficient
105 RUNOFF
106 RUNOFF
107 Stream gauging STREAM GAUGING Measuring the discharge of the stream draining is termed as stream gauging. Gauging station A gauging station is the place or section on a stream where discharge measurements are made.
108 STREAM GAUGING METHODS OF MEASURING STREAM FLOW 1. Venturiflumes or standing wave flumes 2. Weirs or anticuts 3. Slope-area method 4. Contracted area methods 5. Sluiceways, spillways and power conduits 6. Salt-concentration method 7. Area-velocity methods Float Rod Current meter
109 Velocity Profiles STREAM GAUGING
110 STREAM GAUGING


111 STREAM GAUGING Current meter The current meter is an instrument, which has a rotating element which when placed in flowing water, the speed of revolutions has a definite relation with the velocity of flow past the element.
112 STREAM GAUGING Rating of the Current Meter The relationship between the revolutions per second (N, rps) of the meter and the velocity of flow past the meter (v, m/sec) has to be first established, or if the rating equation is given by the maker, it has to be verified. This process of calibration of the meter is called rating of the current meter. The rating equation is of the form v = an + b where a and b are constants (determined from rating of the current meter).
113 STREAM GAUGING Rating of the Current Meter (Method)
114 STREAM GAUGING SELECTION OF SITE FOR A STREAM GAUGING STATION (i) The section should be straight and uniform for a length of about 10 to 20 times the width of the stream. (ii) The bed and banks of the stream should be firm and stable so as to ensure consistency of area-discharge relationship, i.e., the cross section should not be subjected to change by silting or scouring, during different stages of flow; a smooth rock, shingle or clay bed is favourable, while a fine sandy bed is unfavourable. (iii) The bed and banks should be free from vegetal growth, boulders or other obstructions like bridge piers, etc. (iv) There should be no larger overflow section at flood stage. The best cross section is one with V-shape, so that there is sufficient depth for immersing the current meter without being affected by the bed roughness of the stream.
115 STREAM GAUGING SELECTION OF SITE FOR A STREAM GAUGING STATION (v) The part of the reach having the most regular transverse section and steady flow with the current normal to the metering section and velocities in the range of m/sec should be selected. (vi) To ensure consistency between stage and discharge, there should be a good control section far downstream of the gauging site. This control may be in the form of steep rapids, large rocky boulders, restricted passages, crest of weirs or anticuts etc. (vii) The sites above the confluence of rivers are best avoided if the flow is affected by back water conditions due to the varying discharges in the tributaries. (viii) The stream gauging station should be easily accessible.
116 STREAM GAUGING Problem Following Velocities Were Recorded In A Stream With A Current Meter. Find The Discharge Per Unit Width Of Stream Near The Point Of Measurement By Two-point Method. Depth Of Flow At The Point Was 3.5 Meter DEPTH ABOVE BED (M) VELOCITY (M/SEC)
117 Hydrology, Irrigation and Flood Management (CE 4163) Chapter: Flood and its management Reference Book: Hydrology by H.M. Raghunath 2 nd Edition Lecture prepared by Md Nuruzzaman Lecturer, Department of Civil Engineering Bangladesh Army University of Engineering and Technology (BAUET)
118 FLOOD ESTIMATION &ROUTING Flood routing Flood routing is the process of determining the reservoir stage, storage volume of the outflow hydrograph corresponding to a known hydrograph of inflow into the reservoir. Design flood The maximum flood that any structure can safely pass is called the design flood and is selected after consideration ofeconomic and hydrologic factors.
119 FLOOD ESTIMATION &ROUTING Standard Project Flood (SPF) This is the estimate of the flood likely to occur from the most severe combination of the meteorological and hydrological conditions, which are reasonably characteristic of the drainage basin being considered, but excluding extremely rare combination. Maximum Probable Flood (MPF) This differs from the SPF in that it includes the extremely rare and catastrophic floods and is usually confined to spillway design of very high dams. The SPF is usually around 80% ofthe MPF for the basin.
120 FLOOD ESTIMATION &ROUTING ESTIMATION OF PEAK FLOOD (i) Physical indications of past floods flood marks and local enquiry (ii) Empirical formulae and curves (iii) Concentration time method (iv) Overland flow hydrograph (v) Rational method (vi) Unit hydrograph (vii) Flood frequency studies
121 FLOOD ESTIMATION &ROUTING ESTIMATION OF PEAK FLOOD (Empirical formula)
122 FLOOD ESTIMATION &ROUTING ESTIMATION OF PEAK FLOOD
123 FLOOD ESTIMATION &ROUTING ESTIMATION OF PEAK FLOOD
124 FLOOD ESTIMATION &ROUTING Return period The return period or recurrence interval (T) is the average number of years during which a flood of given magnitude will be equalled or exceeded once.
125 Return period The return period or recurrence interval (T) is the average number of years during which a flood of given magnitude will be equalled or exceeded once. METHODS OF FLOOD CONTROL (i) by confining the flow between high banks by constructing levees (flood banks), dykes, or flood walls. (ii) by channel improvement by cutting, straightening or deepening and following river training works. (iii) by diversion of a portion of the flood through bypasses or flood ways. In some cases a fuse plug levee is provided. It is a low section of levee, which when once over topped, will
126 FLOOD ESTIMATION &ROUTING METHODS OF FLOOD CONTROL (iv) by providing a temporary storage of the peak floods by constructing upstream reservoirs and retarding basins (detention basins). (v) by adopting soil conservation measures (land management) in the catchment area. (vi) by temporary and permanent evacuation of the flood plain, and flood plain zoning by enacting legislation. (vii) by flood proofing of specific properties by constructing a ring levee or flood wall around the property. (viii) by setting up flood forecasting short term, long term, rhythm signals and radar, and warning centres at vulnerable areas.
127 FLOOD ESTIMATION &ROUTING METHODS OF FLOOD CONTROL Flood Control by Reservoirs Retarding Basins Construction oflevees Channel Improvement
128 FLOOD ESTIMATION &ROUTING
129 FLOOD ESTIMATION &ROUTING
130 FLOOD ESTIMATION &ROUTING Steps involved in the design of a flood control project (i) Determination of the project design flood and flood characteristics of the basin. (ii) Assessment of flood damages for different flood stages and socio-economic problems involved. (iii) Field survey of flood-prone areas and defining areas to be protected. (iv) Determination of the possible methods of flood protection. (v) If flood control is feasible by construction of reservoirs and levees, selection of suitable sites and their physical characteristics.
131 FLOOD ESTIMATION &ROUTING Steps involved in the design of a flood control project (vi) Design details of the flood control structures proposed and preparation of cost estimates. (vii) For a combination of flood control measures, selection of a flood peak that offers the desired protection at minimum cost. (viii) Making the cost-benefit analysis of the project and its economic justification. (ix) Development of a scientific flood forecasting and warning system.
132 FLOOD ESTIMATION &ROUTING Steps involved in the design of a flood control project (x) Preparation of a detailed project report, indicating the alternative flood control measures explored, the combination finally selected with the economic justification for the same, and the degree of flood protection offered. (xi) Construction of the project proposed after approval and sanction of the budget from the authority concerned.