How Climate Change Impacts Urban Runoff and Water Quality Design
|
|
|
- Charla Heath
- 5 years ago
- Views:
Transcription


1 How Climate Change Impacts Urban Runoff and Water Quality Design by J. C. Hayes, C. Privette, III and S. J. Klaine AWRA Conference Anchorage, AK May 4-7, 2009
2 Presentation Outline Introduction: Why manage water? Trends in the Southeast Modeling LID BMPs Example Scenarios Conclusions


3 Introduction: Why Manage age Water? QUANTITY: Flooding / drought Conveyance Temporary / longterm storage Salt water intrusion QUALITY: Pathogenic bacteria Nuisance blooms / Low DO Sediment Invasive species / Fish kills Downstream ecological health
4 Related Projects CLUE project funded by USDA-NRCS -- Monitoring of development sites TWIG Project with Upstate Forever and EPA -- Encourage use of LID in new developments -- Provide for retrofits in older developments IDEAL with Greenville County and Woolpert INC. -- Modeling of water quality & quantity


5 Changes in Flow ase in Runoff Increa Urbanization (% impervious surface)
6 Runoff or Recharge: Wet Period Lost Creek 5.43 inches Knight Creek 4.61 inches Lost Creek higher runoff/acre Lost Creek lower recharge cf/acre Rainfall and Flow Wet Period, August Rainf all Flow Lost Creek Knight Creek 5000 Rainfall and Flow Dry Period, May 2006 Rainfall Flow Dry Period cf / acre Lost Creek Knight Creek Lost Creek 1.08 inch/25 days Knight Creek 1.12 inch/25 days Knight Creek higher base flow/acre


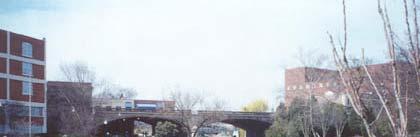
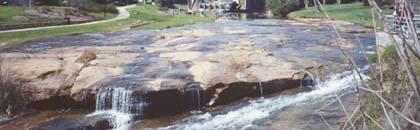
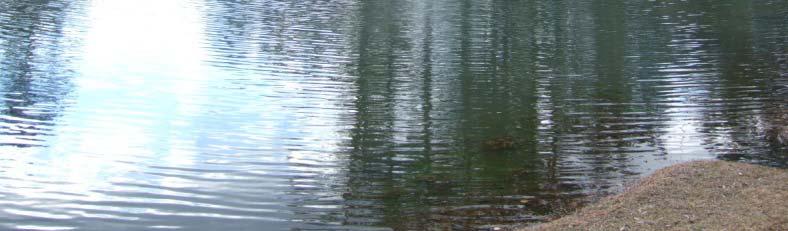
7 Surface Water Protection Traditional BMP methods focused on controlling peak flow only Ponds are common design


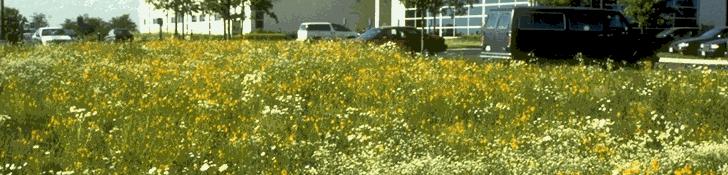
8 Surface Water Protection (cont.) Innovative methods focus on reducing peak flow, runoff volume & improving water quality LID design emphasizes green solutions often using infiltration/vegetation
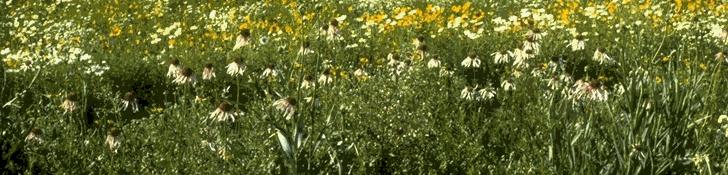
9 Concepts for Low Impact Development Retain the natural landscape and hydrology Promote open space preservation Reduce and disconnect impervious surfaces Emphasize on-site management of stormwater Encourage natural vegetative buffers Require maintenance plans
10 Trends in the Southeast: What s Happening? Tremendous amount of interest! Hot topic for engineers and designers Developers need to know difference in costs/benefits Contractors want to know how to build? Consumers want to be in LIDs!


11 Trends in Greenville County: Biggest Drought on Record
12 LID Modeling: Modeling Quantity and Quality Most LID models are spreadsheet based Most consider only water quantity and use either rule of thumbs or simple infiltration methods Water quality models for LID are limited to selective BMPs and/or geographic areas
13 What does IDEAL model consider? Loadings from pervious or impervious surfaces (Runoff, Sediment, Nutrients and Bacteria) Conveyances (Channels and Pipes) Best Management Practices (BMPs)
14 Best Management Practices (BMPs) Dry and wet ponds Bioretention i cells Vegetative filter strips Bioswales Sand filters Infiltration trenches Cisterns User defined engineered devices 14
15 Runoff Loading

16 Runoff Loading


17 Sediment Yield Pervious Impervious


18 Nutrient Loading Yield based on event mean concentrations ti (EMCs) for each nutrient EMCs vary based on land use


19 Bacteria Loading Modeling Indicator Bacteria Yield based on event mean concentrations (EMCs) for bacteria EMCs highly variable National average ~ 15,000 number/100ml Depend on presence of pets, wildlife, leaky sewers, etc. very, very iffy information
20 20


21 Conveyances
22 BMPs: BMP Trapping Basics for IDEAL Predicts trapping of sediments in ponds through overflow rate calculations for particle classes. Predicts nutrient t trapping by settling of particulate matter and sorbed portion on trapped active clay content of the sediment by isotherms. Predicts bacteria trapping using isotherms, settling, infiltration and mortality.


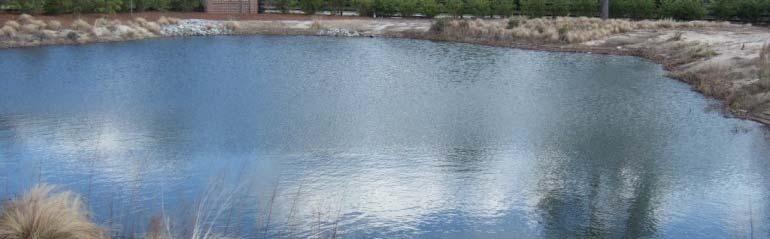


23 23 Wet Detention Pond
24 Wet Detention Pond Detain runoff for extended period to allow suspended pollutants to settle. Designed to treat both storm water quantity and quality. Among most cost-effective and widely used stormwater practices.. 24
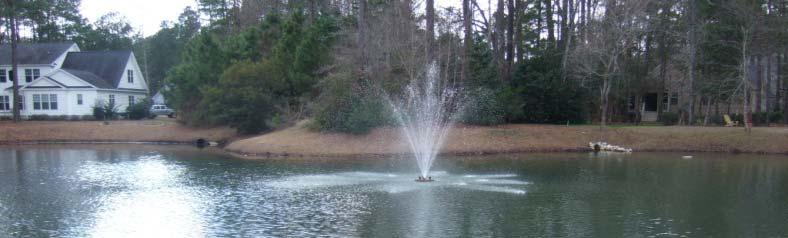
25 25 Dry Detention Pond
26 Dry Detention Pond Provide temporary storage of storm water runoff to reduce downstream water quantity impacts. Designed to completely drain following a storm event and normally dry between storm events. Less costly than wet ponds because less excavation is required. 26
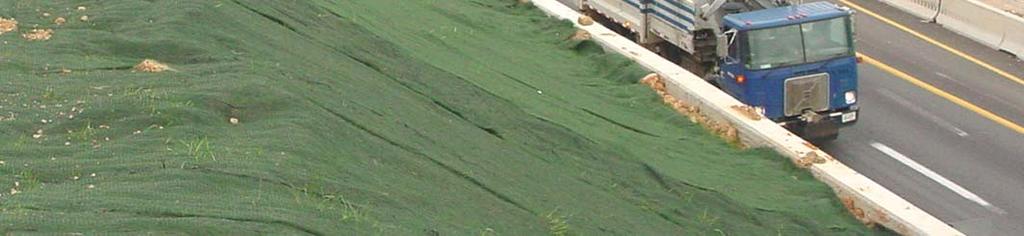
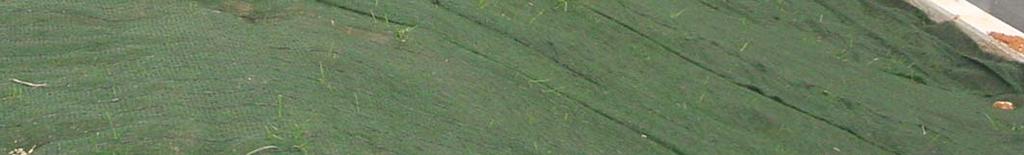
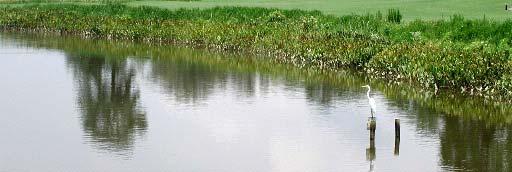
27 27 Vegetative Filter Strip
28 Vegetative Filter Strips To be effective, shallow flow must be maintained across entire filter strip. If flow concentrates, it short circuits filter strip and reduces water quality benefits. Trapping is also by infiltration. 28


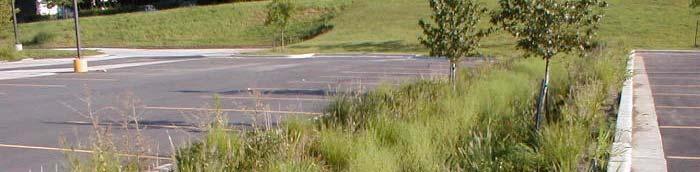
29 29 Vegetated Channels and Swales
30 Vegetated Channels and Swales Designed and installed as alternative to curb and gutter and hard piping i for storm water conveyance. Improve water quality by providing partial pollutant removal as water is filtered by vegetation and by infiltration into soil. Can also reduce flow velocities when compared to hard piping systems. 30
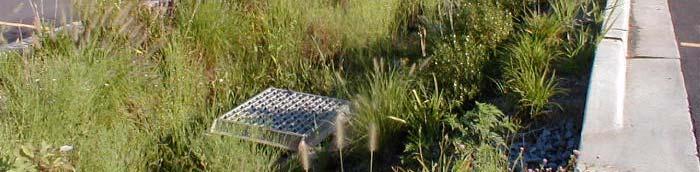
31 31 Enhanced Bioswale
32 Enhanced Bioswale Include filter bed of prepared soil that overlays underdrain d system. Limit slopes to slow flow and allow particulate settling and limit it effects of erosion. Install berms, check dams, weirs & other structures perpendicular to flow to promote settling and infiltration. 32
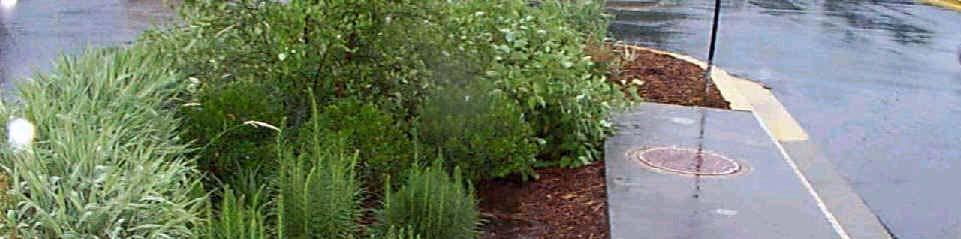
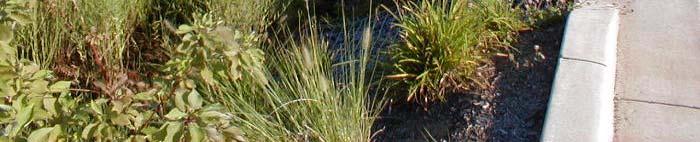
33 33 Bioretention Area
34 Bioretention Cell (BRC) Treatment area consists of a grass buffer strip, ponding area, mulch layer, planting soil mix, and plants. BRCs can control stormwater t volume to predisturbed d levels in some locations Limited study shows effectiveness in heavy metals Somewhat effective in removing phosphorus Not effective in removing nitrates
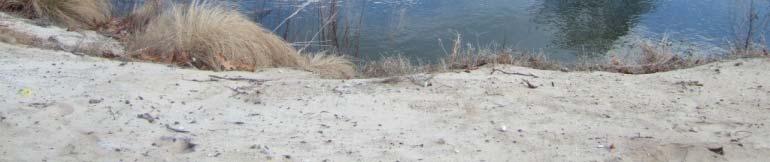
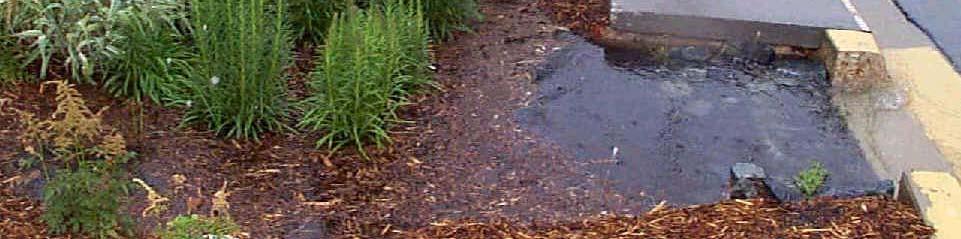
35 35 Infiltration Trench
36 Infiltration Trench Excavated trench filled with stone to capture and infiltrate t runoff into surrounding soils from bottom and sides of trench. Preserves natural water balance by recharging groundwater. Removes wide variety of pollutants through adsorption, precipitation, filtering, and bacterial and chemical degradation. 36
37 BMPs in Series or Treatment Train 37 Some BMPs are better than others for certain pollutants Consider the connectivity of BMPs Front-end sediment collection is good; i.e., forebays or traps Vegetated BMPs can be overloaded so should be toward the end of train or in stabilized areas Urban Land Use Bioswale or VFS Pond Wetland Buffer Receiving Waters
38 Example Scenarios: Three (3) Scenarios in This Paper 1. Loadings with no BMPs, 2. Loadings with one detention pond, and 3. Loadings with all VFSs and detention pond. Note: For each scenario, there are nine (9) rainfall conditions ranging g from Tr = 1 yr with AMC I (dry) to Tr = 100 yrs with AMC III (wet)
39 IDEAL Scenarios
40 Example Scenarios: Precipitation Single 24-hr storm selected for each run with recurrence intervals 1, 2, 5, 10, 25, 50 and 100 years Growing season AMC II representing average moisture for all storms plus AMC I for 1 year and AMC III for 100 years Note: If desired, IDEAL will also consider multiple storms to estimate total annual loading but takes longer to run
41 Example Scenarios: Rainfall Depths
42 Example Scenarios: Watershed Description Eight (8) subwatersheds, each is 2.5 ac., CN of 72, PRF of 325, and a T c of 0.16 hr, Soil is 12.5% clay, 21.5% silt and 66% sand, Soil erodibility of 0.28, and Average annual EMCs for nutrients assumed to be 2.06 mg/l for Total N and 0.28 mg/l for Total P. Note: If desired, IDEAL will consider many, y subwatersheds including combinations of pervious, impervious and combined cover.
43 Example Scenarios: Dry Pond Description Assumed average performance, Stage at t4ftf for Pond d1 provides a area of f ac, Low flow orifice has a diameter of 8 in., Outlet tis a circular 24i in. riser connected dto 16i in. barrel having length of 80 ft, Emergency spillway included to prevent overtopping.
44 Example Scenarios: Vegetative Filter Strip Description Dimensions: 40 ft wide by 100 ft long in the direction of flow, Slope of 0.02 ft/ft, Soil texture, t used to estimate t infiltration, ti assumed to be sandy clay loam, Vegetation type is lawn, either mowed or unmowed, and Vegetative characteristics similar to fescue.
45 E l S i Example Scenarios: Yield: 2-yr Return Period
46 Conclusions: Climate change is likely to have significant impact on design storms as well as BMP size and effectiveness. The process of land use change, even under construction Best Management Practices (BMP) required by regulations, do not adequately protect downstream ecosystems.
47 Conclusions (cont.): Pollutant loadings frequently increase at a much higher rate as compared to runoff. The 80% trapping efficiency required by SC law allows significant sediment to move offsite and may substantially impact downstream biota and habitat.
48 Conclusions (cont.): Bacteria are a major source of impairment for surface waters. Our research suggests fecal coliforms migrate from disturbed lands, may have long residence times in sediments, and are likely resuspended during storms. Nutrients (nitrogen and phosphorus) begin to migrate from development sites even in initial stages of development and may result in blooms of noxious algae in downstream water bodies.


49 Questions?