The Use of a Thin-Layer Cap to Manage Hg and PCB Contaminated Sediments in Peninsula Harbour, Ontario, Canada
|
|
|
- James Scott
- 5 years ago
- Views:
Transcription

1 The Use of a Thin-Layer Cap to Manage Hg and PCB Contaminated Sediments in Peninsula Harbour, Ontario, Canada Erin Hartman, Kay Kim, Roger Santiago, Rupert Joyner and Matthew Graham Environment Canada Sediment Remediation Unit June 16, Toronto, ON

2 Outline 1. Engineering Design 2. Procurement 3. Implementation 4. Lessons Learned 5. Post Construction Monitoring
 Hg Management Target: 3 ppm PCB Management Target: 0.")
3 Peninsula Harbour AOC COCs: Mercury and PCBs Source: historical pulp mill and Chlor-Alkali plant activities Sediment Management Area: 250,000 m 2 (25 ha or 50 football fields) Hg Management Target: 3 ppm PCB Management Target: 0.34 ppm

4 Capped Area 4

5 Design Cap Thickness Medium: cm with average of 15 cm Coarse: cm with average of 20 cm A thicker cap and heavier sand was used in areas of high energy
6 Engineering Design Medium sand Coarse sand Size % passing % passing 25 mm Sand Gradation 12 mm #10 sieve-2 mm #40 sieve-0.425mm #100 sieve-0.15 mm <10 <10 #200 sieve mm <6 <6 Uniformity coefficient <8 <8 Plasticity (fine fraction) non-plastic non-plastic D50 mm Specific Gravity >2.64 >2.64
7 Engineering Design Sand Specification - Chemical Chemical properties of the sand to meet CCME s Interim Freshwater Sediment Quality Guidelines except for Chromium and Copper Cr and Cu levels were revised to local background levels as these levels are naturally high in this area. (Cr <=50 ppm; Cu <=90 ppm)
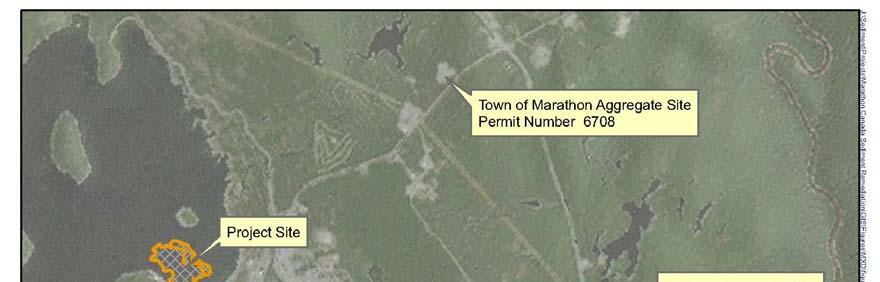
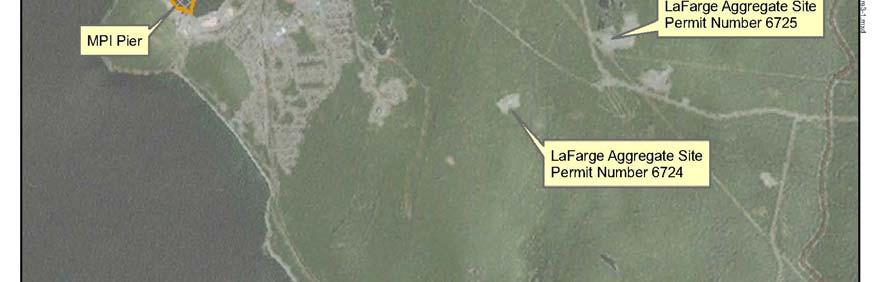
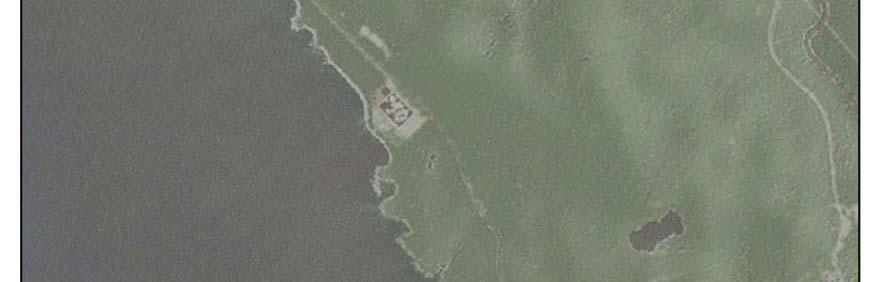

8 Engineering Design - Sand Staging and Borrow Areas in Relation to TLC Site
9 Cap Transition Zones 9
10 Contracting 1. EC was the project lead and PWGSC was the contracting authority 2. Tendering vs. RFP methods of procurement were examined 3. Decided to go with an RFP based on performance criteria (i.e., RFP specified the performance criteria and it was up to bidders to come up with methodology to meet the performance criteria) 4. Bids evaluated by EC, MOE, AECOM and PWGSC
11 Contracting Performance Criteria 1. Cap area coverage 2. Cap thickness 3. Sand gradation 4. Sand chemistry 5. Turbidity 6. Water Chemistry release of Hg and PCBs from contaminated sediment
12 Environmental Mitigation Measures Silt fence placed to prevent sand from entering water in the staging area Installed turbidity curtains to protect two nearshore habitat areas as per DFO/MNR advice Turbidity curtain box attached to the capping barge (bidder)


13 Implementation Testing Cell Objective of the testing cell is to try out different placement methods to meet performance criteria Test cell chosen to cover both medium and coarse sand area Duration: 1 week Thickness Verification: 16 cores

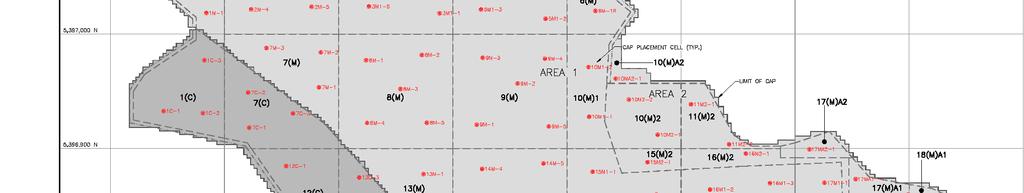
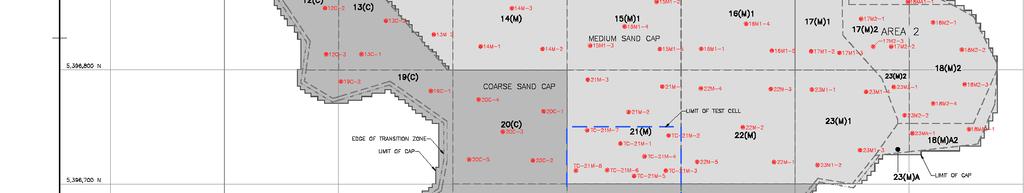
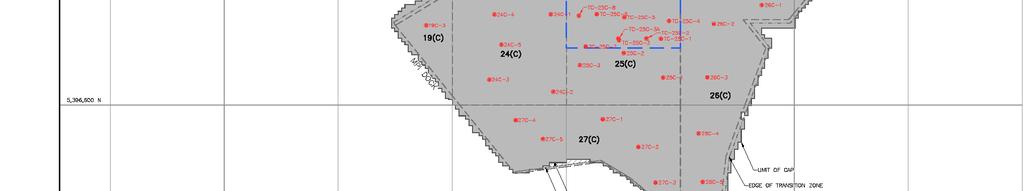
14 Coring Stations 14
15 Capping Operation Summary Capped 23 ha with medium/coarse sand Placed 36,000 tonnes of coarse; 49,600 tonnes of medium Average production 4,635 m 2 /day or 1,616 tonnes/day Started capping on June 5 and finished on Aug 5, hours of delay due to weather; 26 hours of delay due to mechanical problems
16 Cost of TLC Implementation Estimate at SMO stage: $3.43 million (2007) Estimate at 33% design (excluding project management cost): $5 million (2010) Estimate at 99% design stage (excluding project management cost): $6 million (2011) Tender = received five bids; lowest price exceeded budget. Switched from coarse to medium sand in approximately five hectares to stay within budget (did not impact the environment or effect the integrity/functionality of the cap). At completion (excluding project management cost): $6.3 million
17 Cost of TLC Implementation Construction: $6.3 million AECOM (supervision): $547,656 PWGSC (project management): $138,400 Post Cap Bathymetry Survey: $15,000 Total Cost: $ 6,980,236 Funds remaining at the end of project from $7.3 million budget: $319,764
18 Lessons Learned The project was completed ahead of schedule due to starting the project early in the year when we had good weather. Allowed flexibility in the sequencing of cell being capped to maintain/maximize productivity. Need better methods to quantify amount of sand applied in each cell. (Used sand displacement measurements on the barge but on days where multiple cells were capped, it was difficult to determine the volume for each cell.)
19 Post Implementation Monitoring Studies Sediment Profile Imagery (SPI) Submerged Aquatic Vegetation and Cap Movement Tracer Study to determine the mixing between the cap and native material
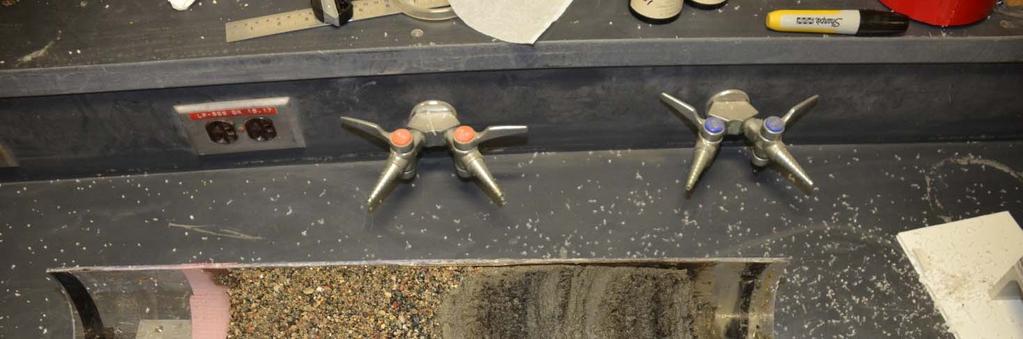
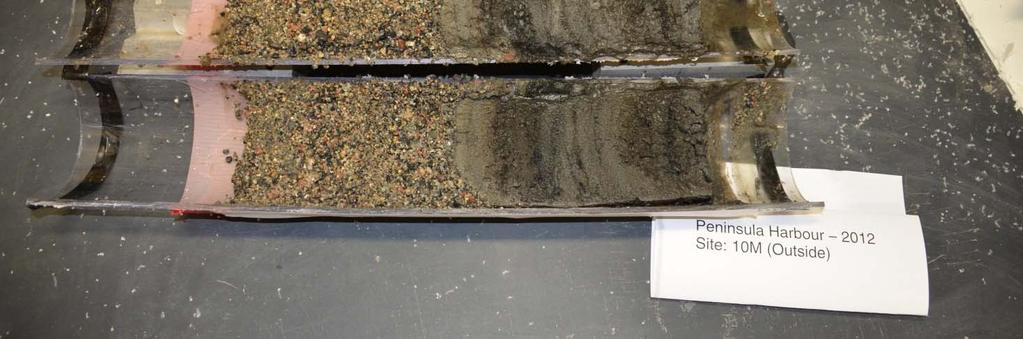
20 Cores
21 Submerged Aquatic Vegetation (SAV) and Cap Movement (Northern Bioscience) The study was designed to provide postconstruction baseline data to monitor: the distribution and potential movement of the sand cap; and the recovery of SAV within the cap


22 Submerged Aquatic Vegetation Stonewort (Chara) Pondweed (Potamogeton) Canada Waterweed (Elodea canadensis)

23 Survey Grid


24 Cap Imagery Inside the Cap Outside the Cap

25 Ponar Grab Stations

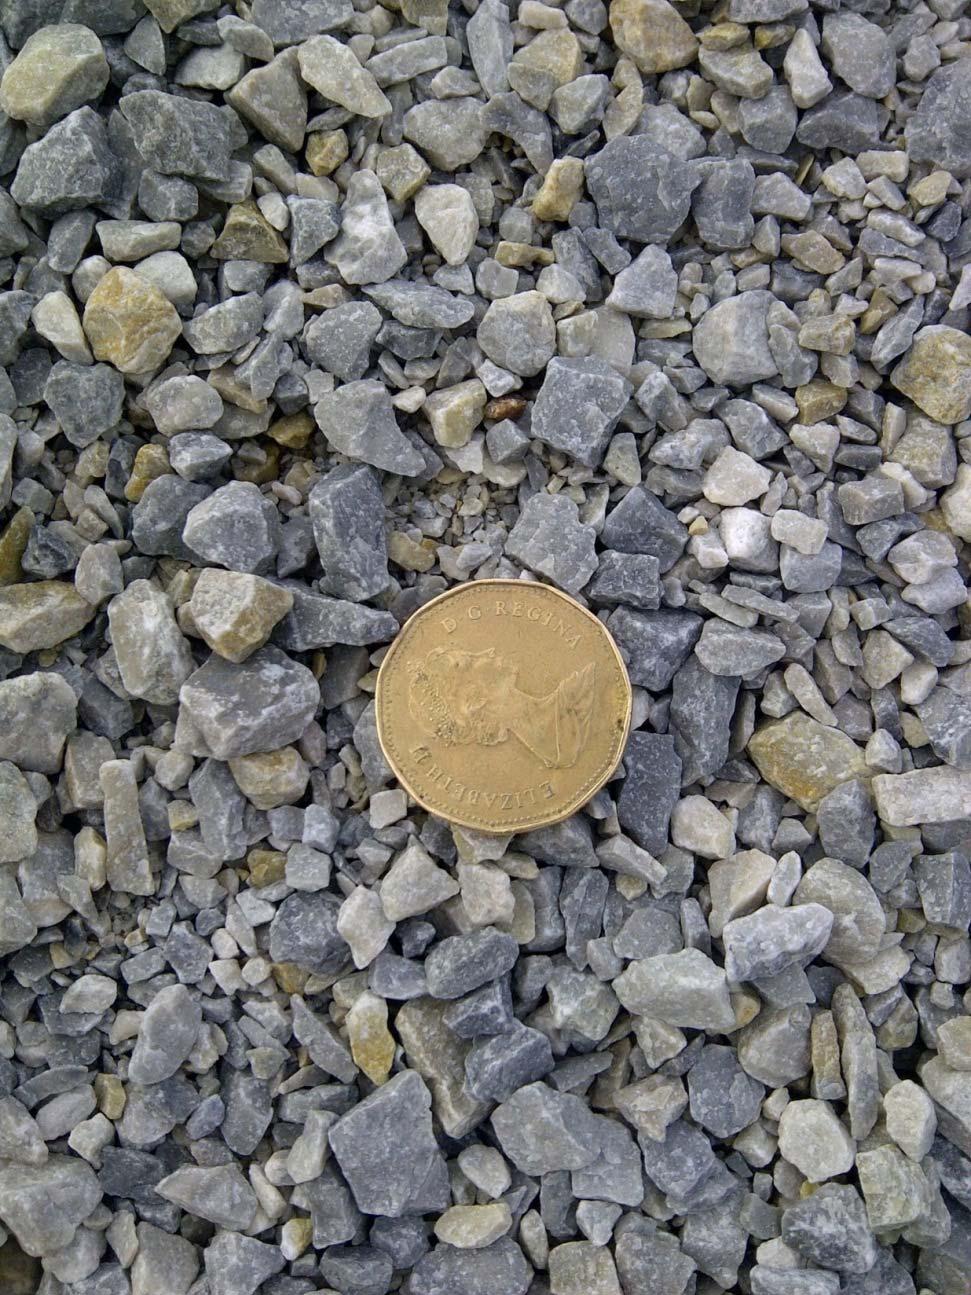
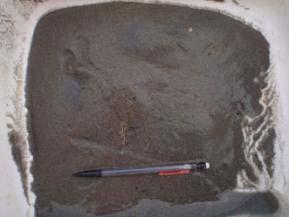
26 Capping Material


27 Cap Material from Grab Sampler

28 Outside Cap

29 Results Cap Substrates

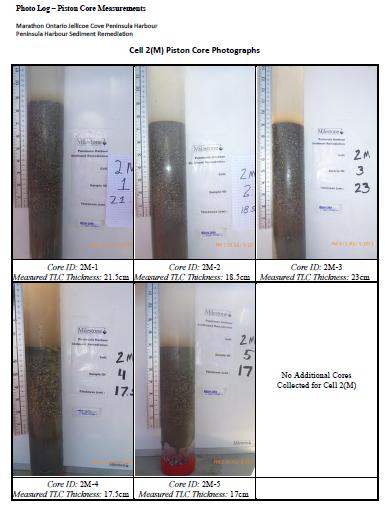
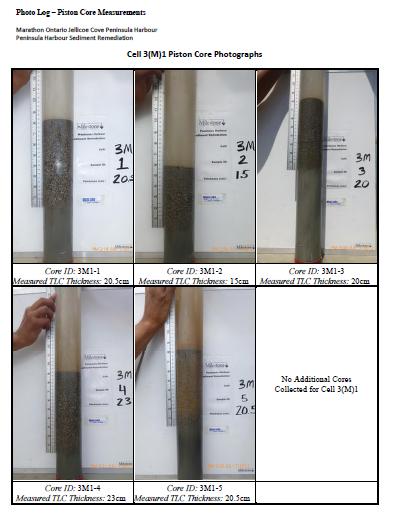
30 Core Thickness


31 Before - After
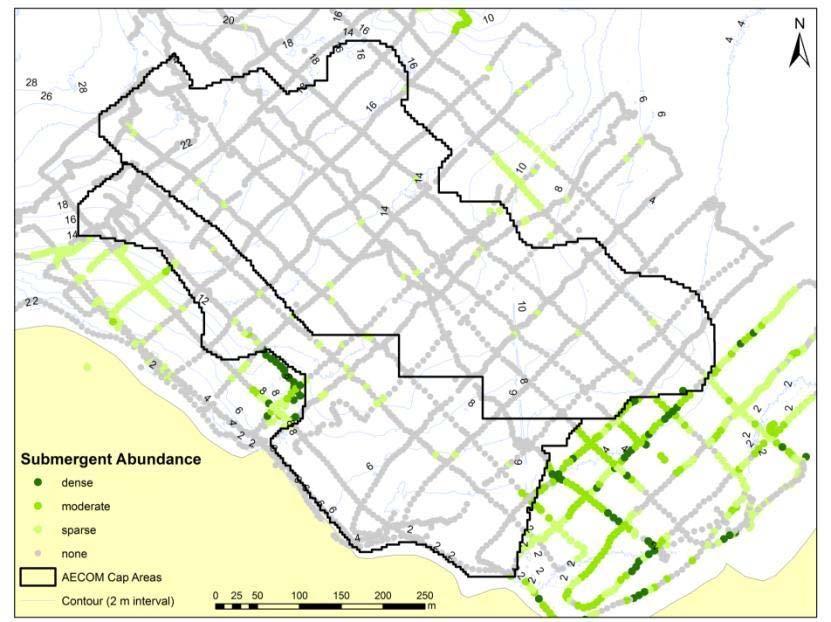
32 SAVs
33 Long Term Monitoring Studies Re-colonization of submerged aquatic vegetation and cap movement study (0, 1, 3, 5, 10 yrs) Re-colonization of benthic community (5, 10, 15, 20) Benthic invertebrate tissue survey (Hg) (5, 10, 15, 20) Fish tissue survey (5, 10, 15, 20) Sediment Chemistry (5, 10, 15, 20)


34 Thank You PH Sediment Remediation Technical Team PH Sediment Remediation Management Committee Community Liaison Committee EcoSuperior Environmental Programs