PREPARED FOR: VDOT ENVIRONMENTAL DIVISON PREPARED BY: MICHAEL BAKER INTERNATIONAL IN ASSOCIATION WITH: SC&A INC.
|
|
|
- Ruby May
- 5 years ago
- Views:
Transcription


1 Transform I-66 Inside the Beltway Investing in Multi-Modal Solutions Project Level Air Quality Analysis in Support of a Categorical Exclusion STATE PROJECT NO. : A-358 UPC: PREPARED FOR: VDOT ENVIRONMENTAL DIVISON PREPARED BY: MICHAEL BAKER INTERNATIONAL IN ASSOCIATION WITH: SC&A INC.
2
3 Transform I-66 Inside the Beltway Project Level Air Quality Analysis Table of Contents Executive Summary Introduction Project Need Existing Conditions Regulatory Requirements and Guidance National Environmental Policy Act of 1969 (NEPA) Clean Air Act Mobile Source Air Toxics (MSATs) and FHWA Guidance MOVES2014/2014a VDOT Air Quality Resource Document Carbon Monoxide Analysis Overview of Screening Analysis Traffic Summary Information CO Receptor Locations: Signalized intersection and Mainline Modeling Inputs No-Build Scenarios Results of CO Screening Analysis - Build Scenarios CO Conclusions Particulate Matter (PM) PM Regulations & Overview Interagency Consultation and Discussion of Findings PM Conclusions Mobile Source Air Toxics Analysis MSAT Background Motor Vehicle Emissions Simulator (MOVES) MSAT Research Project Quantitative MSAT Analysis : Incomplete or Unavailable Information for Project-Specific MSAT Health Impacts Analysis MSAT Conclusions Construction Emission Analysis Regional Conformity Status of the Project Indirect and Cumulative Effects Conclusions /15/2016 Page i
4 Transform I-66 Inside the Beltway Project Level Air Quality Analysis Table of Contents Continued Appendices Appendix A: Interagency Consultation Webinar Presentation and Meeting Minutes Appendix B: Sample MOVES Input File Appendix C: Sample CAL3QHC Input/Output Files Appendix D: CO Modeling Layout List of Tables Table 1: National Ambient Air Quality Standards... 9 Table 2: PM Peak Hour Volumes, Delays and LOS at Intersections Table 3: Comparison of Forecasted Peak Hour Volumes and Worst-Case Volumes Assumed for CO Screening Analysis Table 4: Maximum Potential CO Concentrations (ppm) Table 5: Annual MSAT Emissions by Year, Scenario and Pollutant Table 6: Change in Annual MSAT Emissions by Year, Scenario and Pollutant from No-Build and from Existing Emissions List of Figures Figure 1: I-66 Inside the Beltway Core Study Area... 5 Figure 2: Intersections Selected for Detailed Operations Analysis Figure 3: Intersections Selected for CO Screening Evaluation Figure 4a: Traffic Forecasts For I-66 Inside the Beltway 1 of Figure 4b: Traffic Forecasts For I-66 Inside the Beltway 2 of Figure 5: 2040 Affected Roadway Network Exhibits Exhibit A: National MSAT Emission Trends for Vehicles Operating on Roadways Using EPA's MOVES 2010b Model /15/2016 Page ii
5 Transform I-66 Inside the Beltway Project Level Air Quality Analysis Executive Summary In 2012, VDOT and the Virginia Department of Rail and Public Transportation published the I-66 Multimodal Study, Inside the Beltway. This effort was conducted in cooperation with local jurisdictions, transit agencies, and other transportation stakeholders. In 2013, a Supplemental Report was published which further documented a recommended refined alternative to address documented transportation deficiencies in the I-66 corridor inside the Beltway. In a December 9, 2014 letter to local jurisdictions, Virginia Secretary of Transportation Aubrey L. Layne, Jr. announced VDOT's decision to advance the recommendations from that 2012/2013 study effort. This was further reinforced in a March 12, 2015 briefing to local media and elected officials. The cornerstone of the recommendations from the 2012/2013 study is the implementation of a variable toll condition along I-66 which will be owned and managed by VDOT, creating a revenue stream to help offset the cost of the multimodal elements in the 2012/2013 study. Conversion of I-66 inside the Beltway to dynamically priced toll lanes during the AM and PM peak periods in both directions will allow free travel for HOV qualified users and will allow VDOT to manage steady flow of traffic overall. The Multimodal improvements receiving funds from the project will be determined by the region through a cooperative process involving the Northern Virginia Transportation Commission. This project is located within areas (Fairfax and Arlington Counties) that are part of a region currently designated non-attainment or maintenance for one or more of the national ambient air quality standards (NAAQS) established by the Environmental Protection Agency (EPA), as follows: DC-Maryland-Virginia marginal nonattainment area for the 2008 eight-hour ozone standard, DC-Maryland-Virginia maintenance area for the 1997 primary annual fine particulate matter (PM 2.5) NAAQS 1, and Arlington County-City of Alexandria maintenance area for the carbon monoxide (CO) NAAQS 2. As such, federal transportation conformity rule (40 CFR Parts 51 and 93) requirements apply, including specifically requirements for inter-agency consultation for conformity (IACC) on the models, methods and assumptions to be applied in project-level air quality analyses (40 CFR (c)(1)) and the corresponding section of the Virginia Regulation for Transportation Conformity (9 VAC Section 70). The IACC requirements were met in two ways: 1. In December 2015, IACC was conducted on all of the models, methods and assumptions specified or referenced in the VDOT Project-Level Air Quality Resource Document 3, which were applied in this analysis either directly or without substantive change. The Resource Document was created by VDOT to facilitate and streamline the preparation of project-level air quality analyses while maintaining high standards for quality. Appendix L of the VDOT Resource Document includes specific technical criteria for screening projects as ones potentially of air quality concern 1 On March 23, 2015, EPA issued a proposed rule (80 FR 15340) on Fine Particulate Matter National Ambient Air Quality Standards: State Implementation Plan Requirements that stated, in part: EPA is proposing to revoke the 1997 primary annual standard because the EPA revised the primary annual standard in This is the PM 2.5 NAAQS for which the DC- Maryland-northern Virginia region is currently in maintenance. At the time of preparation of this report, EPA has not yet finalized that proposed revocation. If and when it does, then the associated project-level ( hot-spot ) air quality analysis requirements as specified in the federal transportation conformity rule would no longer apply. See: 2 Until March 16, 2016, at which time the maintenance period (and associated conformity requirements) for CO ends. Note the CO maintenance area is comprised of Arlington County and the City of Alexandria only. 3 To be made available on the VDOT website: 3/15/2016 Page 1
6 Transform I-66 Inside the Beltway Project Level Air Quality Analysis for PM 2.5, which were developed based on examples provided in EPA guidance. No adverse comments were received. 2. In addition, in the interests of full transparency and notwithstanding the IACC already completed on the Resource Document, IACC was conducted for this project via webinar on February 18 th, No adverse comments were received, including specifically the proposed determination that the project was not one of potential air quality concern for PM 2.5. PM 2.5 Analysis: For PM 2.5, the screening criteria presented in Appendix L of the VDOT Resource Document, which were established based on EPA guidance and subjected to IACC as noted above, were applied to determine if this project represents one of local air quality concern. Traffic forecasts developed for this project showed that increases in average daily diesel truck traffic associated with the build scenario would not exceed 2,000 trucks per day 4, the criterion established in the VDOT Resource Document for highway capacity expansion. Additional factors that support the conclusion that this project is not one of local air quality concern for PM 2.5 include: Mainline capacity increases usable by trucks are not part of the proposed action. The area has already achieved the 1997, 2006 and 2012 PM 2.5 NAAQS Background concentrations are well below the 1997 NAAQS ( ppb). EPA has proposed to revoke the 1997 PM 2.5 NAAQS in its implementation of the 2012 standard. This would change the status of the area from maintenance to attainment of the NAAQS, eliminating PM 2.5 conformity requirements entirely. Based on the weight of evidence it was determined that the proposed improvements are not ones of air quality concern for PM 2.5 and therefore a detailed quantitative assessment of potential impacts was not required. CO Analysis: A quantitative CO hot spot worst-case screening analysis was performed for the project for purposes of both conformity and NEPA, using inputs and procedures specified in the VDOT Resource Document and consistent with applicable EPA and FHWA requirements and guidance. The analysis was conducted as follows: Modeling was completed for existing (2014), the project opening (2017) and design (2040) years. The modeling was conducted with EPA models for emissions (MOVES2014a) and dispersion (CAL3QHC and CALINE3), with the dispersion modeling facilitated in part with the FHWA CAL3i interface model (which invokes the EPA models). Modeling was conducted for three highly congested major intersections (VA 123 & Lewinsville Road, VA 123 & Kirby Road and VA 7 & Idylwood Rd) and the interchange between I-66 & I- 495/The Capital Beltway. Modeling in all cases was conducted using worst-case assumptions for traffic and facility configurations. For example, at the interchange, worst-case traffic volumes were applied, traffic and emissions were concentrated into a single grade separation rather than modeled over broadly dispersed ramps, and receptors were located at twenty feet from the edge of the travelled roadways rather than outside the right of way limits that are outside the footprint of the interchange and therefore much further away from the modeled roadway. 4 This represents 20% of the ten thousand diesel trucks per day criterion established in the VDOT Resource Document (based on the examples provided in EPA guidance) for new highway construction. 3/15/2016 Page 2
7 Transform I-66 Inside the Beltway Project Level Air Quality Analysis The results for all of the analyses (intersection and interchange) show that CO concentrations for the Build scenarios are expected to remain well below the CO NAAQS for all locations modeled throughout the corridor for each year modeled. Based on the modeling results, implementation of the project is not expected to cause or contribute to a violation of the CO NAAQS. Mobile Source Air Toxics (MSATs): Based on FHWA guidance and the forecast total traffic volumes for I-66, this project is categorized as one with high potential effects for MSATs, which include the following: acrolein, benzene, 1,3 butadiene, diesel particulate matter, formaldehyde, naphthalene, and polycyclic organic matter. A detailed quantitative assessment (modeling) following FHWA guidance was therefore conducted for the project to assess the potential impacts for MSATs. The assessment shows that there would be no long-term adverse impacts associated with the Build scenario and that future MSAT emissions across the entire study corridor would be significantly below today s levels, even after accounting for projected VMT growth. More specifically, the modeling results indicate that MSAT emissions are expected to decrease from the No-Build to the Build scenario in 2017, but increase slightly from the No-Build to the Build scenario in 2040, although these increases are not considered to be significant. However, when compared to existing conditions, emissions of all MSAT pollutants under the 2017 and 2040 Build scenarios are projected to be significantly lower than exist today. EPA's stringent vehicle emission and fuel regulations, combined with fleet turnover, are expected to significantly lower fleet-average emission rates for MSATs in the future relative to today. Overall, best available information indicates that, nationwide, regional levels of MSATs are expected to decrease in the future due to fleet turnover and the continued implementation of more stringent emission and fuel quality regulations. Nevertheless, it is possible that some localized areas may show an increase in emissions and ambient levels of these pollutants due to locally increased traffic levels associated with the project. Indirect Effects and Cumulative Impacts: Effects of the project that would occur at a later date or are fairly distant from the project are referred to as indirect effects. Cumulative impacts are those effects that result from the incremental impact of the action when added to other past, present and reasonably foreseeable future actions. Cumulative impacts are inclusive of the indirect effects. The potential for indirect effects or cumulative impacts to air quality that may be attributable to this project is not expected to be significant for a couple of reasons. First, regarding indirect effects, the quantitative assessments conducted for project-specific CO and MSAT impacts and the regional conformity analysis conducted for ozone can all be considered indirect effects analyses because they look at air quality impacts attributable to the project that occur at a later time in the future. These analyses demonstrated that in the future, 1) air quality impacts from CO will not cause or contribute to violations of the CO NAAQS; 2) MSAT emissions from the affected network will be significantly lower than they are today; and 3) ozone attributable to this and all other projects In the region will not exceed the mobile source emissions budgets established for the region. Second, regarding the potential for cumulative impacts, the annual conformity analysis conducted by the Transportation Planning Board (MPO for the Washington, D.C. metropolitan nonattainment/ maintenance area) represents a cumulative impact assessment for purposes of regional air quality. Federal conformity requirements, including specifically 40 CFR and 40 CFR , apply as the area in 3/15/2016 Page 3
8 Transform I-66 Inside the Beltway Project Level Air Quality Analysis which the project is located is designated as nonattainment for ozone and maintenance for fine particulate matter. Accordingly, there must be a currently conforming transportation plan and program at the time of project approval, and the project must come from a conforming plan and program (or otherwise meet criteria specified in 40 CFR (b)). The existing air quality designations for the region are based, in part, on the accumulated mobile source emissions from past and present actions, and these pollutants serve as a baseline for the current conformity analysis. The conformity analysis quantifies the amount of mobile source emissions for which the area is designated nonattainment/maintenance that will result from the implementation of all reasonably foreseeable (i.e. those proposed for construction funding over the life of the region s transportation plan) regionally significant transportation projects in the region. The most recent conformity analysis was completed in October 2015, with FHWA and FTA issuing a conformity finding on February 4, 2016 for the TIP and CLRP covered by that analysis. This analysis demonstrated that the incremental impact of the proposed project on mobile source emissions, when added to the emissions from other past, present, and reasonably foreseeable future actions, is in conformance with the SIP and will not cause or contribute to a new violation, increase the frequency or severity of any violation, or delay timely attainment of the NAAQS established by EPA. Therefore, the indirect and cumulative effects of the project are not expected to be significant. 3/15/2016 Page 4
 and the Virginia Department of Rail and Public Transportation (VDRPT) published the final report for the I-66 Multimodal")
9 Transform I-66 Inside the Beltway Project Level Air Quality Analysis 1.0 Introduction In 2012, the Virginia Department of Transportation (VDOT) and the Virginia Department of Rail and Public Transportation (VDRPT) published the final report for the I-66 Multimodal Study, Inside the Beltway. 5 This effort was conducted in cooperation with local jurisdictions, transit agencies, and other transportation stakeholders. A Supplemental Report to further develop alternatives for the I-66 Inside the Beltway corridor was published in The core study area for this project is shown in Figure 1. In a letter dated December 9, 2014, to local jurisdictions, Virginia Secretary of Transportation Aubrey L. Layne, Jr. announced VDOT's decision to advance the recommendations from the I-66 Multimodal Study. This was further reinforced in a briefing by VDOT to local media and elected officials on March 12, The cornerstone of the recommendations from the I-66 Multimodal study is the implementation of dynamically priced tolling to be owned and managed by VDOT. The revenue stream from the tolling will offset the cost of the multimodal elements in the I-66 Multimodal study. Conversion of I-66 inside the Beltway to dynamically priced toll lanes during the AM and PM peak hours in the peak directions (Eastbound AM, Westbound PM) will allow free travel for HOV qualified users and will allow VDOT to manage the flow of traffic overall. The toll revenues will be set aside for funding of potential widening of I-66 inside the Beltway and for specific multimodal improvements within the Corridor. The Northern Virginia Transportation Commission (NVTC) will lead a cooperative process, with VDOT and stakeholder agencies and jurisdictions to identify, assess, and select those multimodal corridor improvements for funding from the toll revenues. Selected improvements will be addressed separately, where required, when they are developed. Figure 1: I-66 Inside the Beltway Core Study Area Source: VDOT I-66 Inside the Beltway Draft Traffic Technical Report 5 See VDOT project website: 6 See VDOT project website: 3/15/2016 Page 5
10 Transform I-66 Inside the Beltway Project Level Air Quality Analysis Air quality became a national concern in the 1960s, leading to the passage of the Clean Air Act of This was followed by the Air Quality Act of 1967, the Clean Air Act of 1970, the Clean Air Act Amendments of 1977, and the Clean Air Act Amendments of With the passage of each piece of legislation, requirements for addressing and controlling air pollution became more stringent. Following the passage of the Federal Clean Air Act Amendments of 1990, states were mandated to implement additional steps to reduce airborne pollutants and improve local and regional conditions. Motor vehicle emissions have been identified as a critical element in attaining federal air quality standards for carbon monoxide (CO), course and fine particulate matter (PM 10 and PM 2.5), and ozone (O 3). For this project compliance is required with both the National Environmental Policy Act (NEPA) and the Clean Air Act (CAA). Highway agencies are required to consider the impacts of transportation improvement projects at both the local and regional level. Regional air quality in non-attainment and maintenance areas is assessed by ensuring that region-wide mobile source emissions fall below the applicable motor vehicle emission budgets identified by the State Implementation Plan (SIP). Where applicable, this assessment is performed by the Virginia Department of Transportation (VDOT) and/or Metropolitan Planning Organizations (MPOs) and documented in a transportation conformity analysis of the region s Transportation Improvement Program (TIP) and Long Range Transportation Plan (LRTP). This project lies within an area designated as non-attainment for the 8-hour ozone standard and maintenance for the 1997 annual fine particulate matter (PM 2.5) and the carbon monoxide (CO) standards therefore; the project is subject to applicable transportation conformity requirements. Compliance with the CAA will account for air quality impacts at both the regional and local level. NEPA, which generally requires that the impacts of an action on the environment be considered before any final decisions are made, serves as the basis for assessing air quality impacts at the project level. Accordingly, a micro-scale analysis evaluating peak CO concentrations at the project level has been performed. CO is a colorless, odorless, poisonous gas considered to be a serious threat to those who suffer from cardiovascular disease. High concentrations of CO tend to occur in areas of high traffic volumes or areas adjacent to a stationary source of the pollutant. CO emissions are associated with the incomplete combustion of fossil fuels in motor vehicles and are considered to be a good indicator of vehicle-induced air pollution. In addition to CO, EPA also regulates air toxics, which are pollutants known or suspected to cause cancer or other serious health effects. Mobile source air toxics (MSATs) are compounds emitted from highway vehicles and non-road equipment. Although there are no ambient air quality standards or transportation conformity requirements for MSATs, MSATs are within the broader purview of NEPA because they have been shown to contribute to health risks, especially for populations in proximity to major roadways. EPA has identified the following MSATs as having the greatest impact on health: benzene, acrolein, formaldehyde, 1,3-butadiene, diesel exhaust, naphthalene, and polycyclic organic matter. FHWA has issued guidance for considering the impact of MSATs from transportation projects during the NEPA process. This report provides documentation of the air quality assessments that have been performed to determine whether this project meets all NEPA and CAA requirements. 3/15/2016 Page 6
11 Transform I-66 Inside the Beltway Project Level Air Quality Analysis 2.0 Project Need Improvements in the I-66 corridor inside the Capital Beltway are needed to address: Existing and Future Capacity Deficiencies: The I-66 corridor inside the Beltway experiences congestion in the peak commuting direction which is eastbound in the AM peak hours and westbound during the PM peak hours. Travel demand is expected to continue to increase in major employment centers such as Arlington, Washington DC, Tysons, and Dulles. This increase will result in heavy traffic extending further into the off-peak periods than what is experienced today. Additionally, the Metrorail Orange Line also experiences peak hour demand that exceeds capacity. Congestion: There are several localized constraints or chokepoints that affect both cars and bus transit operations on a daily basis. Efforts have been made through the spot improvements and shoulder-use bus programs to minimize these congestion points, but congestion still exists after the completion of the recommended improvements between Fairfax Drive and North Sycamore Street. Highly Variable Travel Conditions: Travelers experience highly unreliable travel times on I- 66, particularly during peak periods. Recurrent and non-recurrent congestion, incidents, crashes, disabled vehicles and other events, and adverse weather conditions all contribute to substantial differences in travel time. Vehicular Traffic Demand in the Corridor: There are significant numbers of buses and high occupancy vehicles (HOVs) that use I-66 in the peak direction during the peak commuting hours, making I-66 inside the Beltway a heavily used multimodal corridor. There are also many single occupancy vehicles (SOVs) who are currently restricted from using I-66 in the peak directions that must travel on other parallel routes. In response to these needs, the goals for improvements along the I-66 corridor inside the Beltway are as follows: Reduce congestion on I-66 by better managing traffic demand and increased enforcement. Provide new and more reliable travel choices. Increase the number of people that can travel through the I-66 corridor as a result of more efficient traffic management, and increased use of transit, rail, bus and other alternate travel modes. 3.0 Existing Conditions The proposed project is located in northern Virginia in Fairfax and Arlington Counties. The area is best categorized as a humid subtropical climate that averages approximately 43 inches of precipitation per year. The average daily high temperature in July is 90 degrees Fahrenheit while the average daily low temperature in January is 22 degrees Fahrenheit. 4.0 Regulatory Requirements and Guidance This section provides an overview of regulations and guidance applicable to the project-level air quality analysis to support the environmental review of the project. 3/15/2016 Page 7
12 Transform I-66 Inside the Beltway Project Level Air Quality Analysis 4.1 National Environmental Policy Act of 1969 (NEPA) Under NEPA, federal agencies must consider the effects of their decisions on the environment before making any decisions that commit resources to the implementation of those decisions. Changes in air quality, and the effects of such changes on human health and welfare, are among the effects to be considered. A project-level air quality analysis has been performed to assess the air quality impacts of the project, document the findings of the analysis, and make the findings available for review by the public and decision-makers. 4.2 Clean Air Act As implemented by the Clean Air Act, the US Environmental Protection Agency (EPA) is required to set the National Ambient Air Quality Standards (NAAQS) for pollutants considered harmful to public health and welfare. As shown in Table 1, there are currently two types of standards: Primary Standards that are intended to protect public health (including protecting the health of "sensitive" populations such as asthmatics, children and the elderly), and Secondary Standards that are intended to protect the public welfare (e.g., to protect against damage to crops, vegetation, buildings, and animals). Federal actions must not cause or contribute to any new violation of any standard, increase the frequency or severity of any existing violation, or delay timely attainment of any standard or required interim milestone. Geographic regions that do not meet the NAAQS for one or more criteria pollutants are designated by EPA as non-attainment areas. Areas previously designated as non-attainment, but subsequently redesignated to attainment because they no longer violate the NAAQS, are reclassified as maintenance areas subject to maintenance plans to be developed and included in a state s SIP. This project is located in Arlington and Fairfax Counties, which are currently designated as marginal non-attainment for the hour ozone and maintenance for the 1997 annual PM 2.5 standards. As a result of these designations, the project is subject to transportation conformity requirements under the CAA pertaining to ozone, CO and PM 2.5. The federal transportation conformity rule (40 CFR Parts 51 and 93) requires air quality conformity determinations for transportation plans, programs, and projects in non-attainment or maintenance areas for transportation-related criteria pollutants for which the area is designated non-attainment or has a maintenance plan (40 CFR (b)). Transportation-related criteria pollutants, as specified in the conformity rule, include ozone (O 3), CO, nitrogen dioxide (NO 2), PM 10 and PM 2.5. Regional conformity analysis requirements apply for plans and programs; hot-spot analysis requirements of 40 CFR and apply for projects. On March 10, 2006, EPA released a rulemaking titled PM 2.5 and PM 10 Hot-Spot Analyses in Project- Level Transportation Conformity Determinations for the PM 2.5 and PM 10 National Ambient Air Quality Standards (40 CFR Part 93). This rulemaking established the criteria for determining which projects will be required to further analyze particulate emissions. In addition, the rule established the criteria for demonstrating conformity for PM 2.5 standards, and updated the existing criteria for determining conformity for PM 10 areas. EPA also provided the document Transportation Conformity Guidance for Quantitative Hot-spot Analyses in PM 2.5 and PM 10 Nonattainment and Maintenance Areas, the current version published November, Additionally, the Metropolitan Washington Council of 7 PM and CO hot-spot guidance documents are available on the EPA website: 3/15/2016 Page 8
13 Transform I-66 Inside the Beltway Project Level Air Quality Analysis Governments published an update of the region s conformity determination (inclusive of this project) October 21 st, Pollutant [final rule cite] Table 1: National Ambient Air Quality Standards Primary/ Secondary Averaging Time Level Form Carbon Monoxide [76 FR 54294, Aug 31, 2011] Lead [73 FR 66964, Nov 12, 2008] Nitrogen Dioxide [75 FR 6474, Feb 9, 2010] [61 FR 52852, Oct 8, 1996] Ozone [80 FR 65292, Oct 26, 2015] Particle Pollution Jan 15, 2013 PM2.5 PM10 Sulfur Dioxide [75 FR 35520, Jun 22, 2010] [38 FR 25678, Sept 14, 1973] primary primary and secondary 8-hour 9 ppm Not to be exceeded more than 1-hour 35 ppm once per year Rolling 3-month average primary 1-hour 100 ppb primary and secondary primary and secondary 0.15 μg/m 3 (1) Not to be exceeded Annual 53 ppb (2) Annual Mean 8-hour ppm (3) primary Annual 12 μg/m 3 secondary Annual 15 μg/m 3 primary and secondary primary and secondary 24-hour 35 μg/m 3 24-hour 150 μg/m 3 primary 1-hour 75 ppb (4) secondary 3-hour 0.5 ppm 98th percentile of 1-hour daily maximum concentrations, averaged over 3 years Annual fourth-highest daily maximum 8-hr concentration, averaged over 3 years Annual mean, averaged over 3 years annual mean, averaged over 3 years 98th percentile, averaged over 3 years Not to be exceeded more than once per year on average over 3 years 99th percentile of 1-hour daily maximum concentrations, averaged over 3 years Not to be exceeded more than once per year (1) Final rule signed October 15, The 1978 lead standard (1.5 µg/m3 as a quarterly average) remains in effect until one year after an area is designated for the 2008 standard, except that in areas designated nonattainment for the 1978, the 1978 standard remains in effect until implementation plans to attain or maintain the 2008 standard are approved. (2) The official level of the annual NO2 standard is ppm, equal to 53 ppb, which is shown here for the purpose of clearer comparison to the 1-hour standard. (3) Final rule signed October 1, 2015, and effective December 28, The previous (2008) O3 standards additionally remain in effect in some areas. Revocation of the previous (2008) O3 standards and transitioning to the current (2015) standards will be addressed in the implementation rule for the current standards. (4) Final rule signed June 2, The 1971 annual and 24-hour SO2 standards were revoked in that same rulemaking. However, these standards remain in effect until one year after an area is designated for the 2010 standard, except in areas designated nonattainment for the 1971 standards, where the 1971 standards remain in effect until implementation plans to attain or maintain the 2010 standard are approved. Source: Table and footnotes above are excerpted (5/5/2015) from US Environmental Protection Agency website: Mobile Source Air Toxics (MSATs) On December 6, 2012, FHWA issued updated guidance titled Interim Guidance Update on Mobile Source Air Toxic Analysis in NEPA. The purpose of the memorandum was to update the September 2009 interim guidance that advised FHWA Division offices on when and how to analyze MSAT under the NEPA 8 3/15/2016 Page 9
14 Transform I-66 Inside the Beltway Project Level Air Quality Analysis review process for highway projects. Based on FHWA's analysis using MOVES2010b, diesel particulate matter (diesel PM) has become the primary MSAT of concern. Additionally, the updated guidance reflects recent regulatory changes, projects national MSAT emission trends out to 2050 using EPA s MOVES2010b model, and summarizes recent research efforts; however, it did not change any project analysis thresholds, recommendations, or guidelines. The MSAT guidance includes specific criteria for determining which projects are to be considered exempt from MSAT analysis requirements and which may require a qualitative or quantitative analysis. In accordance with the guidance, the FHWA developed a tiered approach with three categories for analyzing MSAT in NEPA documents, depending on specific project circumstances. Those categories are listed below: No analysis for projects with no potential for meaningful impacts; Qualitative analysis for projects with low potential MSAT effects; or Quantitative analysis to differentiate alternatives for projects with higher potential MSAT effects. Projects considered exempt under section 40 CFR of the federal conformity rule are also specifically designated as exempt from MSAT analysis requirements. 4.4 MOVES2014/2014a On October 7, 2014, the EPA published a Federal Register Notice of Availability that approved the Motor Vehicle Emissions Simulator (MOVES2014) as the latest EPA tool for estimating emissions of volatile organic compounds (VOCs), nitrogen oxide (NO X), CO, PM 10, PM 2.5 and other pollutants from motor vehicles. With this release, EPA started a 2-year grace period to phase in the requirement of using MOVES2014 for transportation conformity analyses. In July 2014, EPA issued guidance on the use of MOVES2014 for State Implementation Plan Development, Transportation Conformity, and Other Purposes. This guidance specifies that the same grace period be applied to project-level emissions analyses. At the end of the grace period, i.e., beginning October 7, 2016, project sponsors are required to use MOVES2014 to conduct emissions analysis for both transportation conformity and NEPA purposes. In March 2015, EPA published a new EPA guidance document titled Using MOVES2014 in Project-Level Carbon Monoxide Analyses 9 for completing project-level carbon monoxide analyses using MOVES2014. In November 2015 EPA released MOVES2014a to allow MOVES users to benefit from several improvements to the model. MOVES2014a does not significantly change the criteria pollutant emissions results of MOVES2014 and therefore is not considered a new model for SIP and transportation conformity purposes. MOVES2014a incorporates significant improvements in calculating nonroad equipment emissions, and also incorporates additional reporting capabilities for these sources of emissions. For onroad emissions, MOVES2014a adds new options requested by users for the input of local vehicle miles traveled (VMT), includes minor updates to the default fuel tables, and corrects an error in MOVES2014 brake wear emissions. The change in brake wear emissions results in small decreases in PM emissions, while emissions for other criteria pollutants remain essentially the same as MOVES2014. MOVES2014a also corrects an error in the way hydrocarbon emissions are apportioned into the inputs needed by air quality models such as CMAQ and CAMx See: 10 Description of MOVE 2014a adapted from USEPA MOVES 2014a Questions and Answers, November /15/2016 Page 10
15 Transform I-66 Inside the Beltway Project Level Air Quality Analysis 4.5 VDOT Project-Level Air Quality Resource Document As the project is located in an area subject to the federal transportation conformity rule (40 CFR Parts 51 and 93), inter-agency consultation was required by the federal rule (40 CFR (c)(1)) and the corresponding section of the Virginia Regulation for Transportation Conformity (9 VAC Section 70). This consultation was conducted on the models, methods and assumptions specified in the VDOT Project-Level Air Quality Resource Document (see: which were applied in this analysis either directly or without substantive change 11. The Resource Document was created by VDOT to facilitate and streamline the preparation of projectlevel air quality analyses while maintaining high standards for quality. Inter-agency consultation for conformity purposes was conducted on the VDOT Resource Document on December 14 th, Federal, state and local agencies, including the following, were invited to participate as required by the federal and Virginia conformity regulations: FHWA Virginia Division and Resource Center; Virginia Department of Environmental Quality; Virginia Department of Transportation; Virginia Department of Rail and Public Transit; Metropolitan Washington Council of Governments; EPA Region 3; Local agencies All comments received on the VDOT Resource Document in the consultation process were considered as appropriate before the models, methods and assumptions (including data and data sources) and the definition of substantive change as provided in the VDOT Resource Document were finalized. No adverse comments were received. A summary of the consultation process, including a list of all individuals and agencies invited to participate, can be found in Appendix A of the VDOT Resource Document. Due to the high-level of interest from public and stakeholders regarding the I-66 Inside the Beltway project, an interagency consultation meeting/webinar for the project was conducted on February 18 th, An overview was provided of the project improvements, traffic data and modeling, and Resource Document screening criteria. The meeting provided an opportunity for stakeholder review and comment. All comments received in this additional inter-agency consultation were considered as appropriate before the models, methods and assumptions (including data and data sources) for the project analysis were finalized. A summary of the additional or project-specific consultation and results is also provided in Appendix A of this analysis. 11 Note the following definition of substantive change was included in the Resource Document and made the subject of interagency consultation: For project-level air quality analyses conducted to meet conformity requirements and/or for purposes of NEPA, a substantive change is defined here as one that would reasonably be expected to affect the modeling results and/or the analysis to the degree that it would change a finding, determination or conclusion that all applicable requirements for the air quality analysis for the project would be met and the project cleared. For analyses involving project-specific dispersion modeling for any pollutant(s) for conformity purposes, this includes whether the project would pass the applicable conformity test(s). 3/15/2016 Page 11
16 Transform I-66 Inside the Beltway Project Level Air Quality Analysis 5.0 Carbon Monoxide Analysis Carbon monoxide (CO) is a stable gas that disperses in predictable ways in the environment surrounding a project. Computer modeling can be used to assess both existing and expected future concentrations of CO at selected receptor sites in the vicinity of a project. In order to better screen projects for CO, a programmatic agreement for project-level air quality (CO) analyses (Programmatic Agreement) was executed between the FHWA Virginia Division Office and VDOT on February 27, It uses worst-case modeling (defined below) to identify the conditions for which a proposed project or action would require either a quantitative or qualitative CO hot-spot analysis to meet requirements under NEPA. Based on the agreement and applicable federal requirements, the I-66 Inside the Beltway project requires a quantitative CO hot-spot analysis for purposes of both NEPA and conformity for the following reasons: The project is partially located in a CO maintenance area (Arlington County), so conformity requirements for CO project-level analyses currently apply. The project exceeds the technical criteria (i.e., average daily traffic or ADT thresholds) specified in the FHWA-VDOT Programmatic Agreement, which applies for both NEPA and conformity purposes per the protocols established in the VDOT Resource Document which completed inter-agency consultation for conformity in December CO hot-spot analyses can be completed as either screening analyses or refined analyses. Screening analyses are performed using worst-case modeling assumptions for traffic, meteorological conditions and other inputs to generate estimates of the maximum concentrations that may be expected within the project corridor. If under these worst-case assumptions the applicable NAAQS are still met for the project, then it may be reasonably concluded that the actual proposed action will not result in an exceedance of the applicable NAAQS. All worst-case modeling assumptions for this project were taken as specified in or consistent with the VDOT Resource Document, consistent with EPA and FHWA requirements and guidance, and include (but are not limited to): Worst-case traffic volumes that are significantly higher than expected or forecast volumes, which significantly increases the estimated emissions and therefore the expected maximum concentrations in the vicinity of the project. Worst-case receptor locations (points for which ambient concentrations are estimated) selected as locations at which CO concentrations were likely to be highest. o For intersections, receptors were located on the edge of the roadway right of way. o For the interchange, receptors were also located along the edge of the roadway mixing zone, i.e., well inside the roadway right of way. Worst-case roadway configuration for the interchange o A grade separation was applied to represent the interchange, effectively concentrating all of the traffic and emissions in the smallest possible area and resulting in estimates for worst-case concentrations that would be well in excess of those actually expected for the project. The modeling inputs and procedures were developed in accordance with FHWA a n d EPA guidance, including the Guideline for Modeling Carbon Monoxide from Roadway Intersections, Using MOVES2014 in Project-Level Carbon Monoxide Analyses and the VDOT Project-Level Air Quality Resource Document. 3/15/2016 Page 12
17 Transform I-66 Inside the Beltway Project Level Air Quality Analysis 5.1 Overview of Screening Analysis A worst-case screening analysis was applied using the EPA MOVES2014a emission model and CAL3QHC dispersion model. For the latter, which does not have a graphical user interface, the FHWA CAL3i interface was applied to facilitate the analyses. CAL3i 12 provides a convenient and user friendly means of generating input files and executing CAL3QHC, effectively streamlining the dispersion modeling process. CAL3i is an update to CAL3interface 13,14 which was originally released by the FHWA in December Following standard procedure for the screening analysis, CAL3i was run first to estimate project contributions to ambient CO concentrations, without including background concentrations; background CO levels were then added to the modeling results to estimate worst-case CO concentrations at each receptor location. 5.2 Traffic Summary Information The traffic analysis for this project was completed under a separate effort and the results applied for the purposes of this air quality analysis. Traffic forecasts were developed for existing, 2014 baseline conditions, as well as both no-build and build scenarios for the Interim/Opening Year (2017) and the Design Year (2040). The resulting traffic volume forecasts were then used in selecting the intersections to be analyzed. A detailed effort was undertaken as part of the traffic analysis to identify all intersections that were likely significantly impacted by the project. A total of 59 intersections were identified by the traffic team and are shown in Figure 2. These selected intersections served as the starting point for selecting the top three worst-case intersections. The traffic analysis team completed an operations analysis of each intersection using traffic forecasts developed on an intersection by intersection basis and the Synchro simulation package. The delay, level of service and traffic volume for every intersection identified was completed, and the results placed in an Excel table in order to rank the intersections. The ranking processed used for this study process is as specified in EPA guidance 15 : 1. Rank the top 20 intersections by traffic volumes; 2. Calculate the Level-of-Service (LOS) for the top 20 intersections based on traffic volumes; 3. Rank these intersections by LOS; 4. Model the top 3 intersections based on the worst LOS; and 5. Model the top 3 intersections based on the highest traffic volumes. Since many of the worst-case intersections had the same LOS, delay was also incorporated into the ranking. 16 It is assumed that if the selected worst-case intersections do not show an exceedance of the NAAQS, none of the ranked intersections will. This is based on the assumption that these intersections will have the highest CO impacts and that intersections with lower traffic volumes and less congestion will have lower ambient air impacts. Thus, if no exceedances of the CO NAAQS occur for the opening and design years when the results of the intersection modeling are added to the urban area-wide component of the CO concentration at the intersection, then the CO attainment demonstration is complete. 12 CAL3i can be obtained by contacting the FHWA Resource Center: 13 M.Claggett (FHWA), CAL3Interface A Graphical User Interface for the CALINE3 and CAL3QHC Highway Air Quality Models, ca M.Claggett (FHWA), Update of FHWA s CAL3Interface A Graphical User Interface for the CALINE3 and CAL3QHC Highway Air Quality Models, ca Guideline for Modeling Carbon Monoxide from Roadway Intersections, (EPA-454/R , November 1992); available online at: 16 Ibid. 3/15/2016 Page 13
 are shown in Table 2 with the top three worst-case intersections identified as: VA 123 & Lewinsville Road VA 123 & Kirby Road VA 7 & Idylwood Rd Given the traffic volumes")
18 Transform I-66 Inside the Beltway Project Level Air Quality Analysis Figure 2: Intersections Selected for Detailed Operations Analysis The top ten of the 59 intersections as ranked (using the 2040 build scenario results) are shown in Table 2 with the top three worst-case intersections identified as: VA 123 & Lewinsville Road VA 123 & Kirby Road VA 7 & Idylwood Rd Given the traffic volumes through the congested interchange at I-495/I-66, an additional CO screening analysis was conducted for this location. Worst case traffic volumes selected for the screening analysis were consistent with the values in the VDOT Resource Document. Typically the assumed federal worst-case traffic volumes tend to be significantly higher than the modeled volumes. Table 3 below summarizes the refined traffic estimates developed by the project team on I-66, showing the per lane volume to be substantively lower in each scenario. The map presented in Figure 3 showing the physical locations of the locations identified for the CO screening analyses. 3/15/2016 Page 14

19 Transform I-66 Inside the Beltway Project Level Air Quality Analysis Figure 3: Intersections Selected for CO Screening Evaluation 3/15/2016 Page 15
20 Transform I-66 Inside the Beltway Project Level Air Quality Analysis Table 2: PM Peak Hour Volumes, Delay and LOS at Intersections Intersection VA 123 & Lewinsville Road 2014 Existing 2017 No-Build 2017 Build 2040 No-Build 2040 Build Total Total Total Total Delay Delay Delay Delay Delay LOS Entering LOS Entering LOS Entering LOS Entering LOS (Sec/Veh.) (Sec/Veh.) (Sec/Veh.) (Sec/Veh.) (Sec/Veh.) Volume Volume Volume Volume F 7, F 8, F 7, F 8, F 8,360 VA 123 & Kirby Road 72.4 E 5, D D 5, F 6, F 6,470 VA 7 & Idylwood Road US 50 & Graham Road VA 7 & Sleepy Hollow Road/Wilson Boulevard/ US 50 Off- Ramp US 50 & Annandale Road VA 123 & Georgetown Pike Fairfax Drive & N Glebe Road 53.1 D 4, E 4, D 4, E 5, F 6, E 5, F 6, F 5, F 6, F 6, E 4, E 4, E 4, F 5, F 5, D 5, D 5, D 5, F 6, F 6, E 5, E 6, E 5, F 6, F 6, E 4, E 4, E 4, F 4, F 5,390 US 29 & Glebe Road 74.4 E 3, F F 3, F 4, F 4,300 Total Entering Volume US 29 & N Harrison Street 28.3 C 3, C 3, C 3, D 4, E 4,470 3/15/2016 Page 16
21 Transform I-66 Inside the Beltway Project Level Air Quality Analysis Table 3: Comparison of Forecasted Peak Hour Traffic Volumes and Worst-Case Volumes Assumed for CO Screening Analysis CO Screening Values Location Direction % Difference Volume NB 1,786 1,690 2,360 4, % 191% 108% VA 7 & Idylwood SB 2,053 2,010 3,240 4, % 145% 52% Rd EB , % 531% 531% WB , % 547% 486% VA 123 & Lewinsville Rd VA 123 & Kirby Rd I-66/I CO Receptor Locations NB 2,932 2,790 3,470 6, % 120% 77% SB 2,548 2,210 2,460 6, % 178% 150% EB 1, , % 310% 293% WB 1,404 1,530 1,490 3, % 141% 148% NB , % 1195% 392% EB 2,664 2,850 3,410 3,690 39% 29% 8% WB 2,324 2,190 2,560 3,690 59% 68% 44% NB 8,599 12,500 13,114 14,400-19,200 67% 54% 46% SB 10,790 11,413 13,944 14,400-19,200 33% 68% 38% EB 5,325 5,446 10,792 14,400-16, % 209% 56% WB 5,822 6,120 11,573 14,400-16, % 175% 45% Receptor locations (points for which the model generates estimates for ambient concentrations) were selected following FHWA worst-case modeling assumptions and EPA guidance as outlined in the VDOT Resource Document for screening analyses for CO. The selected receptor locations are used to quantify both existing and future maximum CO concentrations throughout the project area. If the peak CO concentrations at the locations selected in the analysis are below the NAAQS for CO, it is assumed that all other locations in the corridor will also remain below the NAAQS. For the worst-case analysis for CO, receptors were automatically placed at the edge of right of way, regardless of whether the public even has access to these locations, which generate the highest possible estimates for concentrations. The receptors are placed 3m from the traveled roadway for intersections and 20 feet from the traveled roadway for freeways 17. For a freeway to freeway interchange, this means that receptors are placed well within the right of way, resulting in significantly higher modeled estimates for peak concentrations than would be obtained in a refined analysis (i.e. not following worst case methodology). A refined analysis of the interchange would be more spread out over a wider geography, with traffic more dispersed over ramps and various lane configurations, distributing and defusing 17 M.Claggett (FHWA), Update of FHWA s CAL3Interface A Graphical User Interface for the CALINE3 and CAL3QHC Highway Air Quality Models, ca /15/2016 Page 17
22 Transform I-66 Inside the Beltway Project Level Air Quality Analysis emissions over a wider area. The worst-case assumption of modeling the interchange as a grade separation effectively assumes all traffic and emissions sources are tightly confined to lanes directly crossing each other, with receptors only 20 feet from the travelled roadway edge instead of outside the actual right of way (i.e., in areas with public access). While these receptor locations are close to the onroad emission sources, they are unlikely to be locations accessible to the public and therefore represent a worst-case assumption significantly in excess of what would be required by EPA or FHWA guidance. Because these assumptions are so conservative and by design intended to yield the highest possible estimates for concentrations, if the worst-case screening analysis still does not show an exceedance of the CO NAAQS despite these assumptions, it can be said with confidence that the actual interchange would not exceed the NAAQS as well. 5.4 Modeling Inputs Key assumptions for CO modeling are consistent with the recommendations found in the VDOT Project- Level Air Quality Resource Document. This information, along with data and assumptions specific to this project, are detailed below: Emission Modeling: MOVES2014a was applied. Inputs into MOVES2014a were consistent with the latest draft version of VDOT Project- Level Air Quality Resource Document. Modeling was done for roadway links in an urban area type. The link inputs to MOVES2014a that affect the calculation of CO emission rates included the road type, speed, and road grade. For this analysis, links on I-495 and I-66 were classified as MOVES road type urban restricted while links on all other roads were classified as urban unrestricted. For the intersections, link grades were developed based on elevation data from GIS files and the National Elevation Dataset provided by USGS. For the interchange only, grades were assumed to be 6% on all approach lanes, the maximum uphill grade present at the interchange. For the departure lanes, a -1% grade was used, the most gradual downhill grade observed. Combined these represent the worst case for emissions modeling and are consistent with prior air quality evaluations at this location. 18 The link source type hour fraction data were developed based on the source hours operating for each source type, using the MWCOG conformity analysis runs provided for Fairfax County. Posted speeds were assumed for all freeway links (55 mph) and the intersection analyses as an approximation for congested speeds. Dispersion Modeling: CAL3QHC was applied using the CAL3i interface. CO background concentration values were those developed by VDEQ based on recent monitoring data. Documentation for local background concentrations and associated persistence factors is included in the VDOT Resource Document. All other defaults were based on the latest version of the VDOT Resource Document. Worst-case traffic volumes of 2,400 vehicles per hour per lane (vphpl) were applied, far exceeding the theoretical capacity on any one approach Traffic volumes in the 18 US Department of Transportation and Virginia Department of Transportation Corridor Improvements Tier 2 Revised Environmental Assessment. January 5, /15/2016 Page 18
23 Transform I-66 Inside the Beltway Project Level Air Quality Analysis screening analysis were from 29% to over 10 times higher than those currently forecasted for the project. Receptors were located on the edge of the roadway right-of-way, following federal guidance for worst-case analyses. All other worst case assumptions were consistent with recommendations included in the VDOT Project-Level Air Quality Resource Document including: o 3 foot median width for freeways o No median width for intersections o 20 foot right of way for freeways o 10 foot right of way for intersections o 2,400 vphpl for each travel lane for freeways o 1,230 vphpl for each travel lane for intersections o Average red cycle length of 68 seconds o Saturation flow rate of 1,900 vphpl An example MOVES input data file applied in the CO analysis is provided in Appendix B. CAL3QHC via the CAL3i interface was used for modeling the CO concentrations at the selected locations. Emission factors derived from MOVES2014a, calculated as discussed above, were included as inputs to the CAL3i model. Worst-case traffic operations and atmospheric conditions were incorporated to predict worst-case CO concentrations. The surface roughness coefficient used in the analysis was based on land use in the project area. In addition, a persistence factor of 0.78 was applied to the 1-hour CO concentrations to project the 8-hour CO concentrations as stipulated in EPA guidance. An example CAL3QHC input and output file are provided in Appendix C, and a complete set of modeling files can be made available upon request. 5.5 No-Build Scenarios Modeling of No-Build scenarios for the project-level air quality analysis for CO is not required for this analysis in keeping with the FHWA-VDOT 2009 Agreement for No-Build Analyses. Per that Agreement, modeling of a No-Build scenario is not required for projects that qualify for an Environmental Assessment (EA). A base year analysis was completed using 2014 emission rates, the number of lanes indicative of the No- Build scenario, and the same assumptions as indicated for the build scenario below. 5.6 Results of CO Screening Analysis Build Scenarios For the base year (2014), the worst-case CO concentrations at the I-66/I-495 interchange of 10.1 ppm (1- hour) and 8.0 (8-hour) are observed at receptor 13. For the project-opening year (2017), the worst-case CO concentrations of 9.8 ppm (1-hour) and 7.8 ppm (8-hour) are observed at receptor 13. For the design year (2040), the worst-case CO concentrations of 4.2 ppm (1-hour) and 3.4 ppm (8-hour) are observed at receptor 13. All of these maximum potential CO concentrations are below the CO NAAQS. Thus, these results demonstrate that, under worst-case conditions, the Build scenario will not cause or contribute to a violation of the CO NAAQS at the worst case interchanges adjacent to the project corridor. The configurations used in the CO analysis can be seen in Appendix D, and all input and output data for the analysis can be made available upon request. As shown in Table 4 the highest CO concentrations are predicted at the interchange. The maximum observed CO concentrations (in ppm) are shown for the existing and Build condition for each year. The summary table also shows the CO NAAQS for the corresponding averaging period. 3/15/2016 Page 19
24 Transform I-66 Inside the Beltway Project Level Air Quality Analysis Table 4: Maximum Potential CO Concentrations (ppm) Location VA 7 & Idylwood Rd VA 123 & Lewinsville Rd VA 123 & Kirby Rd I-495 & I-66 Averaging Period 2014 Existing Build Build NAAQS 1-hour CO hour CO hour CO hour CO hour CO hour CO hour CO hour CO Notes: 1-hour and 8-hour concentrations are shown in parts per million (ppm). 1-hour concentrations were predicted using a background concentration of 1.6 ppm. 8-hour concentrations were calculated by applying a persistence factor of 0.78 to the 1-Hour concentration, and assume a background concentration of 1.4 ppm. For the base year (2014), the maximum potential (worst-case) CO concentrations at an intersection are observed at the VA 123 & Lewinsville Road intersection with a 1-hour CO concentration of 5.6 ppm and an 8-hour CO concentration of 4.5 ppm. This peak occurs at receptor 13. For the project opening year (2017), the worst-case CO concentration at the signalized intersections is observed at the VA 123 & Lewinsville Road intersection with a 1-hour CO concentration of 4.8 ppm and an 8-hour CO concentration of 3.9 ppm. This peak occurs at receptor 13. For the design year (2040), the estimated worst-case CO concentrations are below the base and opening year worst-case concentrations. The analysis of the interchange of I-495 and I-66 represents a much exaggerated screening analysis. While the interchange is spread over a wide area, the screening analysis reduces it to a compact roadway crossing with vehicle emissions similarly constrained and concentrated. Traffic volumes are assumed to be at the roadway capacity, and receptors are located adjacent to the roadway at locations that are actually inaccessible to the public. Despite these extreme assumptions, the screening analysis still shows no exceedance of the CO NAAQS. Given that the actual interchange has lower volumes, is far more spread out and the areas to which the public has access more removed from the roadway edges, it can be confidently stated that, based on this screening analysis, the interchange will not result in a CO exceedance of the NAAQS. 5.7 CO Conclusions Based on a worst-case analysis following EPA and FHWA requirements and guidance, and using modeling inputs from or consistent with the VDOT Resource Document, which completed inter-agency consultation for conformity purposes in December 2015, the maximum CO concentrations modeled for this project are below the CO NAAQS. These results demonstrate that, under worst-case conditions, the Build scenario would not cause or contribute to a violation of the CO NAAQS. 3/15/2016 Page 20
25 Transform I-66 Inside the Beltway Project Level Air Quality Analysis 6.0 Particulate Matter The I-66 Inside the Beltway project is located in Arlington and Fairfax Counties, areas designated as maintenance for the 1997 annual PM 2.5 NAAQS, and as such requires a project-level conformity determination. The VDOT Project-Level Air Quality Resource Document, for which inter-agency consultation for conformity purposes was completed in December 2015, provides guidance and criteria to assist in determining whether a project warrants consideration as a possible project of local air quality concern for PM 2.5. This criteria is detailed in Appendix L of the Resource Document. For more background on inter-agency consultation for conformity conducted for this project, see sections 4.5 and PM Regulations & Overview Quantitative PM 2.5 considerations are a requirement under the Transportation Conformity Requirements of the Clean Air Act (CAA). CAA section 176(c)(1) is the statutory requirement that must be met by all projects in nonattainment and maintenance areas that are subject to transportation conformity. Section 176(c)(1)(B) states that federally-supported transportation projects must not cause or contribute to any new violation of any standard [NAAQS] in any area; increase the frequency or severity of any existing violation of any standard in any area; or delay timely attainment of any standard or any required interim emission reductions or other milestones in any area. Section (b)(1) of the conformity rule defines the projects that require a PM 2.5 or PM 10 hot-spot analysis as: (i) New highway projects that have a significant number of diesel vehicles, and expanded highway projects that have a significant increase in the number of diesel vehicles; (ii) Projects affecting intersections that are at Level-of-Service D, E, or F with a significant number of diesel vehicles, or those that will change to Level-of Service D, E, or F because of increased traffic volumes from a significant number of diesel vehicles related to the project; (iii) New bus and rail terminals and transfer points that have a significant number of diesel vehicles congregating at a single location; (iv) Expanded bus and rail terminals and transfer points that significantly increase the number of diesel vehicles congregating at a single location; and (v) Projects in or affecting locations, areas, or categories of sites which are identified in the PM 2.5 or PM 10 applicable implementation plan or implementation plan submission, as appropriate, as sites of violation or possible violation. Some examples of projects of local air quality concern that would be covered by 40 CFR (b)(1)(i) and (ii) are: A project on a new highway or expressway that serves a significant volume of diesel truck traffic, such as facilities with greater than 125,000 annual average daily traffic (AADT) and 8% or more of such AADT is diesel truck traffic; New exit ramps and other highway facility improvements to connect a highway or expressway to a major freight, bus, or intermodal terminal; Expansion of an existing highway or other facility that affects a congested intersection (operated at Level-of-Service D, E, or F) that has a significant increase in the number of diesel trucks; and, Similar highway projects that involve a significant increase in the number of diesel transit busses and/or diesel trucks. 3/15/2016 Page 21
26 Transform I-66 Inside the Beltway Project Level Air Quality Analysis Some examples of projects of local air quality concern that would be covered by 40 CFR (b)(1)(iii) and (iv) are: A major new bus or intermodal terminal that is considered to be a regionally significant project under 40 CFR ; and, An existing bus or intermodal terminal that has a large vehicle fleet where the number of diesel buses increases by 50% or more, as measured by bus arrivals. It should be noted that the region currently attains the 2006 and 2012 PM 2.5 NAAQS based on monitoring data. 19 With the implementation of the 2012 PM 2.5 NAAQS, USEPA has proposed that the 1997 primary annual standard be revoked, which would eliminate the associated conformity requirements Interagency Consultation and Discussion of Findings As noted previously, the I-66 Inside the Beltway project has garnered both media and public attention. All models, methods and assumptions applied for this assessment were taken from or consistent with those specified in the VDOT Resource Document for which the requisite inter-agency consultation was completed in December 2015 (see section 4.5). In addition, a webinar was held on February 18 th, 2016 specifically for this project. Agencies invited to participate included: FHWA Virginia Division and Resource Center; Virginia Department of Environmental Quality; Virginia Department of Transportation; Virginia Department of Rail and Public Transit; Metropolitan Washington Council of Governments; EPA Region 3; FTA local and regional offices; Fairfax County; and Arlington County Materials distributed to webinar participants and the minutes from the meeting are provided in Appendix A. Traffic forecasts, particularly along I-66 itself, did not indicate a significant growth in truck or diesel bus traffic as a result of the project. Diagrams summarizing the daily traffic on I-66 and at the affected interchanges can be found in Figures 4a and 4b. The absence of significant growth in Average Annual Diesel Truck Traffic (AADTT) in the project area was expected given that I-66 itself is limited to vehicles with no more than 4 tires, making heavy duty diesel trucks effectively banned on the facility itself (outside of violators.) There are no new land uses anticipated that would include congregations of idling trucks or diesel vehicles as a result of the proposed action. There is no specific transit component to the project involving diesel buses either traveling through the corridor, for example a dedicated bus lane, or new congregations of idling buses, such as at a major bus-to-bus transfer facility or a new bus yard. Appendix L of the VDOT Resource Document specifies criteria to determinate whether a proposed project or action is one of potential air quality concern for fine particulate matter (PM 2.5). For proposed improvements to existing highways, the applicable criterion is whether the proposed improvement is 19 Attainment status for any region of the country for all NAAQS can be found on the USEPA Greenbook: 20 See EPA s March 23, 2015 Notice of Proposed Rulemaking (80 FR ) 3/15/2016 Page 22
27 Transform I-66 Inside the Beltway Project Level Air Quality Analysis likely to lead to an increase in AADTT greater than 2,000 vehicles/day. For this project, the forecast changes in traffic volume, even if buses are included in the truck totals, do not attain this 2,000 vehicle/day criterion. This observation holds true in both the opening year of the project (2017) and the design year (2040), years for which traffic forecasts were made available. It can therefore be concluded that this is not a project of local air quality concern for PM 2.5. In summary for the determination that the proposed improvements do not constitute ones of potential air quality concern for fine particulate matter: Mainline capacity increases usable by trucks are not part of the proposed action. Traffic analysis/traffic modeling performed for this project shows no significant (>2,000 VPD) increase in truck traffic on any of the freeway or arterial roadways in the study corridor that are indirectly impacted by the project, and as such the project does not meet the technical criteria specified in the VDOT Resource Document to be specified to be one of air quality concern for fine particulate matter. 21 Finally, additional factors described in the VDOT Air Quality Resource Document also help to support this determination: The area has already achieved the 1997, 2006 and 2012 PM 2.5 NAAQS Background concentrations are well below the 1997 NAAQS ( ppb). 22 EPA has proposed to revoke the 1997 PM 2.5 NAAQS in its implementation of the 2012 standard. This would change the status of the area from Maintenance to Attainment of the standard, eliminating PM 2.5 conformity requirements entirely. 6.3 PM Conclusions Overall the weight of evidence shows that the I-66 Inside the Beltway project is not a project of local air quality concern for PM 2.5. No comments to the contrary were received in inter-agency consultation for conformity purposes for this project. 21 VDOT I-66 Inside the Beltway: Traffic Technical Report Draft January 8, 2016 (Under Review) 22 Monitored data provided by VDEQ 3/15/2016 Page 23

28 Transform I-66 Inside the Beltway Project Level Air Quality Analysis Figure 4a: Traffic Forecasts for I-66 Inside the Beltway 1 of 2 3/15/2016 Page 24

29 Transform I-66 Inside the Beltway Project Level Air Quality Analysis Figure 4b: Traffic Forecasts for I-66 Inside the Beltway 2 of 2 3/15/2016 Page 25
30 Transform I-66 Inside the Beltway Project Level Air Quality 7.0 Mobile Source Air Toxics Analysis In December of 2012, the FHWA issued an interim guidance update regarding the evaluation of MSAT in NEPA analyses and included projections utilizing the EPA MOVES emission model and updated research on air toxic emissions from mobile sources. The guidance includes three categories and criteria for analyzing MSATs in a NEPA documents: 1. No meaningful MSAT effects, 2. Low potential MSAT effects, and 3. High potential MSAT effects. A qualitative analysis is required for projects which meet the low potential MSAT effects criteria while a quantitative analysis is required for projects meeting the high potential MSAT effects criteria. Projects with Low Potential MSAT Effects are described as: Those that serve to improve operations of highway, transit, freight without adding substantial new capacity or without creating a facility that is likely to significantly increase emissions. This category covers a broad range of project types including minor widening projects and new interchanges, such as those that replace a signalized intersection on a surface street or where design year traffic is not projected to meet the 140,000 to 150,000 AADT criteria. Projects with High Potential MSAT Effects must: Create or significantly alter a major intermodal freight facility that has the potential to concentrate high levels of diesel particulate matter in a single location; Create new or add significant capacity to urban highways such as interstates, urban arterials, or urban collector-distributor routes with traffic volumes where the AADT is projected to be in the range of 140,000 to 150,000 or greater by the design year; and Proposed to be located in proximity to populated areas. In accordance with the MSAT guidance, the study area is best characterized as a project with higher potential MSAT effects since projected design year traffic is expected to exceed the 140,000 to 150,000 AADT thresholds. Specifically, the 2040 Build scenario is expected to have AADT volumes on I-66 reach 155,300 AADT just west of the interchange with Route 29, and this traffic is also in proximity to populated areas. Traffic volumes on the Capital Beltway near the interchange with I-66 and on I-66 just west of the Beltway are projected to be even higher with daily volumes as great as 326,000 by 2040 in the Build scenario. The quantitative assessment of MSATs is discussed Section MSAT Background Controlling air toxic emissions became a national priority with the passage of the Clean Air Act Amendments (CAAA) of 1990, when Congress mandated that the EPA regulate 188 air toxics, also known as hazardous air pollutants (HAPs). The EPA assessed this expansive list in their 2007 rule on the Control of Hazardous Air Pollutants from Mobile Sources and identified a group of 93 compounds emitted from mobile sources that are listed in their Integrated Risk Information System (IRIS). In addition, EPA identified seven compounds with significant contributions from mobile sources that are among the national and regional-scale cancer risk drivers from their 1999 National Air Toxics Assessment (NATA). The seven compounds identified were: 1. acrolein; 2. benzene; 3. 1,3 butadiene; 3/15/2016 Page 26
31 Transform I-66 Inside the Beltway Project Level Air Quality 4. diesel particulate matter; 5. formaldehyde; 6. naphthalene; and 7. polycyclic organic matter. While FHWA considers these the priority mobile source air toxics, the list is subject to change and may be adjusted in consideration of future EPA rules. The 2007 EPA rule mentioned above requires controls that will dramatically decrease MSAT emissions through cleaner fuels and cleaner engines. 7.2 Motor Vehicle Emissions Simulator (MOVES) According to EPA, MOVES improves upon the previous MOBILE model in several key aspects. MOVES is based on a vast amount of in-use vehicle data collected and analyzed since the latest release of MOBILE, including millions of emissions measurements from light-duty vehicles. Analysis of this data enhanced EPA s understanding of how mobile sources contribute to emission inventories and the relative effectiveness of various control strategies. In addition, MOVES accounts for the significant effects that vehicle speed and temperature have on PM emission estimates, whereas MOBILE did not. MOVES2010b includes all air toxic pollutants in NATA that are emitted by mobile sources. EPA has incorporated more recent data into MOVES2010b to update and enhance the quality of MSAT emission estimates. These data reflect advanced emission control technology and modern fuels, plus additional data for older technology vehicles. Based on an FHWA analysis using EPA s MOVES2010b model, even if vehicle-miles traveled (VMT) increases by 102 percent as assumed from 2010 to 2050, a combined reduction of 83 percent in the total annual emissions for the priority MSAT is projected for the same time period (see Exhibit A). It should be noted that MOVES2010b does not reflect the impacts of some of the more recent heavy duty vehicle fuel economy standards or fuel standards intended to further reduce emissions. Because of this, application of MOVE2014 (which does include these impacts) would forecast even more dramatic declines. The implications of MOVES on MSAT emissions estimates compared to MOBILE are lower estimates of total MSAT emissions, significantly lower benzene emissions, and significantly higher diesel PM emissions, especially for lower speeds. This reflects the combined impact of more recent vehicle fuel economy standards, vehicle emission standards and fuel formulation not taken into account in MOBILE but fully integrated into MOVES. As a result, diesel PM is projected to be the dominant component of the emissions total. 7.3 MSAT Research Air toxics analysis is a continuing area of research. While much work has been done to assess the overall health risk of air toxics, many questions remain unanswered. In particular, the tools and techniques for assessing project-specific health outcomes as a result of lifetime MSAT exposure remain limited. These limitations impede the ability to evaluate how potential public health risks posed by MSAT exposure should be factored into project-level decision-making within the context of NEPA. Nonetheless, air toxics concerns continue to be raised on highway projects during the NEPA process. Even as the science emerges, we are duly expected by the public and other agencies to address MSAT impacts in our environmental documents. The FHWA, EPA, the Health Effects Institute, and others have funded and conducted research studies to try to more clearly define potential risks from MSAT emissions associated with highway projects. The FHWA continues to monitor the developing research in this field. 3/15/2016 Page 27
32 Transform I-66 Inside the Beltway Project Level Air Quality Exhibit A.: National MSAT Emission Trends for Vehicles Operating on Roadways Using EPA's MOVES 2010b Model Source: EPA MOVES2010b model runs conducted during May-June 2012 by FHWA. Note: Trends for specific locations may be different, depending on locally derived information representing vehiclemiles travelled, vehicle speeds, vehicle mix, fuels, emission control programs, meteorology, and other factors. 3/15/2016 Page 28
33 Transform I-66 Inside the Beltway Project Level Air Quality 7.4 Project Quantitative MSAT Analysis A quantitative MSAT analysis was conducted consistent with the latest guidance developed by FHWA. These include the Interim Guidance Update mentioned earlier, and the FHWA guidance for addressing a quantitative MSAT analysis using MOVES titled Conducting Quantitative MSAT Analysis for FHWA NEPA Documents Frequently Asked Questions, from September The models, methods and assumptions applied in the analysis are also consistent with those specified in the VDOT Resource Document. Based on traffic projections for the analysis years, the segments directly associated with the project and those roadways in the affected network where the Annual Average Daily Traffic (AADT) is expected to change +/- 5% and greater than 50 vehicles for the Build alternative compared to the No-Build alternative were identified. In addition, the roadway segments where the travel time is expected to change +/- 10% for the Build alternative compared to the No-Build alternative were also included. These links were the full affected network which includes the links affected by both the volume and travel time changes can be seen in Figure 5. The following describes the approach and methodology used for conducting the quantitative MSAT analysis: AADT volumes, peak hour volumes and diurnal traffic distribution for I-66 and other roadways in the affected network along with the estimated network speeds for congested periods and for free-flow conditions were obtained from the travel network data files. Speed distributions were based on the congested speeds provided in the Travel Demand Model (TDM) output. Eight time periods were provided with the AM and PM peak traffic each broken into three periods, plus midday and nighttime. The AM peak periods include 5:30 am to 6:30 am, 6:30 am to 9 am, and 9 am to 10 am. The PM peak periods include 3 pm to 4 pm, 4 pm to 6:30 pm, and 6:30 pm to 7:30 pm. The midday period covers 10 am to 3 pm, and the nighttime period covers 7:30 pm to 5:30 am. The developed speed distributions are specific to each evaluation year, scenario, road type, and county. The fractions of vehicle hours of travel within each speed bin were estimated from the vehicle hours of travel and vehicle speeds contained in the traffic demand model output for each link included in the affected network and were apportioned using the MOVES AvgSpeedBin table of bins (i.e., 1 through 16) for each road type and county. The calculated speed distribution representing each time period was then applied to each hour in the time period. For the hours that include two time periods, a weighted average speed distribution was created from the two applicable speed distributions. The road type distributions were based on the functional class of the roadways. Interstates were assigned to MOVES road type category 4 (urban restricted access roadways), while other roads were assigned to MOVES road type category 5 (urban unrestricted access roadways). Road type distributions for each county were developed using the MWCOG distribution of VMT by sourcetype for road types 4 and 5 as well as the total VMT by road type from the TDM network output. The MOVES2014a model was run with local parameters for the four quarters of each analysis year (using January, April, July, and October meteorological and fuel data as surrogates for each quarter). Annual MSAT emissions were then calculated by multiplying the seasonal day emissions by the number of days in the season and summing the resulting emissions from the four seasons. The resulting, existing, interim, and design year emissions for the no-build and build conditions were compared. 3/15/2016 Page 29
34 Transform I-66 Inside the Beltway Project Level Air Quality All inputs for MOVES were consistent with those specified in the VDOT Resource Document. The analysis reflects only running exhaust, crankcase running exhaust, evaporative permeation, and evaporative fuel leaks, in accordance with FHWA guidance. Diesel PM exhaust consists of exhaust PM10 emissions from diesel vehicles only. The polycyclic organic matter (POM) was summarized consistent with the pollutants listed in the FHWA guidance for POM. The results of the quantitative MSAT analysis are presented in Table 5. Table 6 shows the change in emissions between the Build and No-Build scenarios and between the Build and Existing scenarios. These tables show that all of the MSAT emissions are expected to increase slightly for the 2040 Build scenario conditions when compared to the corresponding No-Build conditions, but to decrease slightly from the No-Build to Build conditions in However, when compared to the 2014 Existing conditions, emissions of all pollutants in the Build scenarios for both years show significant decreases. These reductions occur despite projected increases in VMT from 2014 to the 2017 and 2040 Build scenarios of 2 and 20 percent, respectively. In 2040, the increased emissions from the No-Build to the Build scenario are generally consistent with the 6% increase in VMT from the No-Build to the Build scenario. In 2017, the Build scenario shows small reductions in all pollutants as well as VMT from the 2017 No-Build scenario, with all of these reductions around 1%. In all cases, the magnitude of the MSAT emissions is small in the projection years and significantly lower than exists today. Over the 3-year time frame from 2014 to 2017, MSAT emissions are reduced by 37 to 54%, with 1,3-butadiene showing the greatest reduction of 0.18 tpy from the 2014 Existing scenario. By 2040, emissions of all pollutants are further reduced from 2014 levels, and all are under 1 tpy, except diesel PM, with emissions of 1.9 tpy in the 2040 Build scenario. Again in 2040, emissions of 1,3- butadiene show the greatest percentage decrease from 2014 levels, with a 99% reduction to tpy in the 2040 Build scenario. After diesel PM, emissions of formaldehyde and benzene are the greatest in the 2040 Build scenario, at 0.9 and 0.5 tpy, respectively. Due to the small magnitude of projected MSAT emissions, the increases observed in 2040 from the No-Build to the Build scenario are not considered significant, especially when considering that emissions from all MSAT are expected to be significantly lower in future years than exist today. Overall, the results of the MSAT analysis are consistent with the national MSAT emission trends predicted by MOVES and indicate that no meaningful increases in MSATs have been identified and are not expected to cause an adverse effect on human health as a result of the I-66 Build scenario in future years, and may even be reduced in the short term (i.e., 2017). 3/15/2016 Page 30
 Existing No-Build Build No Build Build 1,3 Butadiene 0.39 0.180 0.178 0.003 0.003 Acrolein 0.27 0.164 0.161 0.039 0.041 Benzene 3.62 1.964 1.942 0.500 0.530 Diesel PM 22.86 13.741 13.560 1.")
35 Transform I-66 Inside the Beltway Project Level Air Quality Figure 5: 2040 Affected Roadway Network Table 5: Annual MSAT Emissions by Year, Scenario and Pollutant Pollutant 2014 (tpy) 2017 (tpy) 2040 (tpy) Existing No-Build Build No Build Build 1,3 Butadiene Acrolein Benzene Diesel PM Formaldehyde Naphthalene Polycyclic Organic Matter VMT (million annual vehicle-miles) 1,232 1,269 1,262 1,391 1,477 3/15/2015 Page 31
36 Transform I-66 Inside the Beltway Project Level Air Quality Table 6: Change in Annual MSAT Emissions by Year, Scenario and Pollutant from No-Build and from Existing Emissions Pollutant Change from No-Build Change from Existing 2017 Build 2040 Build 2017 Build 2040 Build TPY % TPY % TPY % TPY % 1,3 Butadiene % % % % Acrolein % % % % Benzene % % % % Diesel PM % % % % Formaldehyde % % % % Naphthalene % % % % Polycyclic Organic Matter % % % % VMT (million annual vehicle-miles) % % % % 7.5: Incomplete or Unavailable Information for Project-Specific MSAT Health Impacts Analysis In FHWA's view, information is incomplete or unavailable to credibly predict the project-specific health impacts due to changes in MSAT emissions associated with a proposed set of highway alternatives. The outcome of such an assessment, adverse or not, would be influenced more by the uncertainty introduced into the process through assumption and speculation rather than any genuine insight into the actual health impacts directly attributable to MSAT exposure associated with a proposed action. The EPA is responsible for protecting the public health and welfare from any known or anticipated effect of an air pollutant. They are the lead authority for administering the CAA and its amendments and have specific statutory obligations with respect to hazardous air pollutants and MSAT. The EPA is in the continual process of assessing human health effects, exposures, and risks posed by air pollutants. They maintain the Integrated Risk Information System (IRIS), which is "a compilation of electronic reports on specific substances found in the environment and their potential to cause human health effects" (EPA, Each report contains assessments of non-cancerous and cancerous effects for individual compounds and quantitative estimates of risk levels from lifetime oral and inhalation exposures with uncertainty spanning perhaps an order of magnitude. Other organizations are also active in the research and analyses of the human health effects of MSAT, including the Health Effects Institute (HEI). Two HEI studies are summarized in Appendix D of FHWA's Interim Guidance Update on Mobile Source Air Toxic Analysis in NEPA Documents. Among the adverse health effects linked to MSAT compounds at high exposures are cancer in humans in occupational settings, cancer in animals, and irritation to the respiratory tract, including the exacerbation of asthma. Less obvious is the adverse human health effects of MSAT compounds at current environmental concentrations (HEI, or in the future as vehicle emissions substantially decrease (HEI, The methodologies for forecasting health impacts include emissions modeling, dispersion modeling, exposure modeling, and then final determination of health impacts, with each step in the process building on the model predictions obtained in the previous step. All are encumbered by technical shortcomings or 3/15/2015 Page 32
37 Transform I-66 Inside the Beltway Project Level Air Quality uncertain science that prevents a more complete differentiation of the MSAT health impacts among a set of project alternatives. These difficulties are magnified for lifetime (i.e. 70 year) assessments, particularly because unsupportable assumptions would have to be made regarding changes in travel patterns and vehicle technology (which affects emissions rates) over that time frame, since such information is unavailable. It is particularly difficult to reliably forecast 70-year lifetime MSAT concentrations and exposure near roadways to (1) determine the portion of time that people are actually exposed at a specific location; and (2) establish the extent attributable to a proposed action especially given that some of the information needed is unavailable. There are considerable uncertainties associated with the existing estimates of toxicity of the various MSAT, because of factors such as low-dose extrapolation and translation of occupational exposure data to the general population, a concern expressed by HEI ( As a result, there is no national consensus on air dose-response values assumed to protect the public health and welfare for MSAT compounds, and in particular for diesel PM. The EPA ( and the HEI ( have not established a basis for quantitative risk assessment of diesel PM in ambient settings. There is also the lack of a national consensus on an acceptable level of risk. The current context is the process used by the EPA as provided by the CAA to determine whether more stringent controls are required in order to provide an ample margin of safety to protect public health or to prevent an adverse environmental effect for industrial sources subject to the maximum achievable control technology standards, such as benzene emissions from refineries. The decision framework is a two-step process. The first step requires EPA to determine an "acceptable" level of risk due to emissions from a source, which is generally no greater than approximately 100 in a million. Additional factors are considered in the second step, the goal of which is to maximize the number of people with risks less than 1 in a million due to emissions from a source. The results of this statutory two-step process do not guarantee that cancer risks from exposure to air toxics are less than 1 in a million; in some cases, the residual risk determination could result in maximum individual cancer risks that are as high as approximately 100 in a million. In a June 2008 decision, the U.S. Court of Appeals for the District of Columbia Circuit upheld EPA's approach to addressing risk in its two step decision framework. Information is incomplete or unavailable to establish that even the largest of highway projects would result in levels of risk greater than deemed acceptable. Because of the limitations in the methodologies for forecasting health impacts described, any predicted difference in health impacts between alternatives is likely to be much smaller than the uncertainties associated with predicting the impacts. Consequently, the results of such assessments would not be useful to decision makers, who would need to weigh this information against project benefits, such as reducing traffic congestion, accident rates, and fatalities, in addition to improved access for emergency response, that are better suited for a quantitative analysis. 7.6 MSAT Conclusions The understanding of mobile source air toxics is an area of continued study. Information is currently incomplete or unavailable to credibly predict the project-specific health impacts due to changes in MSAT emissions associated with each of the project scenarios. Emissions of all MSAT pollutants were projected to decrease from the No-Build to the Build scenario in 2017, but increase slightly from the No-Build to the Build scenario in 2040, although these increases are not considered to be significant. However, when 3/15/2015 Page 33
38 Transform I-66 Inside the Beltway Project Level Air Quality compared to existing conditions, emissions of all MSAT pollutants under the 2017 and 2040 Build scenarios are projected to be significantly lower than exist today. EPA's vehicle and fuel regulations are expected to result in significantly lower MSAT levels in the future than exist today due to cleaner engine standards coupled with fleet turnover. The magnitude of the EPAprojected reductions is so great (even after accounting for VMT growth) that MSAT emissions in the study area will be significantly lower in the future than they are today, regardless of the scenario chosen. 8.0 Construction Emission Analysis The temporary air quality impacts from construction are not expected to be significant. Emissions will be produced during the construction of this project by heavy equipment and vehicle travel to and from the site. Earthmoving and ground-disturbing operations will generate airborne dust. Construction emissions are short term or temporary in nature. In order to mitigate these emissions, all construction activities are to be performed in accordance with VDOT s current Road and Bridge Specifications. These Specifications require compliance with all applicable local, state, and federal regulations. This project is located within a Marginal 8-hour Ozone Nonattainment area, a PM 2.5 Maintenance area, a CO Maintenance Area, and a volatile organic compounds (VOC) and nitrogen oxides (NO X) Emissions Control Area. As such, all reasonable precautions should be taken to limit the emissions of VOC, NOx, and particulate matter. In addition, the following VDEQ air pollution regulations must be adhered to during the construction of this project: 9 VAC 5-130, Open Burning restrictions; 9 VAC 5-45, Article 7, Cutback Asphalt restrictions; and 9 VAC 5-50, Article 1, Fugitive Dust precautions. 9.0 Regional Conformity Status of the Project This project has already been evaluated in relation to regional air quality concerns. The Clean Air Act Amendments (CAAA) of 1990 mandate improvements to the nation s air quality. The final conformity regulations promulgated by the US EPA in 1997, as part of 40 CFR Part 93, require transportation plans and programs conform to the SIP. The final conformity rule requires that transportation plans in ozone nonattainment areas be consistent with the most recent estimates of mobile source emissions; provide for the expeditious implementation of transportation control measures in the applicable implementation plan; and contribute to annual emission reductions in ozone and carbon monoxide nonattainment areas. The project is located in the Arlington and Fairfax Counties. Based on the CAA and most recent EPA classifications, this area has been designated as an attainment/maintenance area for the 1997 annual PM 2.5 NAAQS. This area is also subject to regional conformity requirements due to marginal nonattainment of the hour ozone NAAQS. The Metropolitan Washington Council of Governments Amended 2015 Transportation Plan for the National Capital Region of the 2015 Constrained Long Range Plan Amendment and Fiscal Year Transportation Improvement Plan, Air Quality Conformity Analysis 23 was released on October 21, 2015 and includes the transportation impact of the proposed action. As such the project-level regional conformity requirements have already been demonstrated for this project /15/2015 Page 34
39 Transform I-66 Inside the Beltway Project Level Air Quality 10.0 Indirect and Cumulative Effects Effects of the project that would occur at a later date or are fairly distant from the project are referred to as indirect effects. Cumulative impacts are those effects that result from the incremental impact of the action when added to other past, present and reasonably foreseeable future actions. Cumulative impacts are inclusive of the indirect effects. The potential for indirect effects or cumulative impacts to air quality that may be attributable to this project is not expected to be significant for a couple of reasons. First, regarding indirect effects, the quantitative assessments conducted for project-specific CO and MSAT impacts and the regional conformity analysis conducted for ozone can all be considered indirect effects analyses because they look at air quality impacts attributable to the project that occur at a later time in the future. These analyses demonstrated that in the future, 1) air quality impacts from CO will not cause or contribute to violations of the CO NAAQS; 2) MSAT emissions from the affected network will be significantly lower than they are today; and 3) ozone attributable to this and all other projects In the region will not exceed the mobile source emissions budgets established for the region. Second, regarding the potential for cumulative impacts, the annual conformity analysis conducted by the Transportation Planning Board (MPO for the Washington, D.C. metropolitan nonattainment/maintenance area) represents a cumulative impact assessment for purposes of regional air quality. Federal conformity requirements, including specifically 40 CFR and 40 CFR , apply as the area in which the project is located is designated as nonattainment for ozone and maintenance for fine particulate matter. Accordingly, there must be a currently conforming transportation plan and program at the time of project approval, and the project must come from a conforming plan and program (or otherwise meet criteria specified in 40 CFR (b)). o The existing air quality designations for the region are based, in part, on the accumulated mobile source emissions from past and present actions, and these pollutants serve as a baseline for the current conformity analysis. o The conformity analysis quantifies the amount of mobile source emissions for which the area is designated nonattainment/maintenance that will result from the implementation of all reasonably foreseeable (i.e. those proposed for construction funding over the life of the region s transportation plan) regionally significant transportation projects in the region. o The most recent conformity analysis was completed in October 2015, with FHWA and FTA issuing a conformity finding on February 4, 2016 for the TIP and CLRP covered by that analysis. This analysis demonstrated that the incremental impact of the proposed project on mobile source emissions, when added to the emissions from other past, present, and reasonably foreseeable future actions, is in conformance with the SIP and will not cause or contribute to a new violation, increase the frequency or severity of any violation, or delay timely attainment of the NAAQS established by EPA. Therefore, the indirect and cumulative effects of the project are not expected to be significant. 3/15/2015 Page 35
40 Transform I-66 Inside the Beltway Project Level Air Quality 11.0 Conclusions In order to meet NEPA and conformity requirements 24, a quantitative CO hot-spot screening analysis was performed for the I-66 Inside the Beltway project. A CO screening analysis was performed using worstcase traffic and meteorological inputs to identify the resulting worst-case CO concentrations throughout the project corridor in order to determine if CO exceedances could occur as a result of the proposed improvements. The results of the analysis show that the worst-case CO concentrations for the Build scenarios are predicted to be well below the CO NAAQS in both the Interim/Opening Year Build (2017) and Design Year Build (2040) scenarios for each of the worst-case locations analyzed along the proposed project corridor. This screening analysis included the three worst-case signalized intersections and the worst-case interchange. Therefore, it is reasonably expected that all other locations within the project corridor will also remain well below the CO NAAQS and no mitigation measures are required. Additionally, Arlington and Fairfax Counties have been designated as being non-attainment for the 8- hour ozone and attainment/maintenance for the annual PM 2.5 standards, and therefore transportation conformity requirements apply. Following EPA regulations and guidance, and using the technical criterion specified in the VDOT Resource Document for which inter-agency consultation for conformity was completed in December 2015, the project was determined to not be one of air quality concern for PM 2.5. Notwithstanding that inter-agency consultation for conformity on the VDOT Resource Document, on which the models, methods and assumptions were based, was completed in December 2015, inter-agency was conducted for this project in February No adverse comments were received. The study Build scenarios were also evaluated for MSAT impacts following the latest FHWA guidance. This project was identified as one with High Potential MSAT Effects; therefore, a quantitative MSAT analysis was conducted consistent with the guidance. Emissions of all MSAT pollutants were projected to decrease slightly from the No-Build to the Build scenarios in 2017 and increase slightly in 2040, although these changes are small and not considered to be significant. However, when compared to existing conditions, emissions of all MSAT pollutants under the 2017 and 2040 Build scenarios are projected to be significantly lower than exist today. EPA's vehicle and fuel regulations are expected to result in significantly lower MSAT levels in the future than exist today due to cleaner engine standards coupled with fleet turnover. The quantitative MSAT analysis demonstrated that there would be no longterm adverse impacts associated with the Build scenario, and that future MSAT emissions across the entire study corridor are expected to be significantly below today s levels, even after accounting for projected VMT growth. 24 Which expire for CO effective March 16, 2016 with the conclusion of the maintenance status for Arlington County for CO. 3/15/2015 Page 36
41 Appendix A: Interagency Consultation Webinar Presentation and Meeting Minutes
42

43
44
45
46
47
48
49
50
51
52
53
54
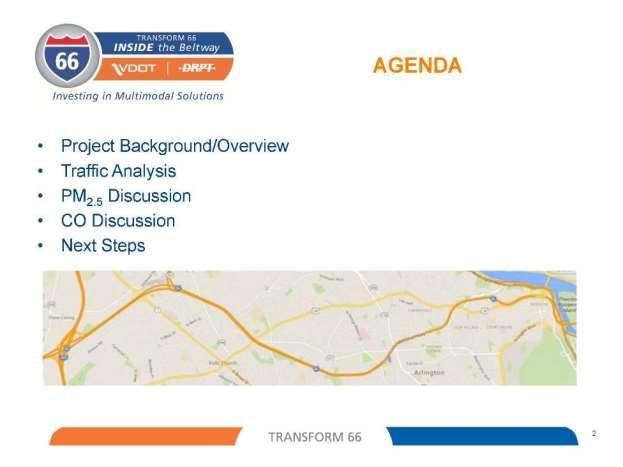
55
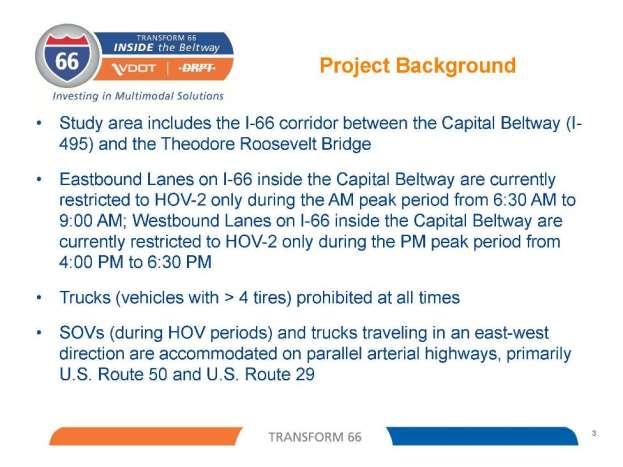
56
57
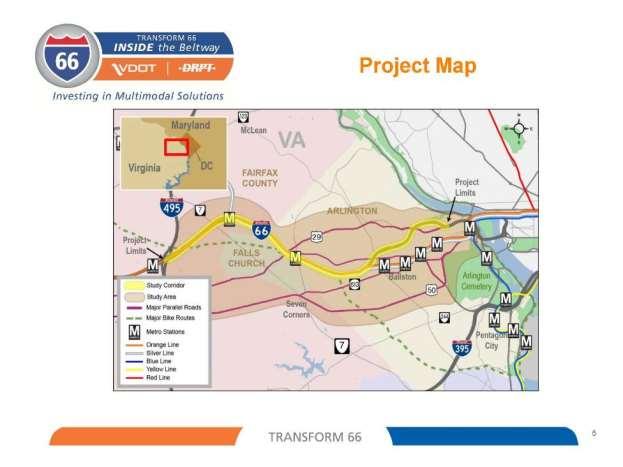
58
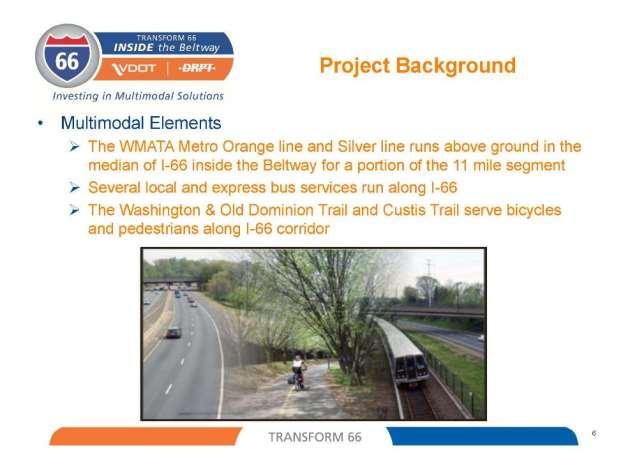
59
60
61
62
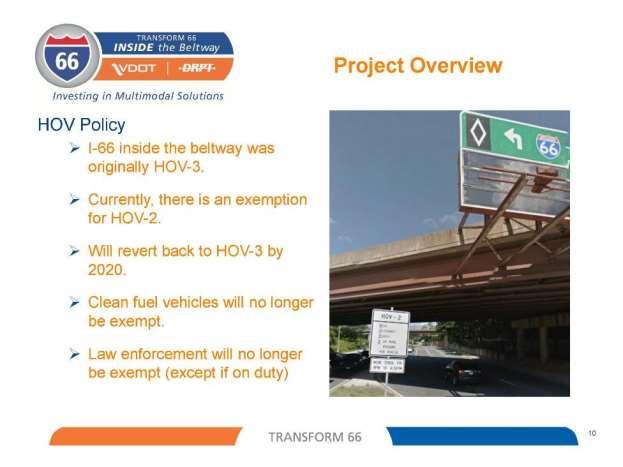
63
64
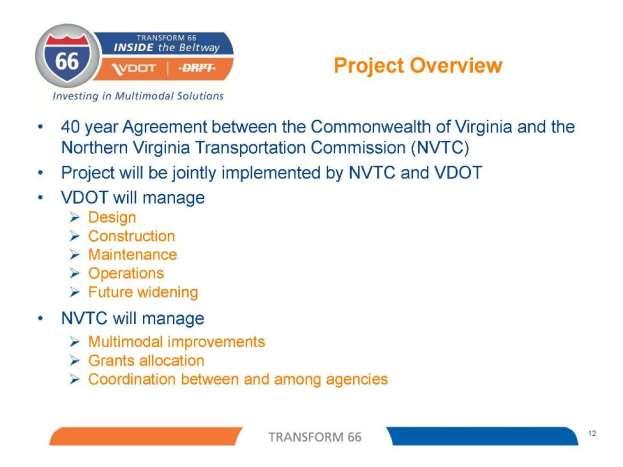
65
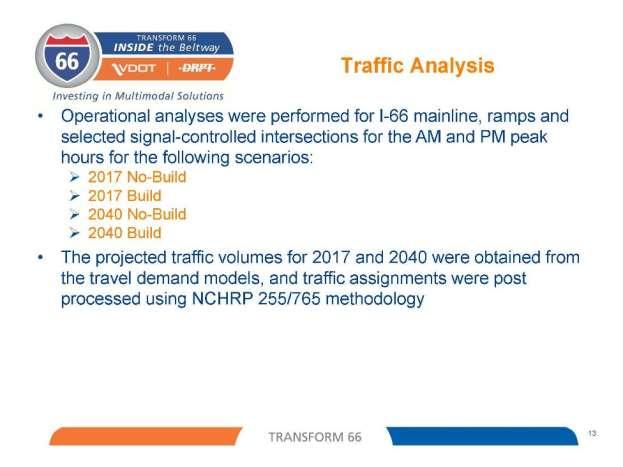
66
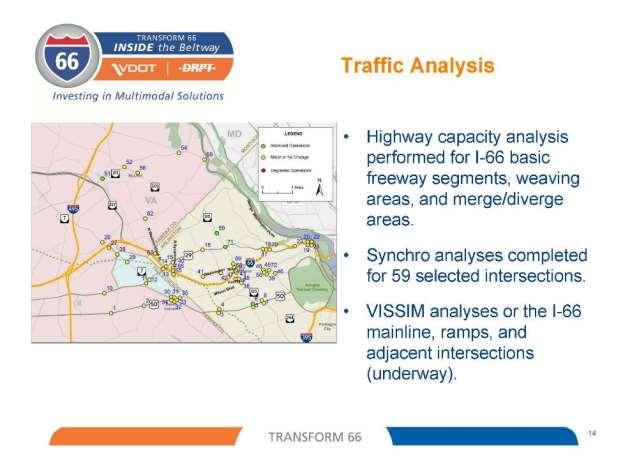
67
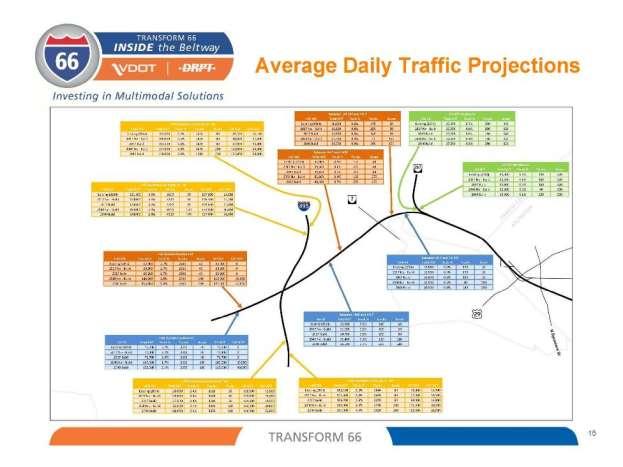
68
69
70
71
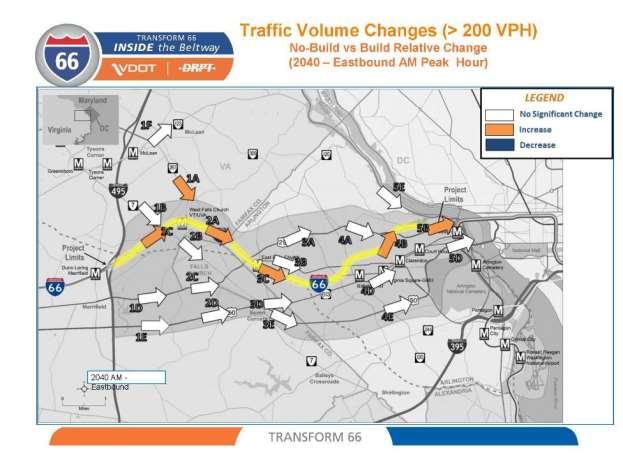
72

73
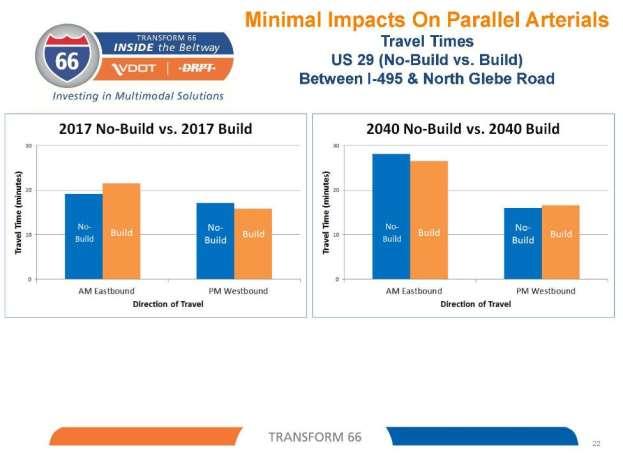
74
75
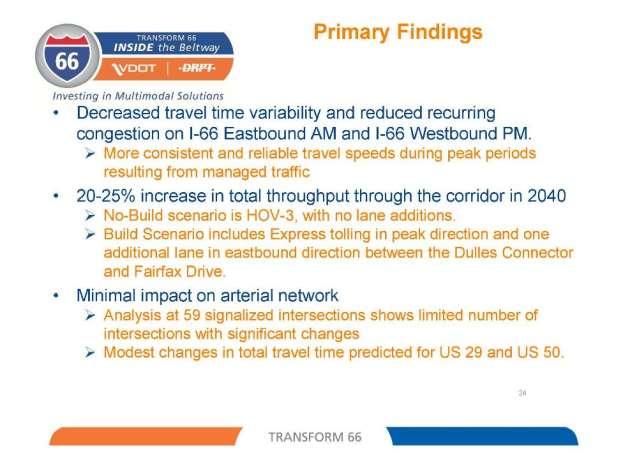
76

77
78
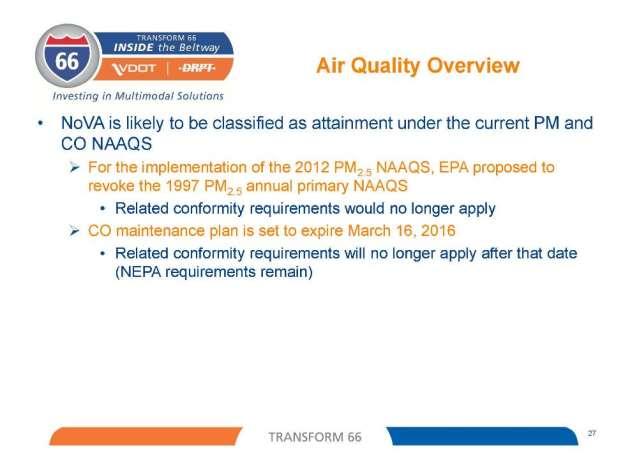
79

80
81

82
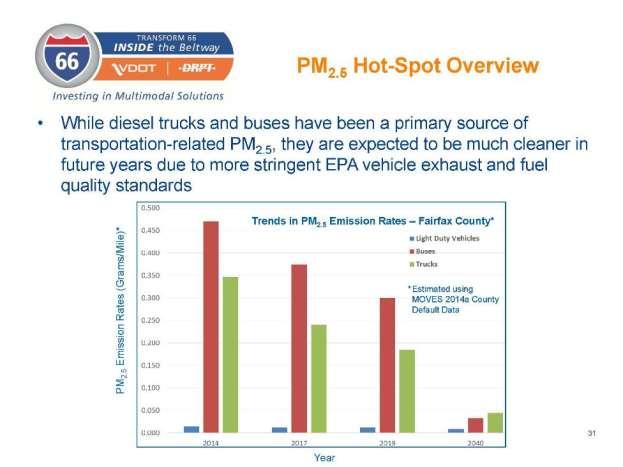
83
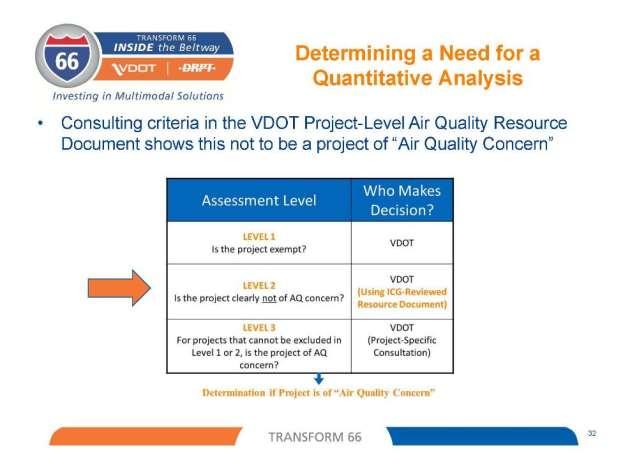
84
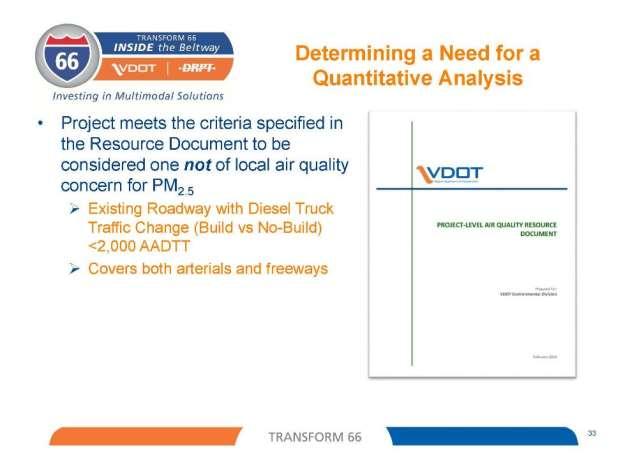
85
86
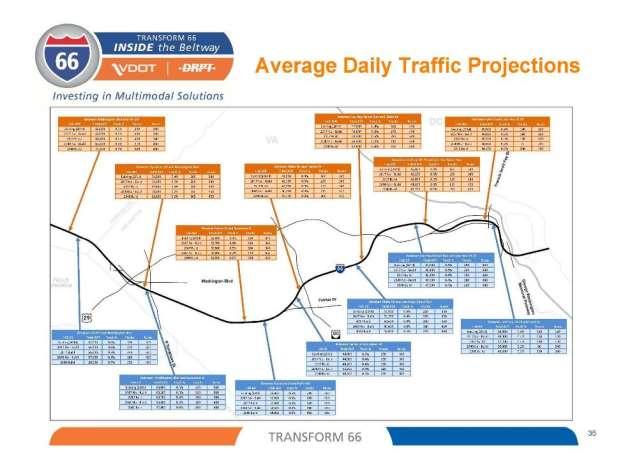
87
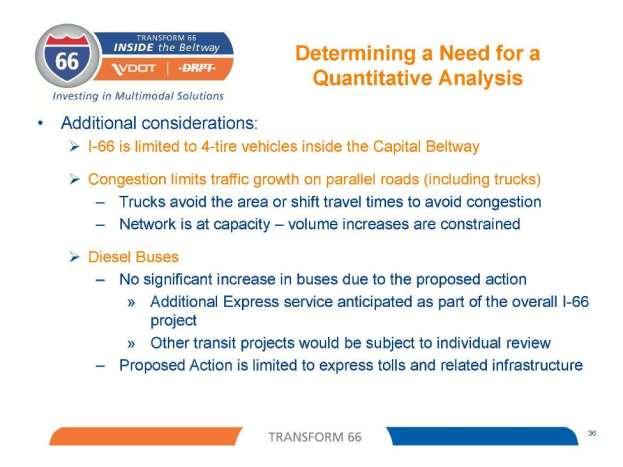
88

89
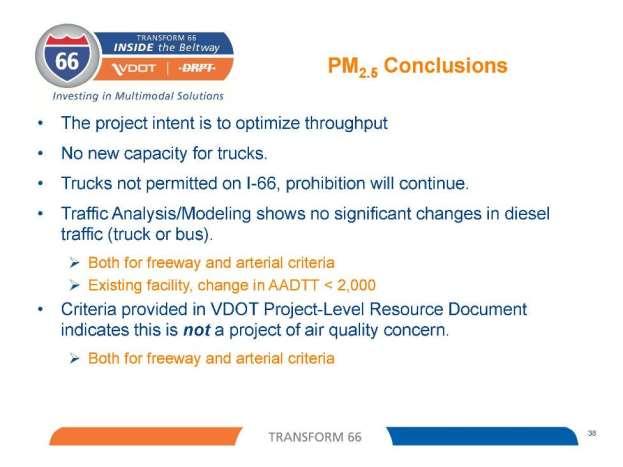
90
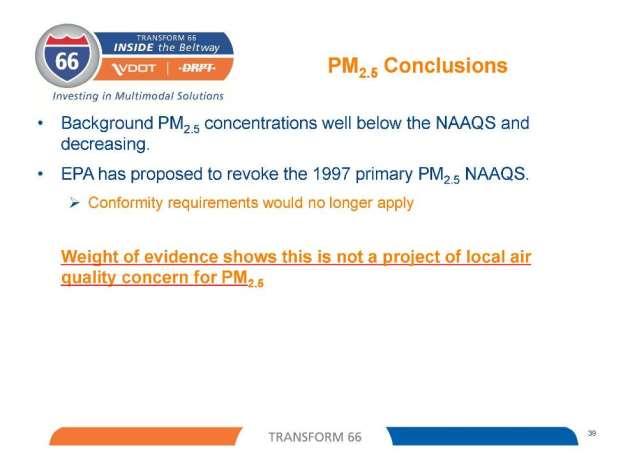
91
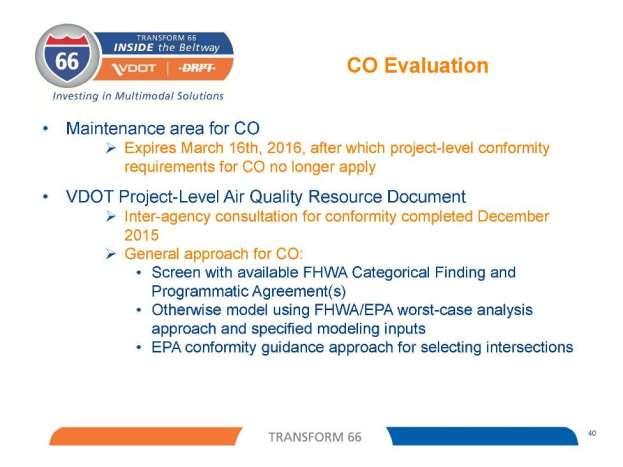
92
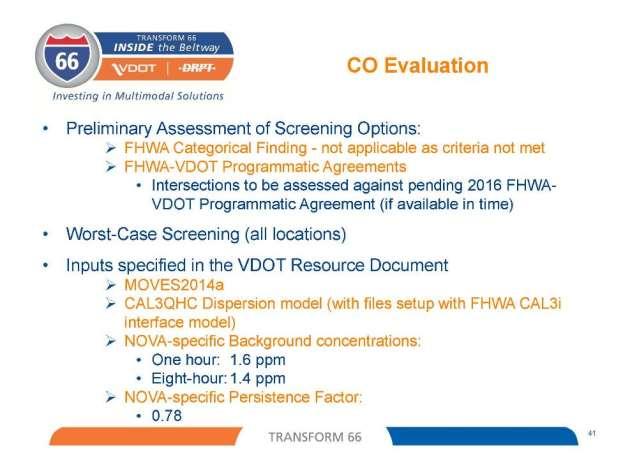
93
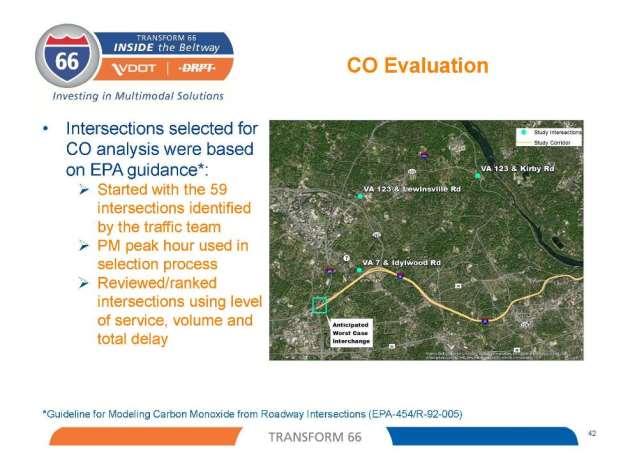
94
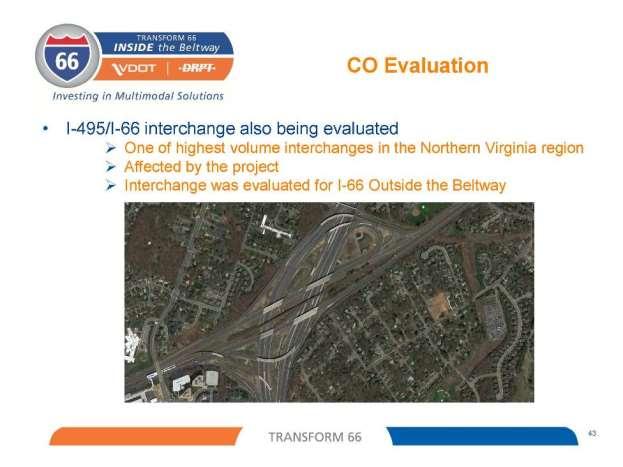
95
96
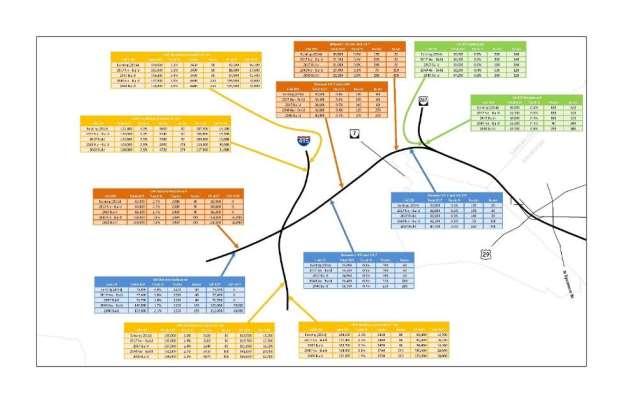
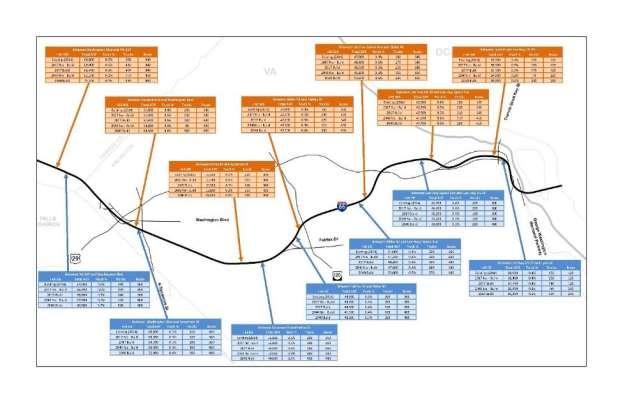
97
98 Appendix B: Memorandum on CO Background Concentration for Project-Level Air Quality Modeling
99
100
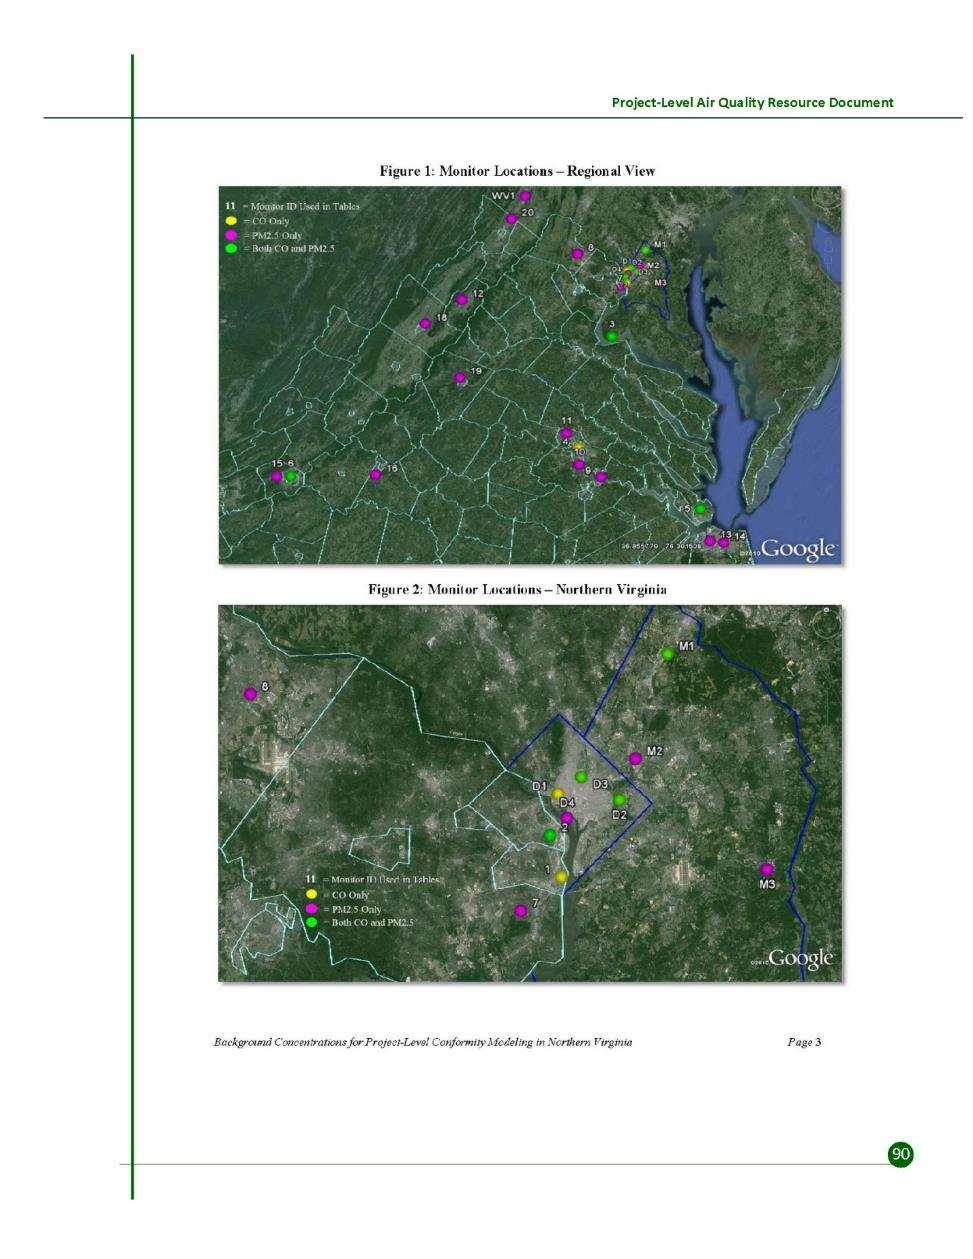
101
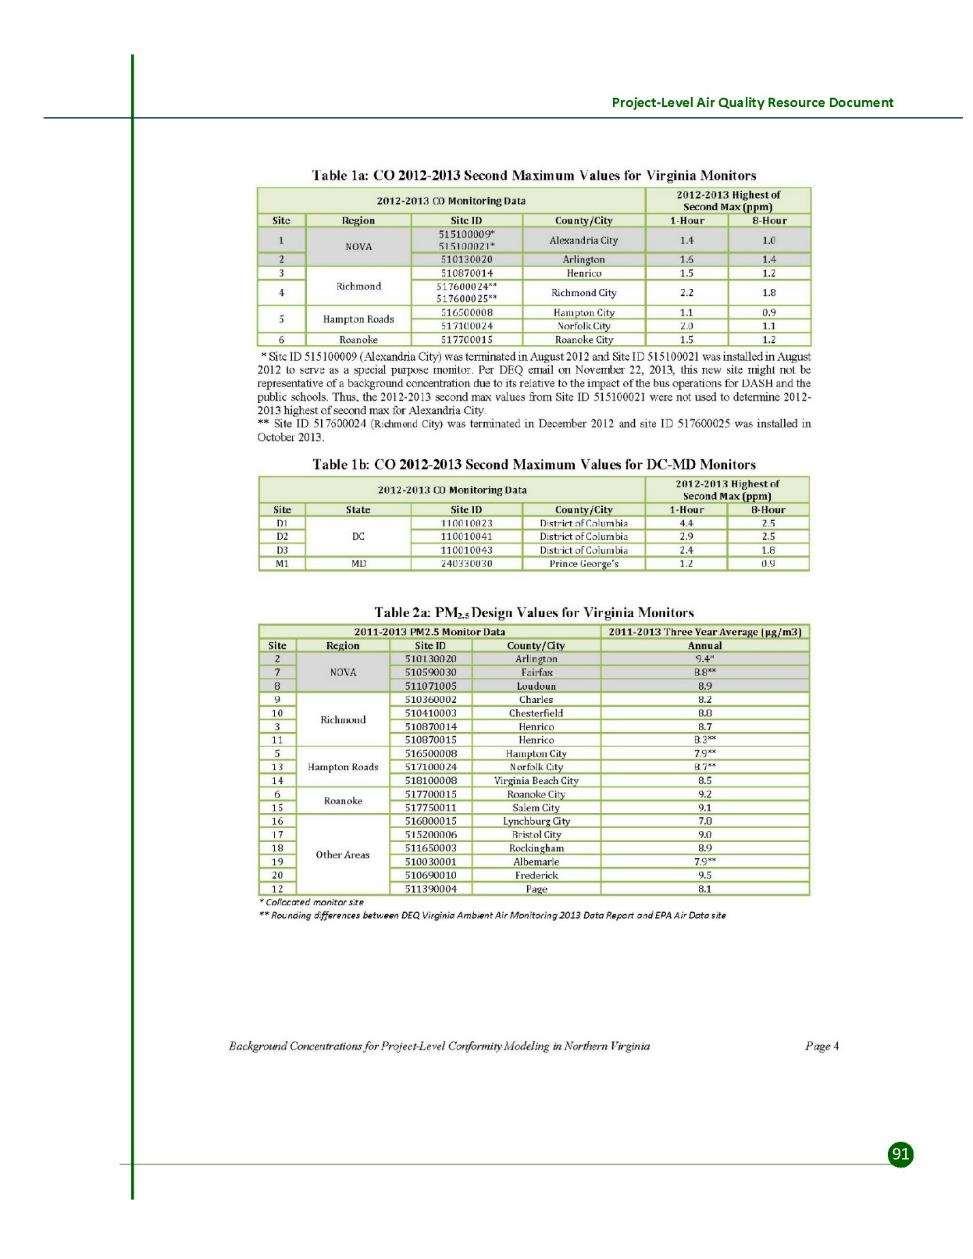
102
103
104
105 Appendix C: Sample CAL3QHC Input/Output Files
106 INPUT - VA 123 & Lewinsville Rd Q,EPA,,T,T,F,T 5,5,3,3,2200,2200,2200,2200,2200,2200,2200,2200,1230,1230,1230,1230,1230,1 230,1230,1230,12,12,12,12,10,10,10,10,0,0,-1200,1200,0,0,1200,-1200,- 1200,1200,0,0,1200,- 1200,0,0,0,0,0,0,0,0,0,0,2.6,7.1,4.3,5.1,16.7,16.7,16.7, ,120,120,120,68,68,68,68,2,2,2,2,1900,1900,1900,1900,1,1,1,1,3,3,3,3 'I-66 ITB 2014',60,108,0.0,0.0,28,0.3048,1,0 'N Leg, E Side-Corner',70.0,46.0,5.9 'N Leg, E Side - 25 m',70.0,118.0,5.9 'N Leg, E Side - 50 m',70.0,200.0,5.9 'N Leg, E Side-Midblk',70.0,636.0,5.9 'N Leg, W Side-Corner',-70.0,46.0,5.9 'N Leg, W Side - 25 m',-70.0,118.0,5.9 'N Leg, W Side - 50 m',-70.0,200.0,5.9 'N Leg, W Side-Midblk',-70.0,636.0,5.9 'S Leg, E Side-Corner',70.0,-46.0,5.9 'S Leg, E Side - 25 m',70.0,-118.0,5.9 'S Leg, E Side - 50 m',70.0,-200.0,5.9 'S Leg, E Side-Midblk',70.0,-636.0,5.9 'S Leg, W Side-Corner',-70.0,-46.0,5.9 'S Leg, W Side - 25 m',-70.0,-118.0,5.9 'S Leg, W Side - 50 m',-70.0,-200.0,5.9 'S Leg, W Side-Midblk',-70.0,-636.0,5.9 'E Leg, N Side - 25 m',142.0,46.0,5.9 'E Leg, N Side - 50 m',224.0,46.0,5.9 'E Leg, N Side-Midblk',660.0,46.0,5.9 'W Leg, N Side - 25 m',-142.0,46.0,5.9 'W Leg, N Side - 50 m',-224.0,46.0,5.9 'W Leg, N Side-Midblk',-660.0,46.0,5.9 'E Leg, S Side - 25 m',142.0,-46.0,5.9 'E Leg, S Side - 50 m',224.0,-46.0,5.9 'E Leg, S Side-Midblk',660.0,-46.0,5.9 'W Leg, S Side - 25 m',-142.0,-46.0,5.9 'W Leg, S Side - 50 m',-224.0,-46.0,5.9 'W Leg, S Side-Midblk',-660.0,-46.0,5.9 'Rte 123 & Lewinsville Road',12,1,0,'CO' 1 'N Leg App - FreeFlow','AG',-30,0,-30,1200,6150,7.1,0.0, 'N Leg App - Queue','AG',-30,36,-30,1200,0.0,60.0,5 120,68,2,6150,16.7,1900,1,3 1 'N Leg Dep - FreeFlow','AG',30,0,30,1200,6150,2.6,0.0, 'S Leg App - FreeFlow','AG',30,0,30,-1200,6150,2.6,0.0, 'S Leg App - Queue','AG',30,-36,30,-1200,0.0,60.0,5 120,68,2,6150,16.7,1900,1,3 1 'S Leg Dep - FreeFlow','AG',-30,0,-30,-1200,6150,7.1,0.0, 'E Leg App - FreeFlow','AG',0,18,1200,18,3690,5.1,0.0,55.7
107 2 'E Leg App - Queue','AG',60,18,1200,18,0.0,36.0,3 120,68,2,3690,16.7,1900,1,3 1 'E Leg Dep - FreeFlow','AG',0,-18,1200,-18,3690,4.3,0.0, 'W Leg App - FreeFlow','AG',0,-18,-1200,-18,3690,4.3,0.0, 'W Leg App - Queue','AG',-60,-18,-1200,-18,0.0,36.0,3 120,68,2,3690,16.7,1900,1,3 1 'W Leg Dep - FreeFlow','AG',0,18,-1200,18,3690,5.1,0.0, ,0,4,1000,0.0,'Y',10,1,36
108 OUTPUT - VA 123 & Lewinsville Rd CAL3QHC: LINE SOURCE DISPERSION MODEL - VERSION 2.0 Dated PAGE 1 JOB: I-66 ITB & Lewinsville Road RUN: Rte DATE : 2/25/16 TIME : 16:54:16 The MODE flag has been set for calculating concentrations for POLLUTANT: CO SITE & METEOROLOGICAL VARIABLES VS = 0.0 CM/S VD = 0.0 CM/S Z0 = 108. CM U = 1.0 M/S CLAS = 4 (D) ATIM = 60. MINUTES MIXH = M AMB = 0.0 PPM LINK VARIABLES LINK DESCRIPTION * LINK COORDINATES (FT) * LENGTH BRG TYPE VPH EF H W V/C QUEUE * X1 Y1 X2 Y2 * (FT) (DEG) (G/MI) (FT) (FT) (VEH) * * N Leg App - FreeFlow* * AG N Leg App - Queue * * AG N Leg Dep - FreeFlow* * AG S Leg App - FreeFlow* * AG S Leg App - Queue * * AG S Leg Dep - FreeFlow* * AG E Leg App - FreeFlow* * AG E Leg App - Queue * * AG E Leg Dep - FreeFlow* * AG W Leg App - FreeFlow* * AG W Leg App - Queue * * AG W Leg Dep - FreeFlow* * AG
109 PAGE 2 JOB: I-66 ITB & Lewinsville Road RUN: Rte DATE : 2/25/16 TIME : 16:54:16 ADDITIONAL QUEUE LINK PARAMETERS LINK DESCRIPTION * CYCLE RED CLEARANCE APPROACH SATURATION IDLE SIGNAL ARRIVAL * LENGTH TIME LOST TIME VOL FLOW RATE EM FAC TYPE RATE * (SEC) (SEC) (SEC) (VPH) (VPH) (gm/hr) * N Leg App - Queue * S Leg App - Queue * E Leg App - Queue * W Leg App - Queue * RECEPTOR LOCATIONS * COORDINATES (FT) * RECEPTOR * X Y Z * * * 1. N Leg, E Side-Corner * * 2. N Leg, E Side - 25 m * * 3. N Leg, E Side - 50 m * * 4. N Leg, E Side-Midblk * * 5. N Leg, W Side-Corner * * 6. N Leg, W Side - 25 m * * 7. N Leg, W Side - 50 m * * 8. N Leg, W Side-Midblk * * 9. S Leg, E Side-Corner * * 10. S Leg, E Side - 25 m * * 11. S Leg, E Side - 50 m * * 12. S Leg, E Side-Midblk * * 13. S Leg, W Side-Corner * * 14. S Leg, W Side - 25 m * * 15. S Leg, W Side - 50 m * * 16. S Leg, W Side-Midblk * * 17. E Leg, N Side - 25 m * * 18. E Leg, N Side - 50 m * * 19. E Leg, N Side-Midblk * * 20. W Leg, N Side - 25 m * * 21. W Leg, N Side - 50 m * * 22. W Leg, N Side-Midblk * *
110 23. E Leg, S Side - 25 m * * 24. E Leg, S Side - 50 m * * 25. E Leg, S Side-Midblk * * 26. W Leg, S Side - 25 m * * 27. W Leg, S Side - 50 m * * 28. W Leg, S Side-Midblk * *
111 PAGE 3 JOB: I-66 ITB & Lewinsville Road RUN: Rte MODEL RESULTS REMARKS : In search of the angle corresponding to the maximum concentration, only the first angle, of the angles with same maximum concentrations, is indicated as maximum. WIND ANGLE RANGE: WIND * CONCENTRATION ANGLE * (PPM) (DEGR)* * * * * * * * * * * * * * * * * *
112 170. * * * * * * * * * * * * * * * * * * * * * MAX * DEGR. *
113 PAGE 4 JOB: I-66 ITB & Lewinsville Road RUN: Rte MODEL RESULTS REMARKS : In search of the angle corresponding to the maximum concentration, only the first angle, of the angles with same maximum concentrations, is indicated as maximum. WIND ANGLE RANGE: WIND * CONCENTRATION ANGLE * (PPM) (DEGR)* * * * * * * * * * * * * * * * * *
114 170. * * * * * * * * * * * * * * * * * * * * * MAX * DEGR. * THE HIGHEST CONCENTRATION OF PPM OCCURRED AT RECEPTOR 13.
115
116 Appendix D: CO Modeling Layout

117
118

119
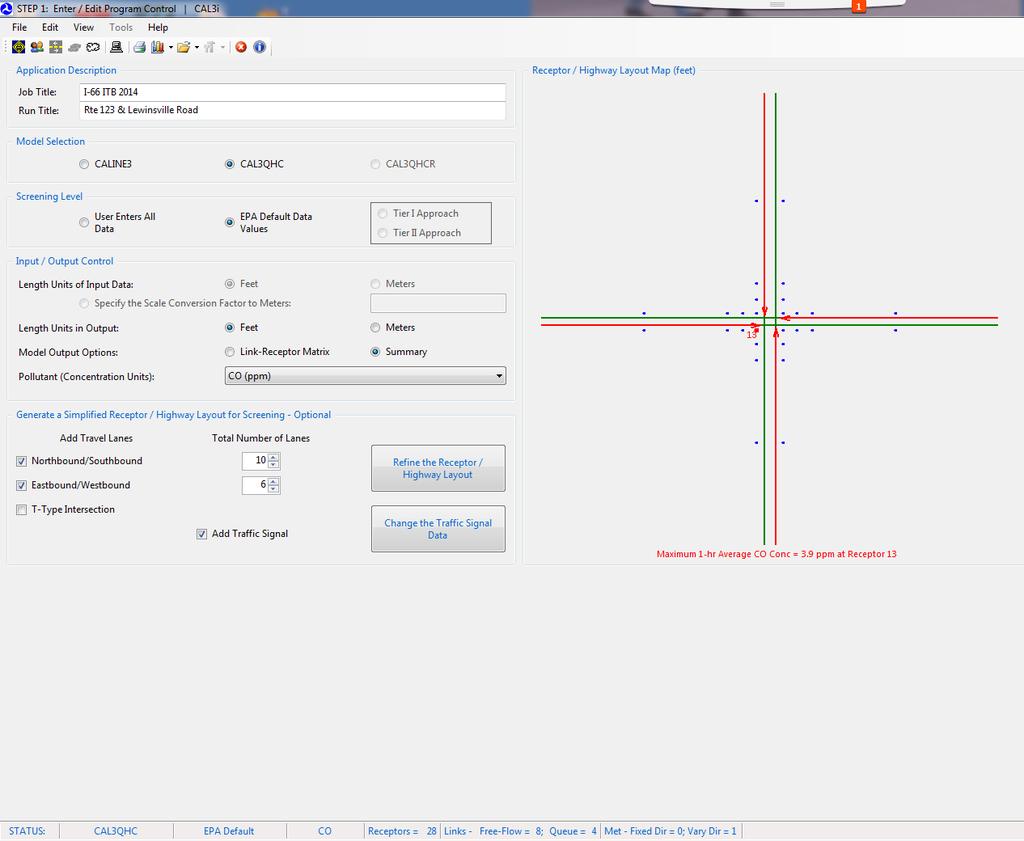
120
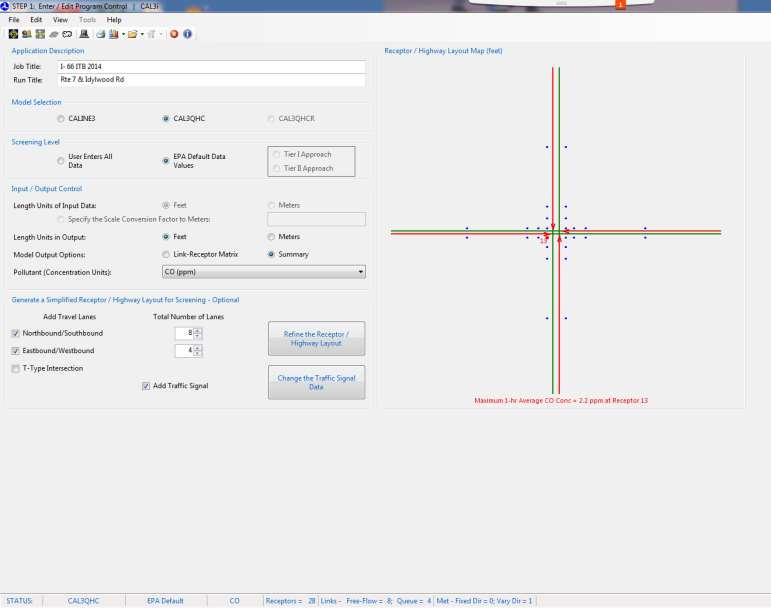
121