Revising Reservoir Planning Based On Vulnerability To Sustained Drought In The Past And Future
|
|
|
- Amie Berry
- 5 years ago
- Views:
Transcription


1 Revising Reservoir Planning Based On Vulnerability To Sustained Drought In The Past And Future Charlie Ester, SRP Manager, Water Resource Operations October 2, 2013

2 Las Vegas SRP manages six reservoirs on the Salt (4) and Verde (2) rivers and one on East Clear Creek in Arizona, and operates approximately 260 groundwater wells, which provide a renewable water supply to the 250,000 acre service area. Mogollon Rim Salt River CAP

3 SRP Water Service Area 13,000 Sq. Mile Project Watershed Flagstaff Prescott Payson Phoenix River Salt River Peoria Glendale Tolleson Scottsdale Phoenix Mesa Avondale Tempe Gilbert Chandler Tucson
4 Salt River Project Historic Drought Periods (Average Runoff = 1,172,215 AF) % Average Drought of Record 7 s % 7 s % 5 s % 4 s % 18 + s ???%
5 Planning Assumptions Version 1.0 (1980s and 1990s) 950,000 AF -- full demand 325,000 AF -- maximum pumping Historical drought of record : Use of allocation and pumping to manage for drought of record Demand mainly agricultural
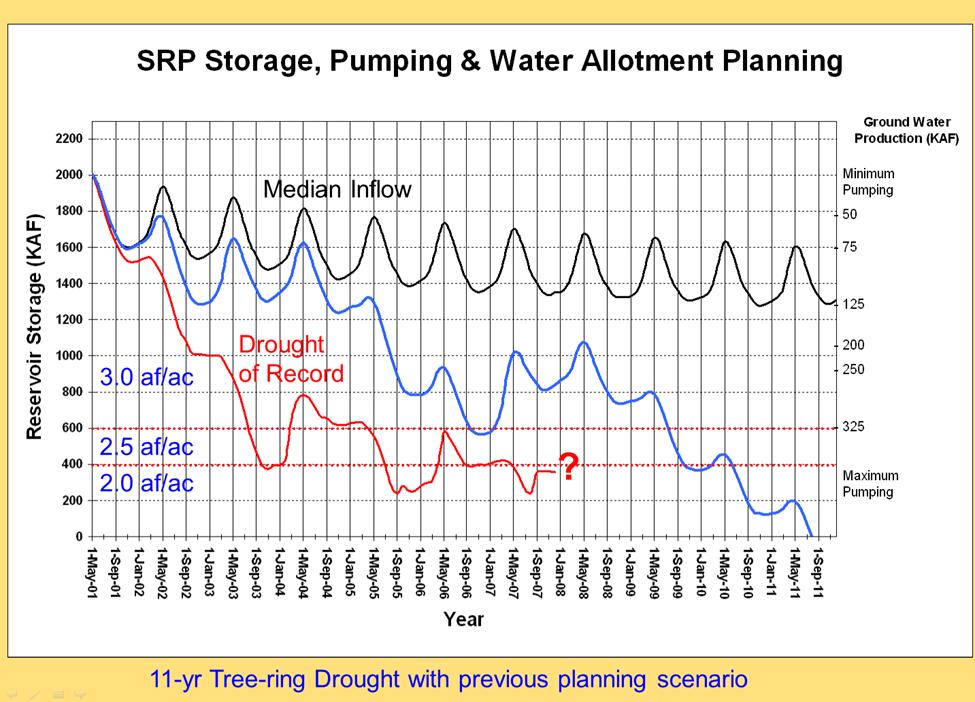
6 SRP Storage, Pumping & Water Allotment Planning Median Inflow Minimum Pumping Reservoir Storage (KAF) AF/AC 2.5 AF/AC Drought of Record Ground Water Production (KAF) AF/AC 200 Maximum Pumping

7 Salt River Project Historic Drought Periods (Average Runoff = 1,172,215 AF) Longer Period Of Sustained Drought % Average s % 7 s % 5 s % 4 s % 18 + s ???%

8

9 The 11-year period was Drought With 70% Of Historical Gaged Median Inflow
10
11
12

13

14 Time To Rethink Old AssumpGons
15 2002 and 1996: long-term extreme lows 350 Reconstructed annual flows, SVT baseline Flow (pct of normal) Reconstructed flow was 21% of normal* in 2002, 22% of normal in 1996 No other reconstructed flow from 1330 to 2005 was lower than 25% of normal. Tree growth recovered with wetter conditions in 2005 *normal is mean, water year, Salt+Verde+Tonto Flow (pct of normal)
16 How Vulnerable Are We? Historical Record Tree Ring Record Climate Change Scenarios Key Question: What is minimum flow that allows SRP to maintain carryover storage in perpetuity?
17 SRP Storage, Pumping & Water Allotment Planning Median Inflow - 75 Reservoir Storage (KAF) % 45% 50% 55% 60% 63% 64% Median Simulated Reservoir Storage for a Range of Perpetually Reduced Inflows (as a percent of historical median)
18 How Vulnerable Are We? PERCENT OF MEDIAN INFLOW YEARS TO RESERVOIR DRYUP 64 INDEFINITE

19 Climate Change Roosevelt Lake and Dam, AZ The Story in the Southwest Climate Model Results

20 42-Model Run Average and 10% and 90% Range of Individual Simulations From Martin Hoerling, NOAA, and Jon Eischeid, U of CO, Past Peak Water in the Southwest, Southwest Hydrology, Jan/Feb Results of Intergovernmental Panel on Climate Change Fourth Assessment Report, 2007.

21 Projections of Future Changes in Climate Precipitation increases very likely in high latitudes Decreases likely in most subtropical land regions
22 What We Do Know: Climate Change? Bottom Line for The Southwest Continued warming could result in: Twenty (20) to fifty (50) percent decrease in runoff over the next several decades Which would require: Search for additional water supplies for same level of service; and, Some idea of the how much time we have to plan for those resources to be available (lead time)
23 In a climate changing world the question becomes: How much worse (drying) before previous droughts become a problem? Severe Droughts Capable of Depleting Surface Water Supply With The Noted Reduction In Flow Period Source Duration (yrs) Flow Reduction Average Annual % of Median Tree-ring 4 20% 40% Tree-ring 7 15% 50% Tree-ring 5 20% 45% Tree-ring 6 20% 48% Historical 7 20% 48% Historical 4 20% 40%
24 SRP Storage, Pumping & Water Allotment Planning Median Inflow Groundwater Pumping (KAF) - 75 Reservoir Storage (KAF) AF/AC % Median
25 SRP Storage, Pumping & Water Allotment Planning Median Inflow Groundwater Pumping (KAF) - 75 Reservoir Storage (KAF) AF/AC % Median
26 SRP Storage, Pumping & Water Allotment Planning Median Inflow Groundwater Pumping (KAF) - 75 Reservoir Storage (KAF) AF/AC % Median
27 SRP Storage, Pumping & Water Allotment Planning Median Inflow Groundwate Pumping (KAF) - 75 Reservoir Storage (KAF) AF/AC % Median
28 SRP Storage, Pumping & Water Allotment Planning Median Inflow Groundwate Pumping (KAF) - 75 Reservoir Storage (KAF) AF/AC % Median
29 SRP Storage, Pumping & Water Allotment Planning Median Inflow Groundwate Pumping (KAF) - 75 Reservoir Storage (KAF) AF/AC % Median
30 When Storage Drops Below The Target 63% Line: Activate Augmentation Efforts to Raise Storage Back to the 63% Line Menu Of Options: Increase Groundwater Pumping (Restoration Program) Reduce Allocation Of Water Purchase Central Arizona Project Water Exercise Lease Options Indian And Non-Indian Agriculture Recover Long Term Underground Storage Credits Conservation Efforts Watershed Management/Weather Modification Activities
31 Water Necessary to Recover to the Target 63% Line Historical Drought Recovery Water (KAF) Reduction Total % % % % % %
32 Water Resources Planning Will Change
33 Proposed Methodology: Process To Determine Timing and Volume of Additional Supplies No, ConGnue Current OperaGng Plan IdenGfy Sustainable Storage Target, Demand, and Total Reservoir Storage Is Risk of GeVng Below Sustainable Storage 1% or Greater? Yes, Determine Volume and Source of Supplemental Supply Needed to Achieve Desired Reliability
34 END