Green Building Parameters & Case Studies
|
|
|
- Jasmine Nelson
- 5 years ago
- Views:
Transcription

1 Green Building Parameters & Case Studies 14 th March, 2015 Mumbai Abdullah Nisar Siddiqui
2 Presentation Coverage 1. Energy Scenario in the Country 2. Green / Energy Efiicient Buildings 3. Case Study 1 Large Commercial Building, Punjab i. Fenestration Optimization ii. Life Cycle Cost Analysis Results & Calculations 4. Case Study 2 Multi-storey Office Tower i. HVAC System selection ii. iii. iv. Fenestration Optimization ASHRAE 90.1 appendix G savings Cooling loads for TES tank Results & Calculations 5. Question and Answers
3 Introduction In 2020 almost 500 Million people will be living in Urban India Cities have a central role to play in the reduction of CO 2 emissions and the fight against climate change. Cities can mitigate climate change by reducing energy consumption in the construction, maintenance and refurbishment of buildings. Building sector contribution to overall electricity consumption has grown from 15% in to 34% in and therefore offer the largest cost-effective opportunity for savings.


) Indian Building")

4 Overview of Indian Building Sector Residential Sector Contributes to 24% of total electricity consumption Annual Electricity consumption by Indian Building sector was 236,620 GWh ( (p)) Indian Building Sector Commercial Sector Contributes to 10% of total electricity consumption Source: CEA


5 Electricity Consumption comparison Electricity Consumption Pattern in Residential Buildings Electricity Consumption Pattern in Commercial Buildings

 In 2030,~ 1,900 million m2")

6 Growth in the Indian Building Sector Commercial Buildings Floor Area - Growth Forecast Currently, ~ 659 million m2 (USAID ECO-III Internal Estimate Using MOSPI, CEA and Benchmarked Energy Use data) In 2030,~ 1,900 million m2 (estimated)* 66% building stock is yet to be constructed 659 millio n m2 Yet to be Built 66% Current 34% 1,900 million m2


7 Policy/ Regulatory Framework for Buildings Design Standards NBC/ Municipal Building byelaws Energy Standard Ensures Comfort Ensures Safety Attempts but doesn t ensure energy efficiency Energy Conservation Building Code Linkage of NBC with ECBC Harmonization of ECBC with NBC 2005 has been finalized by including a chapter Approach to Sustainability which would be adopted in all future constructions in the country.
8 Energy Conservation Building Code ECBC has been developed as a voluntary code for all new commercial building having a connected load of 100 kw and above. ECBC provided minimum performance standards for following components : Building Envelope (Walls, Roofs, Windows) Lighting (Indoor and Outdoor) Heating Ventilation and Air Conditioning (HVAC) System Solar Hot Water Heating Electrical Systems Voluntary introduction of ECBC in May 2007; mandatory after capacity building and implementation experience

9 Introduction to EE buildings Buildings are designed for PEOPLE, and for specific TASK The building needs to keep people comfortable, efficient, healthy. Energy Efficient design seeks to create buildings that keep people comfortable while minimizing Energy Consumption. 1 Comfort categories: Thermal comfort 2. Visual Comfort 3. Air Quality 4. Acoustic Comfort 4


10 Heat Transfer in Buildings


11 Heat Transfer in Buildings Conduction Convection Radiation


12 Building Envelope properties U-Factor (U) Overall conductance of a building element. Used for layered building assemblies. expressed in terms of W/m2 K Thermal Resistance (R-value = 1/U) A material s ability to resist heat flow. expressed in terms of m2 K/W

.")
13 Building Envelope properties - Fenestration Solar Heat Gain Coefficient (SHGC) measures how much of the incoming heat from sunlight gets transmitted into the building, versus how much is reflected away. Visible Light Transmittance (VLT) Fraction of visible light that passes through a window or other glazing unit is called the Visible Light Transmittance (VLT). VLT does not measure shorter-wavelength light like UV or longer-wavelength light like infrared - only visible light.

14 Building Envelope properties - Fenestration Solar radiation = 1000 W Temperature difference = 20 C SHGC = 0.3 U-value = 3 W/m2K SHGC: Heat gain = 300 W 83.3% U-value: Heat gain = 60 W 16.7% Total = 360 W

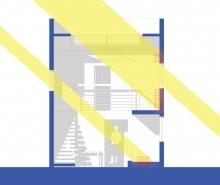
15 EE Design Daylighting WINDOW TO WALL RATIO (WWR)
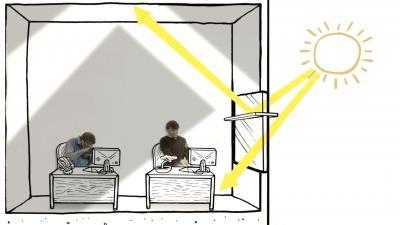
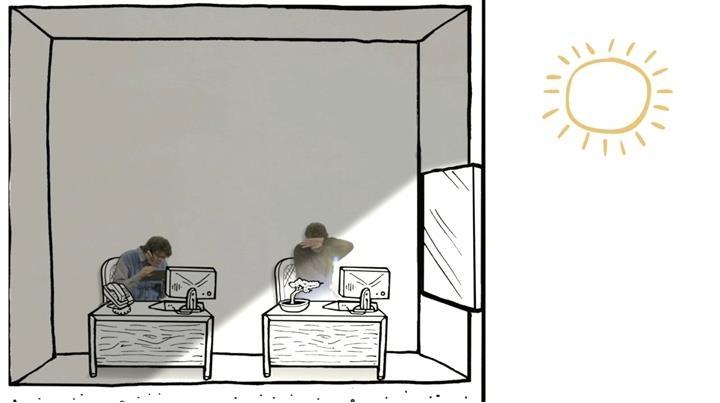
16 EE Design Daylighting Light shelf Shades


17 EE Design Daylighting internal external blinds
18 [You can't manage what you can't measure.]

19 Energy Modeling Basics Weather Data Calculation Engine Results/Patterns 1. Conductive, convective and radiative heat transfer calculation 2. Heat and Mass transfer Calculation 3. Thermal Inertia Calculation 4. Equipment Sizing Algorithms 5. Geometry, surface and Shading Algorithms 8760 Times Building Envelop Heating Delivered General Lighting Gain Miscellaneous Gain Process Gain Computer + Equipment Gain Occupancy Gain Transmitted Solar Gain Heat Removed/Cooling Delivered
20 Input Building Envelope Wall / Internal Partitions (U Factor) Windows (U Factor, SHGC, Visible Transmittance) Roof (U Factor, Reflectance) Floor (U Factor) Other Equipment Equipment Power Density / Receptacle Loads Activity Schedule Schedule - hours, days (holidays) Heating, Ventilating & Air-Conditioning Ventilation type (mechanical) Heating & Cooling (type, schedule, energy source) Service Water Heating Type, Operation schedule Lighting Control (auto), Lighting energy (LPD) Operation schedule, Luminaries type, Radiant Fraction Task / display light (gain, operation schedule)
21 Software DOE2 - Free interface for detailed modeling available, well validated with research equest- easy-to-use building energy analysis tool, provides professional level results in an affordable level of effort DesignBuilder - comprehensive user interface to the EnergyPlus, dynamic thermal simulation engine, accurate environmental performance data. EnergyPlus - Advanced modeling capabilities, modular programming structure, free software, no interface ƒecotect - Reasonable 3D modeling interface, imports.dxf files, nice graphical results viewing, export to powerful simulation tools (Radiance, EnergyPlus), no real HVAC analysis HVACSIM+ - Simulation model of a building HVAC system plus HVAC controls, the building shell, the heating/cooling plant and energy management & control system (EMCS) algorithms. ƒtransys - Difficult interface, detailed modeling options
22 Case Study 1 Large Commercial Building, Punjab Scope: 1. What is the best glazing option available? And how far are they in terms of relative operational cost? 2. Why not to use an inexpensive glass and what will be the financial consequences of operation? 3. What percent operational efficiencies would we get if we use a better glass compare to a notional building façade? 4. What are the figure of relative saving in INR for all the ten façade options? 5. What is the total fraction of electricity bill for building with all the ten façade options? 6. What are the life cycle cost (LCC) for the different option compared with notional option? 7. What is the pay back with 3% to 4% energy inflation over the period of 25 year?
23 Case Study 1 Large Commercial Building, Punjab Options Evaluated: 1. SG-6LowE (INR1300/m2) 2. DG-6LowE-13Argon-6Clear (INR2500/m2) 3. TG-6LowE-13Argon-6Clear-6Air-6Clear (INR4000/m2) 4. QG-6LowE-13Argon-6Clear-6Air-6Clear-6Argon-6Clear (INR6000/m2) 5. DG-6Clear-13Air-6Clear (INR2000/m2) 6. SG-6Clear (INR600/m2) 7. DG-6LowE-13Air-6Clear (INR2800/m2) 8. DG-6LowE-20Air-6Clear (INR2200/m2) 9. DG-6LowE-6Argon-6Clear (INR3000/m2) 10. DG-6LowE-13Argon-6Clear-China-Blue Green (INR2100/m2)
24 Total Annual Fuel Usage with Standard Operation
25 Annual Saving kwh compared to Notional Building
26 Annual Saving INR compared to Notional Building

27 Life Cycle Cost Assessment of Glazing Options
28 Life Cycle Cost Assessment of Glazing Options SG-6LowE TG-6LowE-13Argon-6Clear-6Air-6Clear DG-6Clear-13Air-6Clear DG-6LowE-13Air-6Clear DG-6LowE-6Argon-6Clear DG-6LowE-13Argon-6Clear QG-6LowE-13Argon-6Clear-6Air-6Clear-6Argon-6Clear SG-6Clear(Notional) DG-6LowE-20Air-6Clear DG-6LowE-13Argon-6Clear-China-SilverGrey
29 Results and Conclusions 1. The highest operational saving is 387 MWh which is attributed to quadruple glazing. But the LCC analysis does not recommend this glazing due to its huge initial capital. 2. Considering building life of 25 yr. and an inflation in energy price till 2015 as 4% and after that a constant 3 % LCC has been evaluated. Which indicates that highest LCC come out to be of the poorest option that is clear single glazed units which is about (INR +3240,000) 3. Similarly the LCC of china Blue green option whose U value is 1.24 W/m2.C, acceptable SHGC and VT, is coming out to be very less due to its low initial capital and high performance compared to other in this investment range. 4. Primary estimate depicts that using china glass for 25 yr would be saving about (INR Cr.) where as other Double glazed façade options are showing a saving of (INR -1.4 to INR -3.0 Cr.)

30 Case Study 2 Multistorey Office Tower Scope: 1. HVAC System selection a. FCU b. Chilled beam 2. Fenestration Optimization a. SHGC 0.30 b. SHGC 0.35 c. SHGC ASHRAE App G savings 4. Cooling loads for TES tank
31 Scenario Summary BaseCase Fenestration: 40% U-value: 3.69 W/m²K - VLT: 0.70, SHGC: No shading elements - Exterior Wall U-value: W/m²K - System 7: VAV Water Cooled - LPD of 12 W/m2 ProposedCase - Fenestration: as actual - U-value: 1.8 W/m²K - VLT: Shading elements - Exterior Wall U-value: 0.4 W/m²K - LPD of 9 W/m2 Water-type FCU + heat recovery Cooling: 7-12 C Heating: C Chilled Beam + heat recovery Cooling: C Heating: C SHGC Iteration SHGC Iteration Case #I 0.30 Case # Case # Case # Case # Case #6 0.40
32 Output Summary Parameters BaseCase of 90.1 Appendix Case #1 Case #2 Case #3 Case #4 Case #5 Case #6 G Chiller COP 6,1 5,96 5,96 5,96 8,4 8,4 8,4 Chiller IPLV 6.3 8,98 8,98 8,98 11,88 11,88 11,88 Boiler Efficiency 82% 93% 93% 93% 93% 93% 93% Window Wall Ratio 40% (ASHRAE) As is in dwgs As is in dwgs As is in dwgs As is in dwgs As is in dwgs As is in dwgs Exterior Shading None As is in dwgs As is in dwgs As is in dwgs As is in dwgs As is in dwgs As is in dwgs U (glass + frame) 3,69 1,8 1,8 1,8 1,8 1,8 1,8 U (opaque walls) 0,479 0,4 0,4 0,4 0,4 0,4 0,4 Tvis 0,7 0,5 0,5 0,5 0,5 0,5 0,5 Int. Set Temps W:22 S:24 W:22 S:24 W:22 S:24 W:22 S:24 W:22 S:24 W:22 S:24 W:22 S:24 AHUs with AHUs with AHUs with AHUs with AHUs with AHUs with No Heat Fresh Air heat recovery heat recovery heat recovery heat recovery heat recovery heat recovery Recovery (eff:%75) (eff:%75) (eff:%75) (eff:%75) (eff:%75) (eff:%75) Population 1 person / 10 1 person / 10 1 person / 10 1 person / 10 1 person / 10 1 person / 10 1 person / 10 m2 m2 m2 m2 m2 m2 m2 Lighting 12 W/m2 in 9 W/m2 in office areas office areas 9 W/m2 9 W/m2 9 W/m2 9 W/m2 9 W/m2 SHGC ,3 0,35 0,4 0,3 0,35 0,4 HVAC System VAV/Reaheat - Chilled and Hot water supply FCU FCU FCU Chilled Beam Chilled Beam Chilled Beam Saving over Appendix G 0.00% 21.90% 21.37% 20.77% 20.78% 20.10% 19.38%

33 Savings over ASHRAE Appendix G
34 Savings over ASHRAE Appendix G % 23.00% with Shades (FCU) with Shades (CB) 22.00% 21.00% 20.00% 19.00% 18.00% 17.00% 16.00% 15.00% SHGC 15 SHGC 20 SHGC 25 SHGC 30 SHGC 35 SHGC 40 SHGC 45 SHGC 50
35 00:00 01:00 02:00 03:00 04:00 05:00 06:00 07:00 08:00 09:00 10:00 11:00 12:00 13:00 14:00 15:00 16:00 17:00 18:00 19:00 20:00 21:00 22:00 23:00 Average Cooling Load (kw/m2 of Office Space) Jan Feb Mar Apr May June Jul Aug Sep Oct Nov Dec
36 Cooling Load Ratio in Annual Operation to 25% 25% to 50% 50% to 75% 75% to 100%
37 References 1. AUTODESK, Sustainability Workshop 2. ASHRAE 55 Thermal Comfort Energy Conservation Building Code, ECBC 2007
38 Questions?? Abdullah Nisar Siddiqui Thank You