Designing a downhole fluorimeter for EGS applications: concept, challenges and progress to date
|
|
|
- Vanessa Higgins
- 5 years ago
- Views:
Transcription
1 Designing a downhole fluorimeter for EGS applications: concept, challenges and progress to date Dr Peter Rose, Mike Mella, Dr Bridget Ayling, Prof. Joel Harris and Bruce Boyes bayling@egi.utah.edu
2 EGI: who are we? A geoscience technology consortium: > 60 members in the Corporate Associates Program from 18 countries. Applied research in hydrocarbons, CO 2 sequestration and geothermal energy applications for both industry and government. Geothermal group founded in 1975 by researchers from the Kennecott and Anaconda mining companies 7 Department of Energy (DOE) - funded geothermal research projects active at present
3 DOE-funded projects Development of Chemical Model to Predict the Interactions between Supercritical CO2 and Fluid, Rocks in EGS Reservoirs Economic Impact Analysis for EGS EGS - Concept Testing and Development at the Raft River Geothermal Field Fracture Network and Fluid Flow Imaging for EGS: Applications from Multi-Dimensional Electrical Resistivity Structure Quantum Dot Tracers for Use in EGS The Development of Fracturing Techniques Use of Tracers to Characterize Fractures in Engineered Geothermal Systems
4 DOE Project Borehole fluorimeter development is a sub-component of two grants EGI: Use of tracers to characterise fractures in engineered geothermal systems AltaRock Energy: Newberry Volcano EGS Demonstration field demonstration of tool Specific project objective: to design, fabricate and test an instrument that makes use of tracers to measure fluid flow between newly created fractures in wellbores. EGI grant timeline: Completion in November 2012
5 Original design of borehole fluorimeter Components: a spectrometer (a laser light source, fiber optics and a CCD camera) located at the surface near the wellhead. Issue: the spectrometer would need to be mounted on the coiled-tubing drum that will be used to deploy the fiber optic cable + need to deploy >10,000 ft of optical fibre quite fragile. Too risky!
6 Revised approach Deployment of the spectrometer downhole on a wireline Heat shielded wire-line tool Tracer delivery pump assembly Measurement of fluorescent tracer concentration Measurement of temperature and pressure Issues: Tool must be able to fit through a lubricator to fit down the well maximum diameter of ~2.6 Tool must be able to operate at high temperatures


7 Electronics modules
8 Advantages of tracer measurements From injection rate and tracer concentration volumetric flow rate can be inferred. Tracer dilution method has been used at surface for years. Measurements will be accurate in washout regions. Works at both laminar and turbulent flow.
9 All-in-one tool : PTF design Active design: tracer injection and measurement Fluorescein to be used as the tracer Tool would ultimately measure flow-rates in the wellbore associations with flowing fracture zones pre and post chemical or hydraulic stimulation; long term monitoring of fracture permeability evolution
10 Revisions #2 Two alternative designs have been proposed 1. a passive borehole fluorimeter for identifying newly-created fractures (in high-temperature geothermal systems) 2. an active system for cooler-t systems: a PTF tool, initially for use in injection tests only (temperature-restricted)
11 Passive design No tracer injection by the tool tracer measurement only. Single-well injection tests. Require injection of fluorescein from the wellhead (with the assumption that the most transmissive fractures will take and later release the most tracer) Pump and/or flow the well and monitor which fractures are flowing using the tool

12 Injection/Backflow Tracer Testing
13 Tool design Light delivered from an LED through an optical fiber and out the open end of the flask, through a series of lenses and prisms into the un-insulated sub and finally through a sapphire window to the wellbore. Backscattered fluorescent signal will then return through the same set of filters, into a bundle of optical fibers and into a photomultiplier. Pressure, temperature, inclination also measured
14 Light Source Fluorimeter Light intensity regulation & modulation LED to fiberoptics Optical Probe Transmits light into the well fluid Receive light back from the well fluid Photo Detector Collimator Optical band pass filter Photomultiplier tube

15 Light Source High intensity blue LED 470 nm 66 nm FWHM Fluorescein: 488 nm, 514 nm High temperature: 150 C Digital servo controlled intensity Square wave modulation High efficiency LED driver COTS (Commercial Off The Shelf)

16 Photo Detector PMT (Photomultiplier Tube) High temperature Operation to 175 C Bias voltage 300 to 1500 volts Built-in dynode string Mechanically rugged Designed for down-hole service
17 Internal temperature Normal electrical components are limited to 85 C, automotive components to 125 C we are using these for the first generation of the tool limited by optical components anyway Heat will come from tool exterior but mostly from interior generation Heat sink can mitigate temperature rise Cross sectional area of heat sink
18 Internal temperature Internal temp (C) C 200 C 250 C 300 C 350 C 85 C line 125 C line Internal temp with 5 W generation type 2 brass heat sink hours Expected internal temperatures with time assuming 5 W of internal heat generation.
19 Approaches to mitigate T increase Dewar heat shield (MITCO Thermoshield vacuum) Heat sink (chassis sleeve; Al alloy) Power source: Real time supply optimization Turning tool components off when not in use

20 Tool schematic (not to scale) We may attach a sub with pressure, temperature and spinner at the bottom
21 Tool Dimensions Single open-ended dewar with a specialty sub Dewar: Length = (~5 ft), OD = 1.8, ID = 1.2 Tool: Length max = (6 ft), OD = 1.8 Pump: 4 ft (for future design) = total length ~ 10 ft
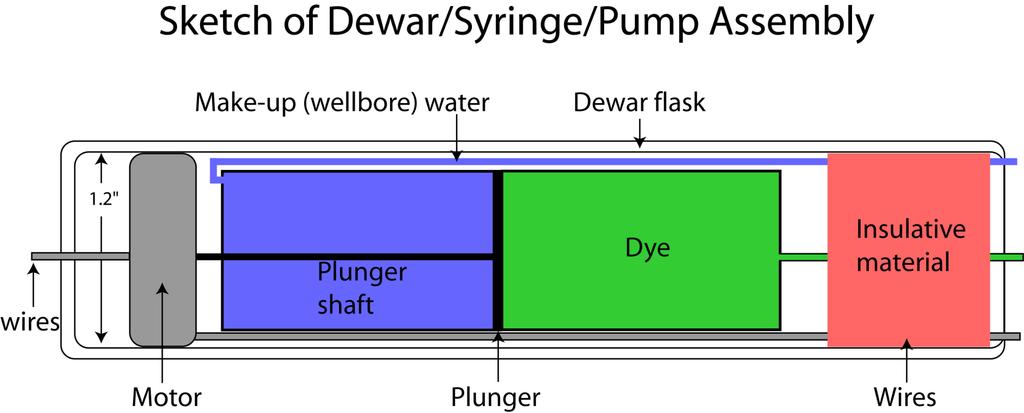
22 Dewar/Syringe/Pump assembly
23 Progress Very preliminary laboratory prototype of the tool was constructed (light source, detector, fibre optics) and used to demonstrate the feasibility of the concept. Component testing under lab-simulated geothermal conditions planned. Now in the process of purchasing components for the fabrication of a more advanced laboratory prototype

24 Thank you