Joint Research Centre
|
|
|
- Brent Stafford
- 5 years ago
- Views:
Transcription
1 Joint Research Centre the European Commission's in-house science service Serving society Stimulating innovation Supporting legislation Solar Photovoltaics A driver for decarbonisation and where it is manufactured Arnulf Jäger-Waldau PV manufacturing in Europe Conference Brussels 19 May 2017

2 JRC s Mission and Role Vision: "To play a central role in creating, managing and making sense of the collective scientific knowledge for better EU policy." Serving society, stimulating innovation, supporting legislation
3 The Joint Research Centre 386 million Budget annually, plus 62 million earned Independent of income private, commercial or national interests 30% of activities in policy preparation, 70% in implementation 125 instances of support to the EU policymaker annually More than 100 economic, bio-physical and nuclear models Focus on the priorities of the Commission (80% of activities co-designed with partner DG's) JRC 6 locations in 5 Member States: Italy, Belgium, Germany, The Netherlands, Spain Policy neutral: has no policy agenda of its own 42 83% Over 1,400 scientific publications per year lаrge scale research facilities, more than 110 online databases 1500 core research staff, out of around 3000 total staff Of core research staff with PhD's
4 Contents Why Decarbonisation of Electricity Technology Trends PV Manufacturing Capacity Expansion Report on Assessment of Photovoltaics Study Conclusions
5 Why Decarbonisation of Electricity

6 Electricity Demand Projection 2014: ~ 23,800 TWh 2040: ~ 39,000 TWh Data source: IEA WEO 2106
7 Electricity Demand in Buildings Data source: IEA WEO 2106
8 Carbon Intensity of Electricity Data source: NPS IEA WTO 2106

9 Carbon Intensity of Electricity BUT Needed for 1.5ºC Scenario: Below 65g/kWh Data source: NPS IEA WTO 2106
10 GHG emissions [Gt] GHG emissions of Electricity total GHG total Energy Electricity % 42% 37% 20% NPS ppm Data source: IEA WTO 2106

11 Technology Trends

12 PV Value Chain
13 Thin Films Commercial CdTe modules Q1/2012 (12.4%) Q1/2017 (16.7%) +34.7% Commercial CIGS modules 2010: between 7 and 11% Q1 2017: between 12 and 15.1% Commercial silicon tf modules 2010: between 5 and 8% Q1 2017: between 5 and 11%
14 Crystalline Silicon Polysilicon Siemens Process 2016: kwh/kg FBR 2016: kwh/kg Power Output per Wafer mc : 2011 (4.02W) 2016(4.78W) +18.9% mono : 2011 (4.27W) 2016(5.01W) +17.3% Polysilicon consumption of wafers mc : 2011 (5.92g) 2016 (4.70g) 20.6% mono : 2011 (5.71g) 2016 (4.30g) 24.7 %
15 Crystalline Silicon Average Cell Efficiency mc : 2012 (17.0%) 2016(18.9%) +11.2% mono: 2012 (18.6%) 2016(20.9%) +12.4% Average Module Efficiency mc : 2012 (15.1%) 2016(17.5%) % mono: 2012 (15.6%) 2016(18.3%) +17.3%
16 Crystalline Silicon New Production Technologies Passivated Emitter Rear Cells (PERC) 4 and 5 busbar solar cells (4BB, 5BB) Heterojunction Solar Cells Bifacial Solar Cells
17 Annual Production [GW] Annual PV Production Rest of World United States Malaysia Japan Europe Taiwan PR China e Year
18 PV Module Price [USD 2016 /W p ] Module Price Experience Curve Crystalline Silion FS CdTe Thin Film New technologies must enter here to be competitive 2014 Spot Prices ,000 10, ,000 1,000,000 Cumulative Module Production [MW]

19 Module Price Experience Curve
20 Solar Cell and Thin Film manufacturing in EU and Turkey Name of Company Country of Production Cell Capacity [MW] Module Capacity [MW] Ownership Solarworld DE, USA 1070 (320) 950 (550) 29% Quatar Solar 20.85% Dr. Asbeck 50.15% free float China Sunergy CN, TR 800 (300) 900 (300) OTC traded n/a Aleo Solar DE Sino-American Silicon Products (TW) AVANCIS (tf) DE China National Building Materials Group Corporation (CN) Solland NL Trina Solar (CN) 3SUN IT (tf & HJ) 160 (80) 160 (80) ENEL Green Power (IT) Solibro DE Hanergy (CN) Calyxo (tf) DE Solar Fields (USA) Photowatt FR EDF Group (FR) Baltic Solar Energy LT private Solsonica IT GALA Group (PTC with free float) Solarion (tf) DE OC3 AG, a subsidiary of Turkish NUH Group (TR) Solaria Energia y Medio Ambiente SL ES? (250)? (250) PTC n/a
21 CAPEX Development Cell & Module Manufacturing Year Capacity [MW] Country CAPEX [mil. USD] CAPEX/W [USD] USA China USA China China China 60 hardware only N-HJ (hardware + tf infrastructure) 0.162
22 PERC Capacity Expansion Technology (in order of announced MWs) "standard c-si technology" CdTe CIGS HJ Bifacial
23 India Capacity Expansion Where are the new plants build (top 5 in order of announced MWs) South Korea China Thailand Malaysia
24 Assessment of Photovoltaics (PV) Study 2015/RTD/SC/PP Assessment of the current situation of the PV sector in Europe and worldwide Identification of options for a strategy to rebuild the EU PV manufacturing sector
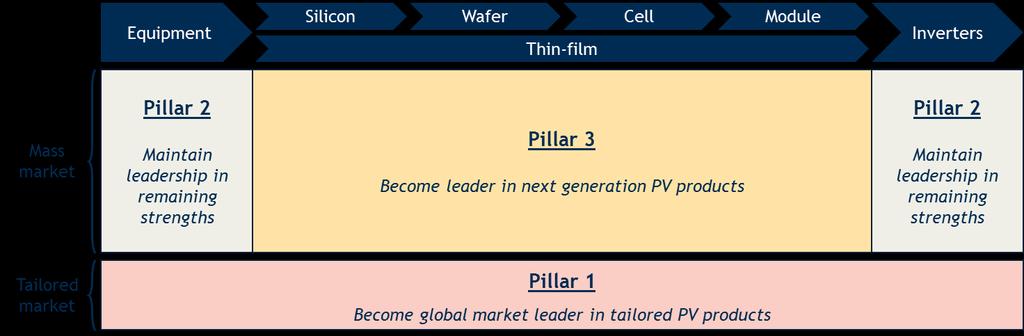
25 Possible Strategies

26 Possible Implementation Measures
27 Conclusions Decarbonisation of Energy sector mandatory for fullfilling the Paris Agreement Solar is one of the pillars to achieve this decarbonisation PV technology has made significant progress. In all technologies the progress has been greater than predicted in various roadmaps. Further material reduction per Wp ongoing PV cell and thin film capacity still larger than demand Shift of PV production

28 Thank you for your attention!