Energy Effiency: A Key Strategy for Climate Goals. 11 th of December 2015 Espaces Génération climat
|
|
|
- Frank Miles
- 5 years ago
- Views:
Transcription


1 Energy Effiency: A Key Strategy for Climate Goals 11 th of December 2015 Espaces Génération climat 1
2 Energy Efficiency: at the center of the climate change challenge ATEE COP 21, December 11, 2015 Philippe Benoit Head, Energy Efficiency and Environment (Climate) Division
3 efficient The little engine that could 3
4 Prologue 4

5 The global challenge: Climbing down the mountain Getting to the top is optional. Getting down is mandatory. Ed Viesturs Mt CO2e DS
6 Our mitigation story 6
7 Portfolio of actions to reduce energy sector emissions Gt CO Source: ETP
8 Portfolio of actions to reduce energy sector emissions Gt CO Nuclear 7% Power generation efficiency and fuel switching 2% Renewables 30% End-use fuel switching 9% CCS 14% End-use fuel and electricity efficiency 38% Source: ETP
9 Portfolio of actions to reduce energy sector emissions Gt CO Power generation efficiency and fuel switching 2% End-use fuel and electricity efficiency 38% Source: ETP 2014 EE provides largest contribution to abatement at 40% 9
10 Energy efficiency investment: bigger than you might think 400 Investments in various fuels USD Billion Energy efficiency* Renewable power** Fossil fired power*** Upstream oil, gas and coal**** * IEA (2014), Energy Efficiency Market Report, Paris: OECD/IEA. ** IEA (2015), Renewable Energy Market Report, Paris: OECD/IEA. *** Frankfurt School-UNEP Center (2015), Global Trends in Renewable Energy Investment, Frankfurt: Frankfurt School of Management, UNEP and Bloomberg New Energy Finance. **** IEA (2014), World Energy Investment Outlook, Paris: OECD/IEA. 10
11 Big... but not big enough... Cumulative Investment in the New Policies and 450 Scenarios, New Policies Scenario Scenario Trillion dollars (2012) WEO 2013 Special Report Fossil fuels Power T&D Low-carbon Energy Efficiency Spending on energy efficiency in the 450 (2DS) scenario needs to top over $600 billion/yr
12 Potential for energy efficiency scale-up is there Energy efficiency potential used by sector in the WEO 2012 New Policies Scenario 100% 80% 60% Unrealised energy efficiency potential Realised energy efficiency potential 40% 20% Industry Transport Power generation Buildings Two-thirds of the economic potential to improve energy efficiency remains untapped in the period to
13 Energy efficiency: the gift that keeps on giving 13

14 Energy efficiency: more productive that we give it credit for EE keeps producing : 1999 Energy Efficiency
15 EE s avoided consumption in IEA topped 22 EJ (520 Mtoe) in 2014 Avoided consumption generated by energy efficiency increased by 10% in Avoided TFC in IEA countries from energy efficiency investments made since 1990 EJ Avoided consumption IEA countries avoided more consumption in 2014 than the TFC of Korea and Japan combined 15


16 A clean energy source: efficiency reduces emissions Without energy efficiency investments, estimated IEA member country emissions would have been 870 Mt CO 2 higher in 2014 IEA emissions from fossil fuel combustion and emissions savings from energy efficiency investments since ,5 GtCO2 13,0 12,5 12,0 11,5 11,0 10,5 Cumulative savings = 10.2 GtCO 2 Emissions savings Emissions 10, Energy efficiency has helped to make the 2 degrees target more achievable by lowering emissions to date 16
17 EE is saving household, business and government consumers billions each year IEA countries saved USD 550 billion in TFC in 2014 as a result of energy efficiency investments since Avoided expenditure in IEA countries from energy efficiency investments made since 1990 USD billion (2014) Cumulative savings = USD 5.7 trillion Annual savings are greater than the EU s fuel import bill 17
18 Efficiency is a domestic production that substitutes for fuel imports In 2014, IEA countries avoided primary energy imports totalling 190 Mtoe, saving USD 80 billion in energy import bills and improving trade balances 60 Avoided imports in 2014, as a result of energy efficiency investments in IEA countries since Mtoe Germany Japan UK France US Domestically produced, efficiency supports energy security USD billion (2014) Natural Gas Oil Coal Import bill (right-axis)

19 The multiple benefits of EE 19

20 Dirty air prompts free public transport in Paris Public transportation in the capital will be "gratuit" from Friday morning to Sunday night, as officials battle against a spike in "dangerously" poor air quality. Velib' rental bikes and the car-sharing Autolib' scheme are also on the house. Shifting to more efficient transport to fight air pollution March 11, 2014 Credit: Patrick Kovarik AFP
21 Energy Efficiency: now showing around the World 21
22 Emissions reductions and economic growth worldwide GHG emissions reduction by measure in the Bridge Scenario, relative to the INDC Scenario, 2030 European Union Russia United States Middle East China India Southeast Asia Efficiency Inefficient coal plants Renewables Methane reductions Fossil-fuel subsidies Latin America Africa Source: World Energy Outlook Special Report: Energy and Climate Change (2015). The measures in the Bridge Scenario apply flexibly across regions, with energy efficiency & renewables as key measures worldwide

 Source: based on World Energy Outlook")
23 Shifting geography of growth in Global Energy Demand Over 95% of the projected growth in energy demand between now and 2035 happens outside the OECD (NPS) Source: based on World Energy Outlook 2014
24 Changing Geography: OECD and non- OECD action for a low-emissions future 60 GtCO Other OECD 9% United States 13% European Union 7% Other non-oecd 15% Other emerging economies 14% India 13% China 29%
25 Changing Geography: OECD and non- OECD action for a low-emissions future 60 GtCO Other OECD 9% United States 13% European Union 7% Other non-oecd 15% Other emerging economies 14% India 13% China 29% About 70% of the decarbonization actions need to take place in non-oecd countries 25
26 EE: Decoupling GDP from Energy Mtoe USD Billions 2005 PPP TPES 6DS GDP (right axis)
27 EE: Decoupling GDP from Energy Mtoe USD Billions 2005 PPP TPES 6DS BAU-Low EE GDP (right axis)
28 EE: Decoupling GDP from Energy Mtoe USD Billions 2005 PPP TPES 6DS BAU-Low EE 4DS 2DS High Productivity GDP (right axis)
29 Energy efficiency for many emerging economies: from doing more with less to to doing even more with more 29
30 Energy efficiency for many emerging economies: from doing more with less to doing even more with more raising standards of living and promoting prosperity 30

31 IEA messages to COP21 To shift the energy sector onto a low-carbon path that supports economic growth & energy access: 1. Take 5 key actions, led by energy efficiency & renewables, to peak then reduce global energy emissions 2. Use the Paris Agreement to drive short-term actions consistent with long-term emission goals 3. Accelerate energy technology innovation to make decarbonisation easier and even more affordable 4. Enhance energy security by making the energy sector more resilient to climate change impacts
32 Et après Paris? 32
33 Beyond INDCs: the need for more Gt 36 INDC Scenario Scenario Room for further policies promoting energy efficiency WEO 2015 CC Special Report
34 Epilogue 34
35 2 O C vs 4/6 O C? 35
36 36
37 37


38 2 O C vs 4 O C 38
39 Thank you the little engine that can beat climate change 39
40 Energy Efficiency: A Key Strategy for Climate Goals ROUND TABLE N 1: HOW TO COUPLE ENERGY EFFICIENCY AND CLIMATE TARGETS IN PUBLIC POLICIES 11 th of December
41 Energy Efficiency: A Key Strategy for Climate Goals ROUND TABLE N 2: WHAT ARE THE EFFICIENT FINANCIAL AND NON- FINANCIAL TOOLS TO PROMOTE ENERGY EFFICIENCY 11 th of December

42 Energy Efficiency In China 11 December 2015 Paris Max Dupuy Senior Associate, RAP The Regulatory Assistance Project China European Union United States 42
43 Energy Intensity by Country Energy Intensity, Total Primary Energy Consumption per Dollar of GDP (Btu per Year 2005 U.S. Dollars (Market Exchange Rates)) Russia China Indonesia Canada Brazil United States France Japan Germany Italy Source: US EIA

44 China Energy Consumption Billion Metric Tons of Oil Equivalent Source: Our Finite World; based on BP Annual Statistical Yearbook
45 Energy Intensity in China 1980 to Tons of coal equivalent per unit of GDP (constant prices, 1980 = 100) Source: China Energy Statistical Yearbook 2014
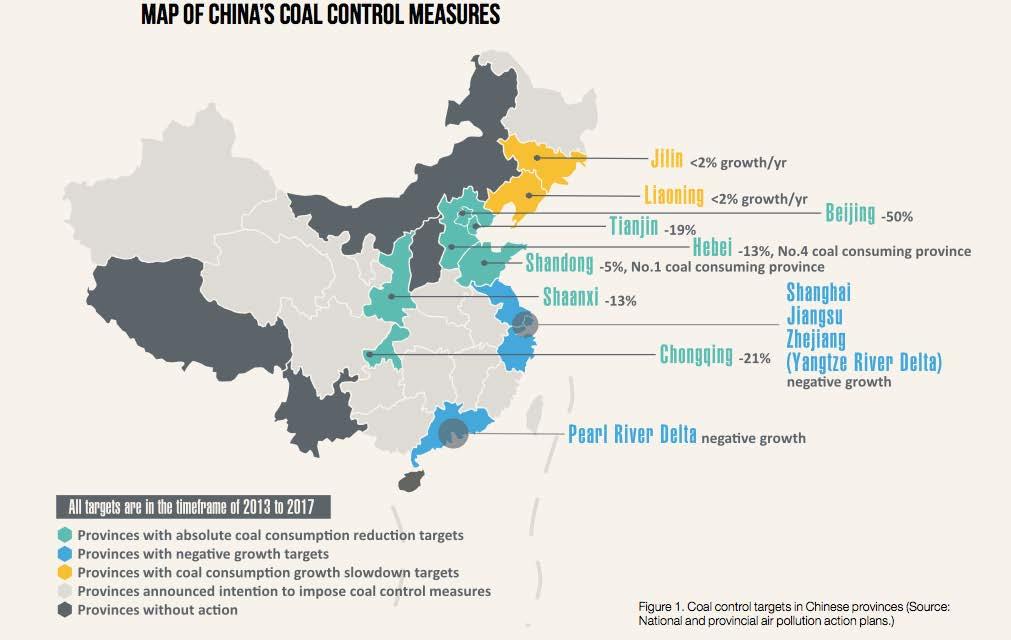
46 Graphic: Greenpeace

47 About RAP The Regulatory Assistance Project (RAP) is a global, non-profit team of experts that focuses on the long-term economic and environmental sustainability of the power sector. RAP has deep expertise in regulatory and market policies that: Promote economic efficiency Protect the environment Ensure system reliability Allocate system benefits fairly among all consumers Learn more about RAP at mdupuy@raponline.org
48 ENERGY EFFICIENCY : A KEY STRATEGY FOR CLIMATE GOALS ROUND TABLE N 2WHAT ARE THE EFFICIENT FINANCIAL AND NON- FINANCIAL TOOLS TO PROMOTE ENERGY EFFICIENCY? 11 December 2015, Le Bourget - Paris/COP21 Wolfgang Eichhammer Fraunhofer Institute for Systems and Innovation Research ISI Fraunhofer ISI
49 A look to the past Most successful tools/ approaches? What has not worked/ was not enough? Target frame (e.g. EU 2020/2030 frames) Lack in ambition/dynamic coherence Standards (building regulation, ecodesign, fuel consumption standards Energy Labels (appliances, buildings, cars ) Subsidy schemes/tax reduction Energy service markets Economic instruments (ETS, energy/co2 taxes.) ambition of standards, non-compliance, long transition periods, regular enforcement, Lack of enforcement, multitude of lacks, limited use in transactions Limited state budgets, economic crises Multitude of small saving amounts, low/variable energy prices/risk Fear of resistance from stakeholder groups, price variability Lack of coherence between targets and single instruments Fraunhofer ISI Seite 49
50 A look to the future: Strengthening coherence in the form of Instrument Worlds Instrument World 1 Strengthening of market actors (Financing through private investor capital) Competitive energy efficiency tender Knowledge on energy consumption(smart meter, use of labels in building transactions, energy audits.) Behavioural measures/information to encounter noncompliance Measures to strengthen energy services (risk,.) Energy efficiency networks to lower transaction costs. Fraunhofer ISI Seite 50

51 Example Instrument World 1 Fraunhofer ISI Seite 51
52 A look to the future: Strengthening coherence in the form of Instrument Worlds Instrument World 2 Strengthening price and volumebased instruments (Financing through charges on energy/electricity prices) Strengthening of energy/co2 taxes/charges (e.g. tolls for cars.) Energy saving obligations (standardized savings) Energy efficiency fonds (non-standardized savings), may include tendering elements Financing through ETS. Fraunhofer ISI Seite 52
53 A look to the future: Strengthening coherence in the form of Instrument Worlds Instrument World 3 Strengthening regulation (financing by the regulated party) Enhanced standards for buildings, cars, appliances (ambitious eco design process ) Enhanced compliance (compliance surveys ) Fraunhofer ISI Seite 53
54 In reality each country will have to find the most suitable linear combination of worlds Evaluation criteria to find a suitable instrument combination: Market conformity/impact on competition Impact on market for energy services Distributional impacts Interaction of instruments in policy mix Acceptance by stakeholders Refinancing of measure Contribution to long-term targets 2030/2050 Need for new coordinating organisation/administration Short-term feasibility (2020) Long-term stability of instrument world! Source: Wikipedia Fraunhofer ISI Seite 54


55 Energy Efficiency Tools that have Worked Well in the U.S. Steven Nadel Executive Director Dec

56 Utility Energy Efficiency Spending Source: ACEEE, 2015 State EE Scorecard 56
57 Appliance and Equipment Efficiency Standards Appliance Efficiency Trends Source: ACEEE, EE in US,
58 Passenger Vehicle Fuel Economy Standards Source: ACEEE, EE in US,
59 Progress on Building Energy Codes Source: ACEEE, EE in US,

60 Market Transformation Approach to Programs Source: Northwest EE Alliance 60


61 Research and Development: Some Successes 61
62 62