Isotopes in groundwater management IAEA
|
|
|
- Randell Gardner
- 5 years ago
- Views:
Transcription

1 Isotopes in groundwater management


2 The arid zone Rainfall is low or intermittent and unreliable The need for water research is greatest because of water scarcity and growth in world population


3 The arid and semi-arid zones Intermittent rainfall No surface water
4 Groundwater ıs the only resource ın dry areas
5 Many fresh groundwaters recharged during a wetter climate

6 Economic value of irrigation of different crops
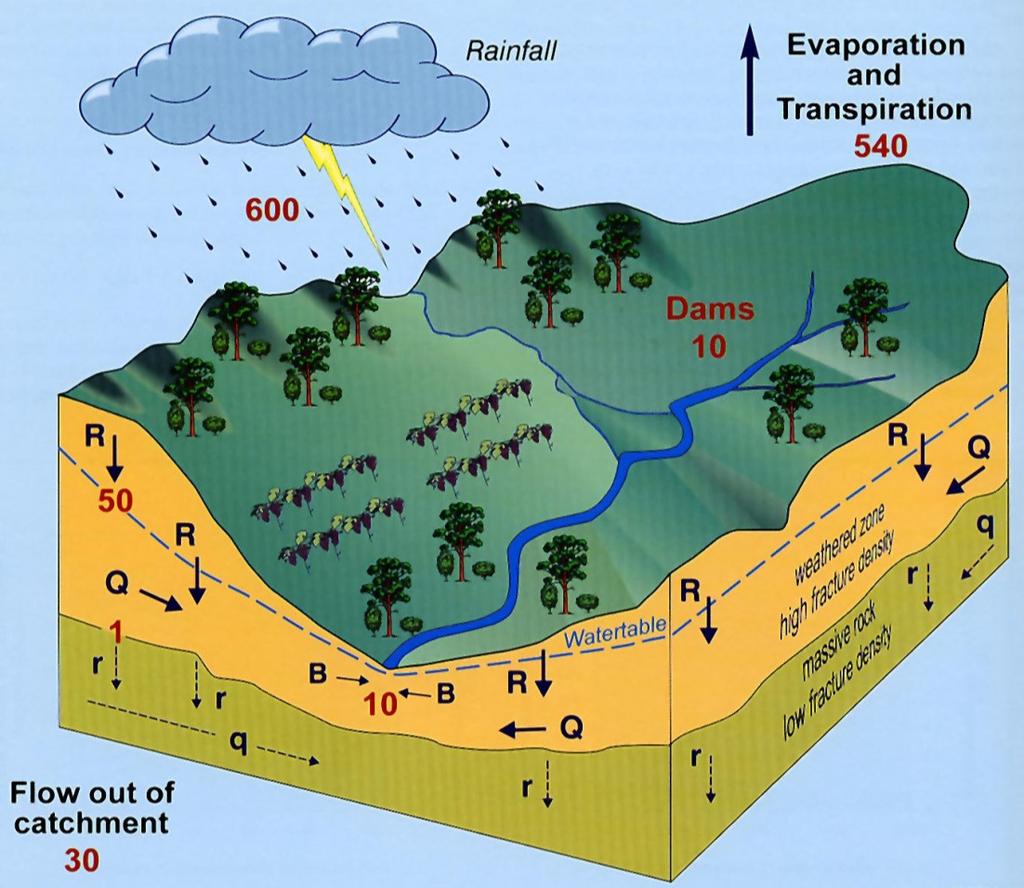
7 Groundwater Balance Recharge Discharge Pre-development Pumping New water level Recharge Post-development Discharge (reduced)
8 Groundwater Sustaınabılıty Groundwater extraction WILL lower water tables and reduce discharge to ecosystems The amount of exploitation must consider an acceptable level of impact and response times Water quality and pumping costs limits groundwater availability before amount considerations
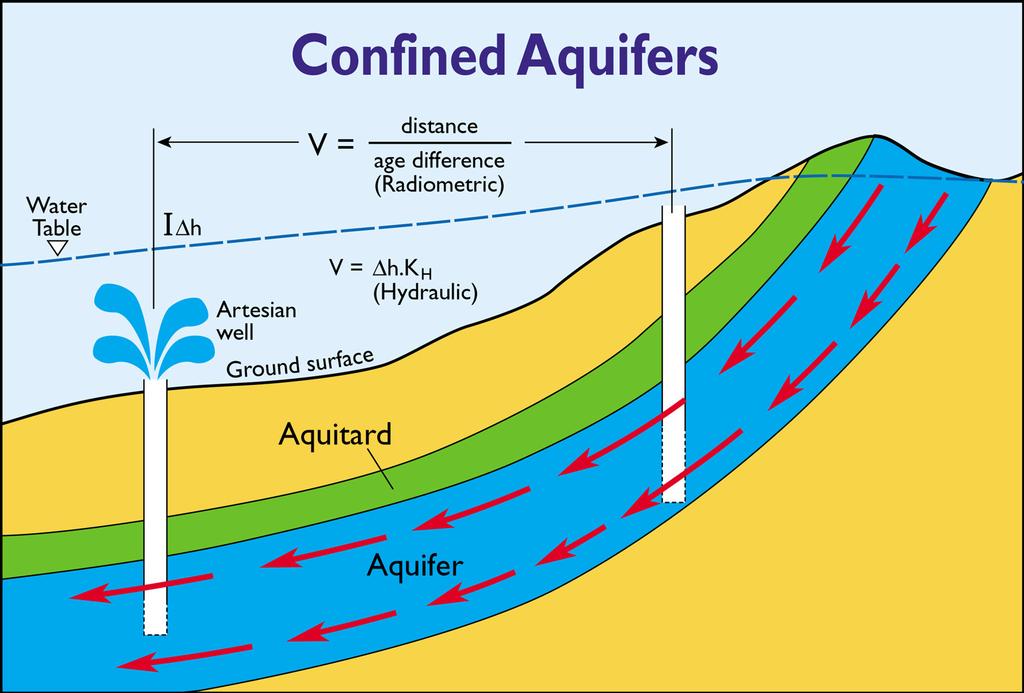
9 Why use isotopes to study groundwater? Dating groundwater rates of flow and recharge Direct measurement of flow systems Fingerprinting sources of pollution Reconstructing past history Interactions with surface waters
10 Fallout from nuclear weapons tests T.U Cl H C 25 2 pmc atoms m YEAR Bomb Tracers : 3 H, 36 Cl, 14 C (young groundwater) Shown for northern hemisphere
11 Tritium profiles Tritium (TU) 5 Depth (m)
12 m/y (8 m/y) shallow deep Distance from Danube (km) Example: Point Recharge using tritium Distance travelled is proportional to recharge from river to groundwater 3 H/ 3 He age (years)
13 Dating young groundwaters: Chlorofluorocarbons 5 4 PRODUCTION 6 (1 kg) CFC-12 CFC-11 CFC YEAR
14 Atmospheric Chlorofluorocarbon Concentration CONCENTRATION (pptv) CFC-12 CFC-11 CFC YEAR
15 Example: CFC groundwater ages increase with depth 5 5 Slope = recharge rate DEPTH (m) CFC-12 (pg kg -1 ) years
16 Isotopes in the arid zone Environmental tracers have produced their most useful results in the arid zone Isotopes often provide unique information in such regions recharge rates, flow rates
17 Many fresh groundwaters recharged during a wetter climate
18 Example Ti-Tree basin, central Australia Weighted-Mean Rainfall Groundwater Samples -5 mm/month Isotopes tell us recharge is by intermittent heavy floods Mean Rainfall LMWL: δ 2 H = 6.9 δ 18 O mm/month 1-15 mm/month 5-1 mm/month Groundwaters: δ 2 H = 4. δ 18 O >2 mm/month δ 18 O (, SMOW)
19 Groundwater dating Horizontal flow rates Estimation of groundwater discharge Renewable or non-renewable?
20

21 Dating using radiocarbon Groundwater in confined Tertiary aquifers flows from Adelaide Hills to the sea

22 Groundwater flow rates
23 Groundwater dating Great Artesian basin flow rates of.2 to.5 m/yr Groundwaters up to 25, years old! Groundwater Dating SW Great Artesian Basin 36 Cl/ 36 Cl Cl x 1 6 (atoms/l) Southern Transect 3, 6, 9, Time (years) Northern Transect Distance (km) Love et al. (2) Water Resources Research,, vol. 36(6):

24 Sources of groundwater pollution Groundwater pollution
25 Buildup of nitrate contamination corresponds to fertilizer use NO3 - concentration (µmol L-1) ground waters LOWESS smoothed trend (f =.4) 3 % of fertilizer N in 23 cm/yr recharge NO3 - flux (mol ha-1 yr-1) CFC Age
26 15 N and NO 3 show evidence of denitrification Other wells show dilution
27 34 S and 18 O SO4 from different sources 2 [ ] 1 atmospheric deposition evaporites δ 18 O sulfate soil sulphate sulphate derived from oxidation of reduced inorganic sulphur compounds δ 34 S sulfate [ ]
28 Recent anthropogenic change History of land-use impacts on water balance Are systems becoming increasingly eutrophic?
29 yy???????????yyyyy? Pump offtake LEGEND Volcanic tuff and basalt 3 4 Volcanic conduit material 1 2 Gambier limestone B1 Landslide material 1B B Dilwyn formation Lacustrine sediment 9 2m 6 Mt Gambier 3 5m Standing water level (confined) Standing water level (unconfined) 3 BLUE LAKE (metres) 2 4 6??????? 7 75
30 % Freeze Core 1 mm } } }? present 1 12 Depth (mm) CaCo3 y?y? y?y? y?y? y?y? y? 6 8 OM Residue 1
31 21 Pb sediment accumulation rate Total 21 Pb and 226 Ra (Bq kg -1 ) xs 21 Pb (Bq kg -1 ) Depth (mm) Depth (mm) 1 15 cum mass (g.cm -2 ) 2 Year Pb 226 Ra A 3 4 B Pb su = 9 Bq kg Pb su = 226 Ra 21 Pb su = 14 Bq kg -1 C
32 d 18O(, PDB) A Carbonate Fraction Increased rate of lake pumping from mid 19 s d 13C (, PDB) Carbonate B Fraction Increased rate of lake pumping from mid 19 s Year 19 Year Increase in groundwater flow from mid-late 18 s?
33 Isotope applications in eco-hydrology Surface water groundwater interactions Water sources for vegetation
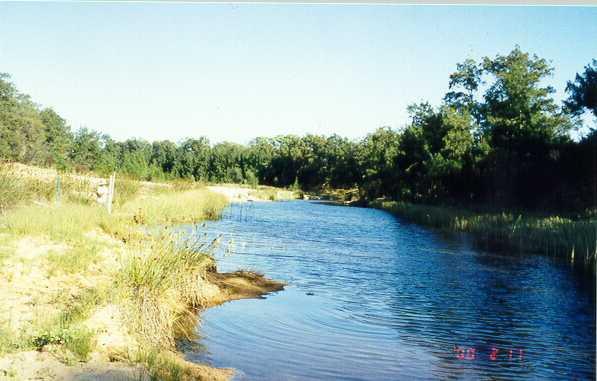
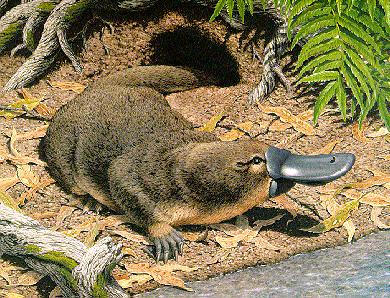

34 Groundwater Dependent Ecosystems
35 Response of Ecosystem Health to Water Regime
 55 5 45 3. Sep 2 Oct 21 Radon (Bq/L) 2. 1. 3 6 9 12 Distance (km)")
36 High radon in streams indicates zones of preferred groundwater input 6 EC (us/cm) Sep 2 Oct 21 Radon (Bq/L) Distance (km)
 15 1 APR 4-6, 2 (high flow) River flow direction 5 5 1 15 2 25 3 35 4 Metres upstream of gauging")
37 Example: Flow paths delineated from isotopes in streams 25 2 Barron River Atherton Tablelands OCT 24-26, 2 (baseflow) 222 Rn (mbq/l) 15 1 APR 4-6, 2 (high flow) River flow direction Metres upstream of gauging station
38 Stream baseflow from deeper circulating system in dry season than wet season δ 2 H more -ve (monsoonal component) lower 222 Rn emanation Weathered zone Water level April 2 1 m Basalt Water level October 2 δ 2 H ~ annual mean higher 222 Rn emanation Stream
39 River-groundwater interactions River G3 G4s G5 a G1 G2s 5 m Residence Time (d) b Distance from river bank (m)
40 Do trees use soil water or groundwater? Banksia Water table Superficial aquifer
 1 2 3 4 5 Matric Suction")
41 2 Depth (m) Water Content (g/g) Matric Suction (MPa) August 1996 December 1996
42 2 H = - 3 all soil water Example: Stable isotopes and plant water-use 2 H = - 1 all groundwater DEPTH 2 H 2 H = H = % of each Isotopes in plant water (xylem) indicate if water is sourced from soil water or groundwater 2 H = H 2 H = H = - 3 DEPTH 2 H = - 3 shallow soil water 2 H = - 1 all groundwater 2 H 2 H = - 2 mixture 2 H = - 3 to -1 DEPTH 2 H = H = - 1
43 H 2 H Depth (m) (summer) (spring) Hatched area is twigs Solid line is soil water profile

44 Water balance
45 Impact in response to change Pre-development Post--development (T 1 ) Post--development (T 2 )
46 Summary Environmental tracers give direct information about the groundwater flow systems over time Isotopes are especially powerful tracers of contaminant sources and fate Surface water- groundwater interactions and ecohydrology is a new frontier for these methods