AIM Training Workshop Organized by NIES, October 2008, Tsukuba, Japan. P.R. Shukla
|
|
|
- Austin Boyd
- 5 years ago
- Views:
Transcription


1 AIM Training Workshop 2008 Organized by NIES, October 2008, Tsukuba, Japan Sustainable Low Carbon Society Scenarios and Modeling P.R. Shukla Indian Institute of Management, Ahmedabad, India
2 AGENDA Visions and Strategies: Japan and India What Drives Emissions? Alternate Strategies to Low Carbon Transition Emissions Reduction through Energy Supply Technologies Emissions Reduction Actions aligned to Development Choices Low Carbon Society: Integration, ti Adaptation ti and Cp-benefits Conclusions: Strategies for Low Carbon Transition
3 Visions and Strategies: Japan and India


4 Slide: Courtesy Dr. Junichi Fujino, NIES, Tsukuba, Japan As for LCS visions, we prepared two different but likely future societies Vision A Doraemon Vision B Satsuki and Mei Vivid, Technology-driven Urban/Personal Technology breakthrough Centralized production /recycle Comfortable and Convenient 2%/yr GDP per capita growth Slow, Natural-oriented Decentralized/Community Self-sufficient Produce locally, consume locally Social and Cultural Values 1%/yr GDP per capita growth Doraemon is a Japanese comic series created by Fujiko F. Fujio. The series is about a robotic cat named Doraemon, who travels back in time from the 22nd century. He has a pocket, which connects to the fourth dimension and acts like a wormhole. Akemi Imagawa Satsuki and Mei s House reproduced in the 2005 World Expo. Satsuki and Mei are daughters in the film "My Neighbor Totoro". They lived an old house in rural Japan, near which many curious and magical creatures inhabited.
5 Utilizing solar power Photovoltaic 34-69MW (25-47% house has PV on roof (now 1%)) and develop high efficiency (<30%) PV Solar heating Diffusion rate: 20-60% (currently 8%) Monitoring system equipped with appliances Super high efficiency air conditioner COP (coefficients of performance=8), share 100% Stand-by energy reduction Eco-life education 10-20% energy demand reduction Good information for economy and environment Slide: Courtesy Dr. Junichi Fujino, NIES, Tsukuba, Japan Heat-pump p heating COP=5 share 30-70% LCS house in 2050 in Japan rooftop gardening High efficiency lighting eg LED lighting Reduce 1/2 energy demand Share 100% High-insulation Reduce 60% warming energy demand, share 100% Fuel cell share 0-20% High efficiency e cy appliances a Reduce 1/3 energy demand, makes people s behavior reduce energy demand and share 100% 5 low-carbon support comfortable and safe lifestyle
6 India: Mainstreaming Climate Change in National Development Aligning climate policies and actions with: MDGs / National development targets Agreed goals under extant international agreements Developing resilience to Vulnerabilities and Adapting to changing gclimate Parameters MDG, India s National Targets and Climate Change MDG and global l targets t India s National plan targets t Interface with Climate Change Goal 1: Eradicate extreme poverty and hunger Targets: Halve, between 1990 and 2015, the proportion of people with income below $1 a day and those who suffer from hunger Targets: Integrate SD principles in country policies/ programs to reverse loss of environmental resources Double the per capita income by 2012 Reduce poverty ratio by 15% by 2012 Contain population growth to 16.2% between Sustained access to potable drinking water to all villages by 2007 Higher income enhances access to services, food, fuel, information, an enhances mitigative and adaptive capacity Higher climate variability would enhance risks to meet the goal Goal 7: Ensure environmental sustainability Increase in forest cover to 25% by 2007 and 33% by 2012 (from 23% in 2001) Enhanced sink capacity, reduced d GHG and local emissions; lower fossil imports; reduced pressure on land, resources and ecosystems Target: Halve by 2015 the proportion of people without sustainable access to safe drinking water Electrify 80,000 additional villages by 2012 via decentralized sources Cleaning of all major polluted rivers by 2007 and other notified stretches by 2012 Higher adaptive capacity to from enhanced supply of water, health & education in rural areas


7 Implementing the Roadmap: Conjoint Market for CO2 & SO2 Year: 2000 Year: 2030


8 Bio-diesel: Multiple Dividends and Risks MDG 1: Eradicate extreme poverty and hunger, MDG 7: Environmental Sustainability Jatropha Plantation in India Rural Employment / Farm Income (from waste lands): : Large scale employment potential in Jatropha plantation, seed collection and extraction Energy Security Imported fossil oil is replaced Environment Neutral carbon emissions, Rehabilitates waste land Water and Food Security Land and energy crop choices are vital to avoid conflicts with other sustainability goals Oil Extraction Plant Rural Employment
9 What drives Emissions?
10 Demographic Drivers Population (Million) Year: 2000 Pop: 1021 Million % % Male Female % % 2.15% Growth Rate Age Ag ge years Yrs Male Female Population (million) Population (Million) Labor Force (Million) Year: 2050 Pop: 1593 Million % % % % 2.54% Growth Rate Age years Age y Yrs Male Female Male Female Population (Million) Population (million)
11 Drivers of Economic Growth Human Capital R&D High Labor Supply Increasing Education Migration (intra & inter county) Increasing Government/ Private Expenditure International Knowledge Flows R&D Collaborations Technology Infrastructures Learning, transfers, deployment Behavioral Changes High Savings Rate Changing Lifestyles 20.6 Governance Institutions Laws 5 Policies Savings Rate 24.6??
12 Base Scenario GDP Base Year 2005= Annual Growth Rate : 7.3% Annual Growth Rate : 8% GDP US $/person Per Capita Income Base Case Assumptions: Summary 1. GDP Ann. Growth Rate: 7.2% from Economy: 24 times larger than Population 2000: 1021 Million 2050: 1593 Million ppmv CO2e Concentration Stabilization (or 550 CO2) 4. Radiative Forcing: 4.7 W/m2
13 Alternate Strategies to Low Carbon Transition
14 Integrated Modeling Framework Integrated Modelling Framework DATABASES Socio-Economic, - Technologies, Energy Resources, Environmental Constraints AIM CGE Model Use Dema and Model End ANSWER-MARKAL Model AIM SNAPSHOT Model AIM S trategic Database (SDB)
15 Energy and Carbon: Base Case Assumptions From : Annual Economic Growth: 7.2% Annual lpopulation Growth: 0.9% Absolute Growth in 2050 over 2005 Economy 23 times Population times Mtoe 3,500 3,000 2,500 2,000 1,500 1, ,000 Nuclear Energy Carbon Emissions Other Renewables Nuclear Hydro Gas Oil Coal Commercial Biomass Non Com Biomass Million Ton CO2 7,000 6,000 5,000 4,000 3,000 2,000 1, Results: Energy and Carbon Intensity Annual Improvement From : Ratios: 2050 over 2005 Energy Intensity: 3.14 (%) Energy Intensity: Carbon Intensity: 3.07 (%) Carbon Intensity: Decarbonization of Energy: (%) Decarbonization of Energy: -3.1 (%)
16 Investment in Energy: Base Case Energy Investments ( ) nvestment (US $ Billion) I Share of Energy Investments ( ) $ 1173 billion Oil & $ 1173 billion Oil Gas & Gas 21% 21% Coal Oil & Gas Power Coal Coal 4% 4% Power Power 75% 75%
17 Alternate Emissions Reduction Strategies t
18 Alternate Development Visions Assumptions 1. Global Stabilization Target Assumption: 550 ppmv CO2e Concentration (OR) 34W/m2(OR) 3 o centigrade temperature increase 2. Two Development Pathways for India: (with same total CO2 emissions from 2005 to 2050) 1. Vision 1: Conventional Development path 2. Vision 2: Sustainability scenario What path shall best deliver national development goals while fulfilling Climate Commitments?
19 Strategies for Emissions Reduction Alternate Pathways to Emissions Reduction Achieving Stabilization of GHG Concentration by: 1. Climate Centric Actions at the Margin of the Conventional Development Path Policies: Global Carbon Price over Conventional Development Path 2. Aligning Climate Actions with Mainstream Development Actions Policies: Sustainable Development Path + Stabilization What path shall best deliver national development goals while fulfilling international commitments?
20 Objectives and Interventions Economic Development (Quantity and Quality of Growth) Enhance Investment in climate actions Mitigation Adaptation Introduce Climate change Technologies R&D/ IPR Technology transfer Mitigate Climate change Risks Adaptation costs Climate Goals (e.g. 450 ppmv CO 2 e or 2 O C) Equity/ Fairness of global climate regime Efficient Mechanisms/ Instruments Direct (Climate) vs. Indirect (Development) Market vs. CC + Non-Market
21 Emissions Reduction Strategy - 1 Million Ton CO2 7,000 6,000 5,000 4,000 3,000 2,000 Others Device Efficiency Renewable Energy Electricity (Fuel Switch) CCS 1, Carbon Tax $/tco2 Emissions Reduction with Supply-side technologies High Carbon Price Climate Focused Technology Push Top-down/Supply-side actions
22 Emissions Reduction Strategy - 2 7,000 Others CCS Transport Mode 6,000 U b Planning Urban Pl i Consumption Recycling Material Substitutions Appliance Efficiency Million Ton CO2 5,000 4,000 Renewable Energy gy Building 3,000 Electricity (Fuel Switch) 2,000 1, Emissions reduction with Demand-side Technologies Low Carbon Price Bottom-up/Demand-side technology pull Behavioural change Diverse Technology portfolio
23 Energy Technology Mix in ,200 Base Case Total Energy Demand Share of Renewable 1, Conventional Dev. + Tax Base 3004 Mtoe Base 24 % Sustainability C+T 2945 Mtoe C+T 34 % Sust Mtoe Sust. 47 % Mto oe
24 Emissions Reduction through Energy Supply Technologies ( Deep Dive Technologies)

25 Carbon Capture and Storage Technology Cooperation Tasks Short-term: Geological Mapping, Pilot Investment Medium-term: Technology and Knowledge transfer Long-term: Development of National Industry, Costs Policy Instruments for Cooperation Government Agreements: UNFCCC, APP, Bilateral Carbon Price Energy Security/ Local Emissions


26 Nuclear Technology Technology Cooperation Tasks Technology Supply (e.g. Gen III, Gen IV) Fuel laccess Policy Instruments for Cooperation Government Initiative/ Agreements International Supervision: e.g. IAEA National Energy Mix (Targets): Energy Security

27 Wind Power Technology Cooperation Tasks Wind Potential Mapping Turbine Technology Transfer Private-Private Technology Collaboration National Industry / Scale Economy Technology Export Policy Instruments for Cooperation National Subsidies Renewable Targets / Commitments Carbon Price


28 Bio-Energy Technology Cooperation Tasks Choice of Biomass and Production Methods Private-Private Technology Collaboration National Industry / Scale Economy Policy Instruments for Cooperation Fuel-Mix Norms Renewable Energy Targets Energy Security / Local Co-benefits Food Security (Barrier)
29 Emissions Reduction Actions aligned to Development Choices
30 Demand Reduction & Substitution Steel Steel 600 Cement 400 Demand (M Million Ton) Demand Million Demand (M (M Million Ton) Ton) Conventional Development Sustainable Society Conventional Development 400 Sustainable Society Paper Demand (Trilllion Lumen hrs) Demand ((Million Ton) 25 Conventional 20 Development Sustainable Society Lighting Conventional Development Sustainable 1000 Society
31 Urban Design and Climate Land-use Planning Building Choices Infrastructures Service Networks


32 Transport Vehicles & Mitigation Rush Hour Traffic in India Rising Incomes and Small Cars Tata Nano: $2500 QQ: $4000


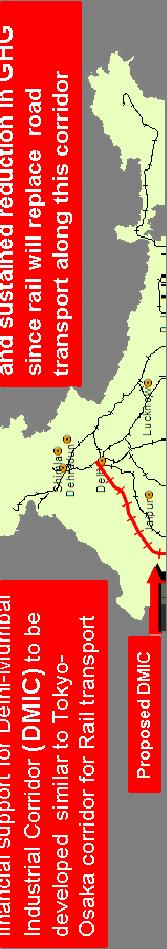


33 Transport Modal Shift Technologies Bus Rapid Transport System Technologies for Train Corridors Public Transport: Metro Rail
34 Transport: Coal by Wire


35 Co-benefits of Regional Co-operation MDG 1: Eradicate extreme poverty and hunger, MDG 7: Environmental Sustainability Co-benefits of South-Asia Integrated Energy-Water Market Benefit (Saving) Cumulative from 2010 to 2030 $ Billion % GDP Bahrain Qatar!. South-Pars Saudi Arabia Iran United Arab Emirates Yemen Somalia!. Bandar-e-Abbas Uzbekistan Tajikistan Turkmenistan!.!. Iranshahar Herat Afghanistan!. Delaram!.!. Kandhar!.!. Khuzdar Quetta Karachi Pakistan Ѻ Valsad Ѻ Oman Legend Important Places Existing Gas Pipelines Ѻ Gas Pipelines under construction Proposed Gas Pipelines Existing LNG terminals Proposed LNG terminals Existing Gas Basin Proposed Gas Basin!. Nangal Ludhiana BathindaSangrur Ambala Multan Sonipat Delhi Faridabad Mahesana Kalol Ujjain Jhabua NadiadAnand Rajkot Chotila Bharuch Olpad Surat Dadra Panvel Pune ChiptunGuhagar Ratnagiri Maldives Bareilly Nepal Shahjahanpur Auraiya Kanpur Gwalior Jagdishpuri Jhansi Patna Kota Vijaypur Guna Gaya Solapur Gadag Kochi India Nellore F Palmaner Hassan Chennai Mangalore Chittoor Bangalore F Coimbatore Tiruchchirappalli Kayankulam Tutikorin Kokinada Vijaywada Sri Lanka Vishakhapattnam China Bhutan Dispur Bangladesh Kolkata Myanmar (Burma) Laos Thailand Indonesia Malaysia Energy 60 Exa Joule CO 2 Equiv. 5.1 Billion Ton SO 2 50 Million Ton Total Spill-over Benefits / Co-Benefits More Water for Food Production (MDG1) 16 GW additional Hydropower (MDG1&7) Flood control (MDG1&7) Lower energy prices would enhance competitiveness t e ess of regional industries (MDG1)
36 Sustainability and Low Carbon Society
37 Sustainable Low Carbon Society: Concept Moving onto the Efficient Frontier Conventional Economic Efficiency View Expanding the Frontier Sustainability View of Efficiency Climate Goal ial Indicator Economic/soci Climate Quality Susta inable Develo opment Goals Economic/soc cial Indicator Climate Quality Sustainability Frontier Socio-Economic Goals Technology & Institutional Innovations; Cooperation, Cobenefits, Avoiding lock-ins Expanding development and climate frontier through: Innovations (technology, institutions) International and regional cooperation Targeted technology and investment flows Aligning stakeholder interests Focusing on inputs (& not only outputs) Long-term perspective to avoid lock-ins
38 Reinforcing the Income Effect Emissions and Income SO2 Emissions in BAU 12 Million TCO2 2) CO2 Emissions ( CO2 Emissions in BAU LCS CO2 Emissions SO2 Emissions (M Million TSO2 2) GDP Per Capita 2000 = 100 0
39 Co-benefits of Low Carbon Transition 14 Co-benefits: SO2 Emissions 12 Base Case Million tso Conventional Path + High Carbon Price Sustainable Development + Low Carbon Tax
40 Transition at Low Carbon Price 120 CO2 Price 100 Price CO2 (US $/tco2) Conventional Society Sustainable Society Base Case
41 Low Carbon Society: Integration, Adaptation and Cp-benefits
42 Integration with Demographics World Population UNLR HIGH: 36 Billion by UNLR LOW UNLR MEDIUM UNLR 0-Growth UNLR HIGH History IIASA "most likely" GGI A2r GGI B2 GGI B1 n Millio
 Water stress index")

,")

 Water stress index in 2100 (Sustainable")
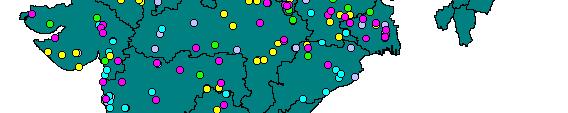
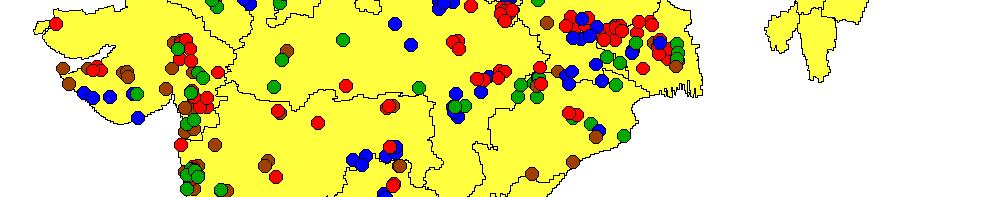
43 Integration with Water Strategies (A) Water stress index in 2000 (B1) Water stress index in 2100 (Unsustainable society scenario) Water stress index is defined as the ratio between water withdrawal and renewable water resource in a river basin (figure s case), region, country or other boundaries. High value implies the higher risk of water shortage. (B2) Water stress index in 2100 (Sustainable society scenario) ~ 100 (%)
44 Sustainable Low Carbon Development Aim Drivers Interventions Targets Low Carbon Society Innovations Co-benefits Sustainability Technological Social/Institutional Management Aligning Markets Win/Win Options Shared Costs/Risks Long-term Vision Avoid Lock-ins National Socio-economic Objectives and Targets Global Climate Change Objectives and Targets Modify Preferences Back-casting casting


45 Delivering Co-Benefits Mitigation Choices deliver multiple dividends In developing countries, significant opportunities exist for gaining co-benefits Mitigation Assessment should consider all costs and benefits For developing countries, the good news is that their environment and natural resources policies are often so bad that there are reforms which would be both good for the economy and good for the environment. Joseph Stiglitz Utility Function
46 Conclusions Strategies for Low Carbon Transition
47 Conclusions: Strategies to gain Co-benefits Align Development and Climate Actions Mainstream Climate Actions Mainstreaming climate action in development strategies yield multiple co-benefits Promote Actions suiting sustainable and climate-friendly development path Reduce, Reuse and Recycle (3R) Infrastructure technologies that act as backbone for low carbon activities (e.g. railway and information networks) Low carbon substitutes (e.g. IT for transport) Use Combination of Direct and Indirect Policies Regional Cooperation to diversify energy mix Energy Intensity Targets Carbon Price
48 Conclusions: National Technology Strategy Develop National Technology Strategy Technology RD&D Public Funding (e.g. Nuclear) Private Investment (e.g. Bio-diesel, Wind) Technology Mandates Intellectual Property Rights Technology Transfer Pilot Projects (e.g. Carbon Capture and Storage) Technology Adaptation and Deployment Collaborations to create National Industry and Market (e.g. Fuel-efficient cars) Technology Export Export of Equipments (e.g. Wind Power) Direct investment/ Joint venture in host country Export of Technology R&D Services
49 Conclusions: Link with Global Actions Link Global and National Strategies Participate in Global Innovations Global R&D Projects (e.g. Deep Dive Technologies, ITER) Develop National Registry National Carbon Exchange (e.g. with commodities exchange) Prepare to Participate in Carbon Market Capacity building in government and industry National Registry National Carbon Exchange (e.g. with commodities exchange) Align with Global l Policies i Global Carbon Finance / Trading Global Trade Regime
50 Conclusions: LCS through Sustainability Changing Behavior and Technology RD&D/ Transfer are key to LCS transition Moving from Margin to Mainstream Development vision matters to LCS transition Managing climate change at the margin is costly, risky, and unsustainable Post-Kyoto needs a Paradigm Shift towards Co-benefits and Co-operation : Negotiations have followed burden sharing metaphor, which poses climate stabilization as a high cost and zero-sum game and this has caused conflicts Sustainable development delivers co-benefits and reduces costs of stabilizing climate. Netting co-benefits is a positive-sum game that would induce co-operation and help: developed countries to transit to low carbon trajectories at lower costs & developing countries to pursue economic development with lower climate barriers Even sustainable Low Carbon Societies shall need exclusive climate-centric actions for stabilization and adaptation, but their costs and risks shall be much lower
51 Thank you