Afternoon Lecture Outline. Northern Prairie Hydrology
|
|
|
- Rhoda Skinner
- 5 years ago
- Views:
Transcription
1 Afternoon Lecture Outline 1. Northern Prairies watershed hydrology 2. Solute mass balance in lakes and ponds 3. Simple mass balance simulation using MS Excel 4. Effects of sediment-water exchange on lake solute mass balance 5. Closing discussion Northern Prairie Hydrology Calgary St. Denis Northern Prairies Cold winter frozen soil Semi-arid climate Clay-rich glacial till Undulating landscape Internally drained basins These result in the unique seasonality of watershed hydrology. 1


2 Glaciated Landscape of Northern Prairies Clay-rich glacial tills are relatively impermeable. Numerous hydrologically closed depressions trap runoff water, forming northern prairie wetlands. # of Ponds and Ducks in Prairie Pothole Region US Fish and Wildlife Service / Canadian Wildlife Service Air-ground data from traditional survey strata ) pond, duck counts (x Mallard 8 Ponds Data by Bob Clark (Canadian Wildlife Service) 2
 1 5 Jan Feb Mar Apr May Jun Jul Aug Sep Oct Nov Dec Pcp., Strong Seasonality of Pond Water Level pond dept h (m) 1.5 1 1..5. 1994 1995 1996 1997 1998 1999 2 3")
3 Semi-Arid Climate of Calgary Potential evaporation (PE) exceeds precipitation PE = 8 mm/yr Precip. = 42 mm/yr snowmelt is primary source of water 15 precip.potential evap. PE (mm) 1 5 Jan Feb Mar Apr May Jun Jul Aug Sep Oct Nov Dec Pcp., Strong Seasonality of Pond Water Level pond dept h (m)
4 Water Balance of Seasonal Prairie Wetlands precipitation evapotranspiration groundwater exchange spring rise summer recession hydroperiod Spring Pond Depth (h ) in Wetland S19 What controls the amount of snowmelt runoff? Winter precipitation Pre-melt snow water equivalent (SWE) h (m) winter precip. (mm) 5 1 SWE (mm) Many factors affect snowmelt runoff. Implication on water level prediction using climate models? 4


5 Laud use in Northern Prairies Typical crop rotation wheat oil seed Photo: Bob Clark (Can. Wildlife Service) summer fallow dense nesting cover 15 1 Effects of Dense Nesting Cover S19 water depth (cm) Grassed in 1983 S van der Kamp et al. (23. Hydrol. Process., 17: 559) 5


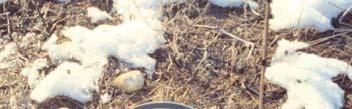
6 Spring of 1997, St. Denis S19 : surrounded by cultivated land S13: surrounded by dense nesting cover Measurements of Soil Infiltration Capacity Summer (unfrozen) Spring (frozen) 6


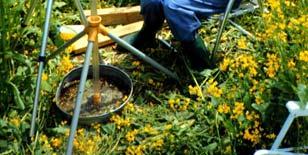
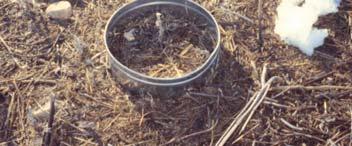
7 Infiltration Capacity of Top Soil Measured by single-ring infiltrometers Average, standard deviation (SD), and # of samples Grassed Cultivated t Avg. SD # Avg SD # Unfrozen Frozen unit : mm/hour Why do grassland soils have higher infiltration capacity? Wetland Drainage near Yorkton, Saskatchewan Implication on large-scale watershed hydrology? Photo by Rhonda McDougal (Ducks Unlimited Canada) 7
.5 1965 197 1975 198 1985 199 1995 2 25 1.5 S19 1.")
8 St. Denis National Wildlife Area 2 m S5 S19 Photo: Canadian Wildlife Service (CWS) S5 appears more permanent. Why? S5 1 water depth (m) S Data by Garth van der Kamp (Environment Canada) 8
9 Hydraulic Conductivity of Glacial Till depth (m) conductivity (m yr -1 ) weathered till sand unweathered till 2 25 soil core piezometer Deep, long-range groundwater flow is a minor component of water balance. Shallow groundwater is important. van der Kamp and Hayashi (29. Hydrogeology J., Eco-hydrology special issue, in press) Effects of Riparian Vegetation For smaller ponds with larger ratio of perimeter to area, riparian plants have a major effect on water balance. rate (mm d -1 ) Water level recession in prairie wetlands near Saskatoon, SK. Miller (1971. J. Hydrol., 14: 259) 15 1 area perimeter recession 5 pond diameter 1 m 3 m.1.2 perimeter / area (m -1 ) 9
10 Hypothetical Water Balance Simulation Assume a 1 m wide tree band around the wetland, taking up water at the same rate as pond evaporation. Pcp.: 1994 data, 27 mm in summer (Apr. Oct.) Evp.: Average year, 6 mm in summer Initial pond depth =.8 m, typical value in St. Denis Initial pond area = A small (S19) large (S5) A = 24 m 2 A = 3 m 2 Water Balance Simulation of S19 and S5 Small wetland dries out, but large wetland keeps water..8 pond depth (m).6 large wetland.4.2 small wetland 4/15 5/15 6/15 7/15 8/15 9/15 1/15 1

. Active exchange with the riparian zone.")

11 Groundwater Exchange and Landscape Setting High K recharge flow through discharge low K inter-till aquifer van der Kamp and Hayashi (29. Hydrogeology J., in press) The regional water table gradient is from high to low. Contrast in hydraulic conductivity (K). Active exchange with the riparian zone. Deep flow is in active, due to low K of deep till. Sand lenses in the till form an inter-till aquifer. Wetland S5 Discharge wetland: Salt accumulation underneath. Wetland S19 Recharge wetland: Salts leached out and transported to uplands. 11
12 Lake Solute Mass Balance Equation Solute mass balance is similar to water balance. Each term is multiplied by the concentration. For example; C P (kg m -3 ) Pcp (m 3 d -1 ) = mass flux (kg d -1 ) in precip. C (kg m -3 ) V (m 3 ) = total t mass (kg) in the lake. Mass balance equation is: [C P Pcp + C IS I S + C IG I G - C(O S + O G ) + R XN ] Δt = Δ(CV) C: Concentration in lake (kg m -3 ) R XN : Reaction rate (kg d -1 ) C IS I S C P Pcp CO S C IG I G CO G Solute Mass Balance [C P Pcp + C IS I S + C IG I G - C(O S + O G ) + R XN ] Δt = Δ(CV) The concentration of outflow terms is equal to C. What is the underlying assumption? Why is ET not in the equation? Reaction term (R XN ) represents all other processes. What are those? - Dissolution/precipitation of minerals - Biological production (e.g. CO 2 2) and uptake (e.g. N and P) - Atmospheric exchange - Diffusive exchange with the sediment 12
13 Dissolved Mass in the Pond in S19 For each species, CV is the total mass dissolved in pond water. Dividing it by the initial value measured on Apr. 12, CV/(C V ) is used to compare the relative behaviours of individual species. Chloride (Cl) is considered non-reactive. How do other species behave? Why? 3 2 / (C V ) alkalinity Cl SO 4 CV Apr. May Jun. Jul. Aug. Sep. Oct. Heagle et al. (27, Wetlands, 27: ) Hypothetical Mass Balance Simulation Based on S5 in St. Denis and Saskatoon Climate 2 th (cm) pond dept
14 See the handout for step-by-step instructions. Water and Mass Balance Simulation Results water depth (m) Cl conc. (g m -3 )
15 Water and Mass Balance Simulation Results water depth (m) Cl conc. (g m -3 ) simulated observed Pond Volume and Chloride Mass Simulated volume matches reasonably with the observed. Major discrepancy between simulated and observed mass. pond volume (m 3 ) volume sim. volume obs. mass sim. mass obs to otal Cl mass (kg)

16 Electrical Resistivity Imaging (ERI) current injection A M N B - Electrical resistance is dependent on salinity - High salinity low resistivity Salinity Distribution under S5 by ERI This figure shows sulfate, but chloride distribution is similar. A very large mass of chloride reserve exists under S5. Salinity in pond water correlates poorly with salinity in sediment pore water. In pond water, SO 4 < 6 g L -1 What does this mean? Sulfate (g L -1 ) Elevation Distance (m) Dru Heagle (Ph.D. thesis) Distance (m) 16