曲斌 Bin QU. Water chemistry and greenhouse gases emissions in the rivers of the Third Pole / Water Tower of Asia. Nanjing
|
|
|
- Clara Ferguson
- 5 years ago
- Views:
Transcription


1 Water chemistry and greenhouse gases emissions in the rivers of the Third Pole / Water Tower of Asia 曲斌 Bin QU Nanjing bin.b.qu@outlook.com
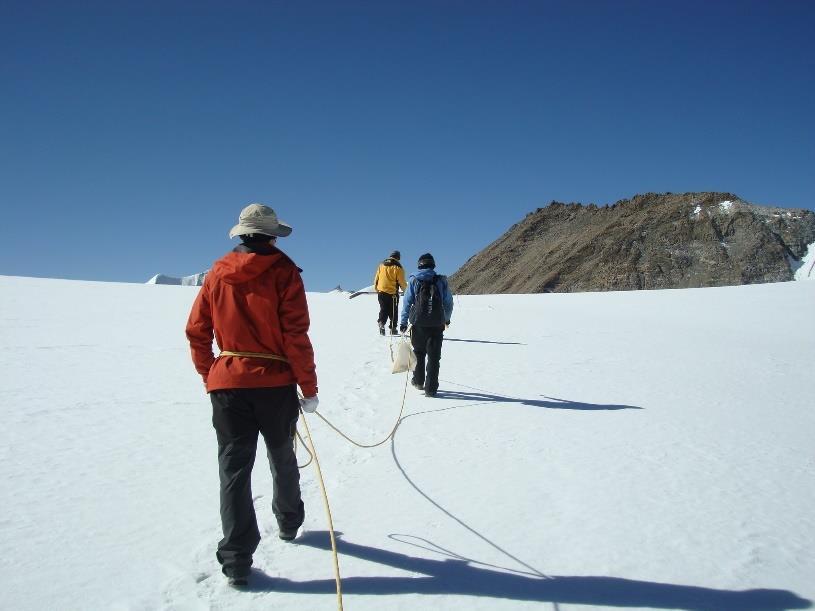
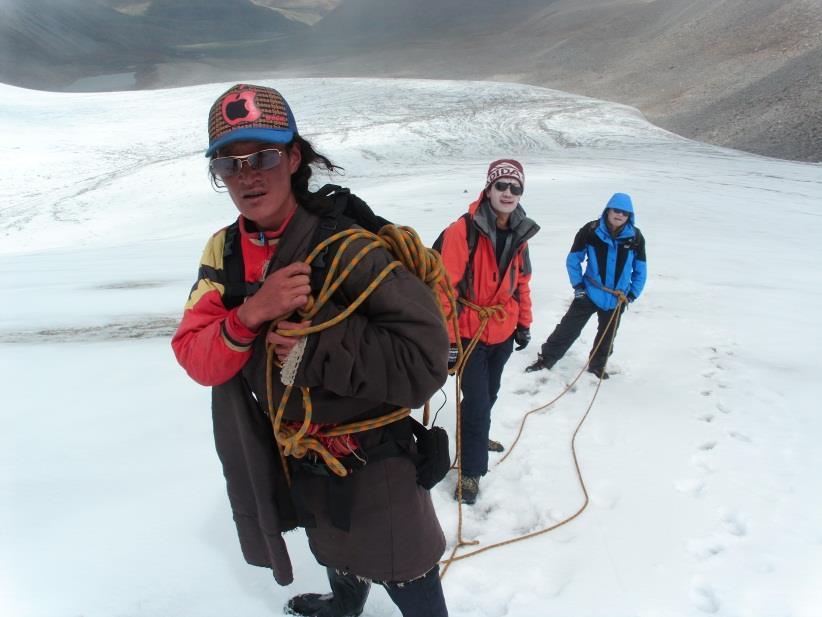
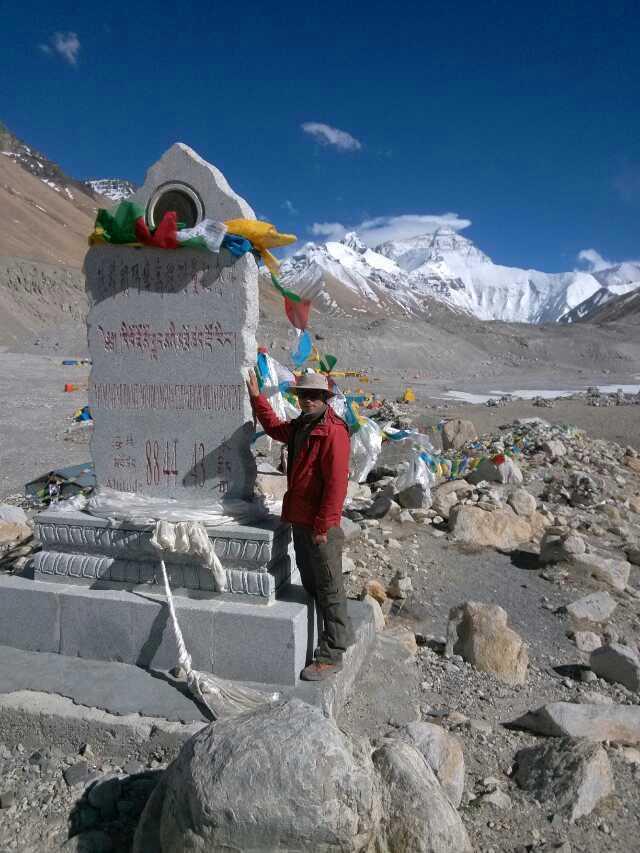
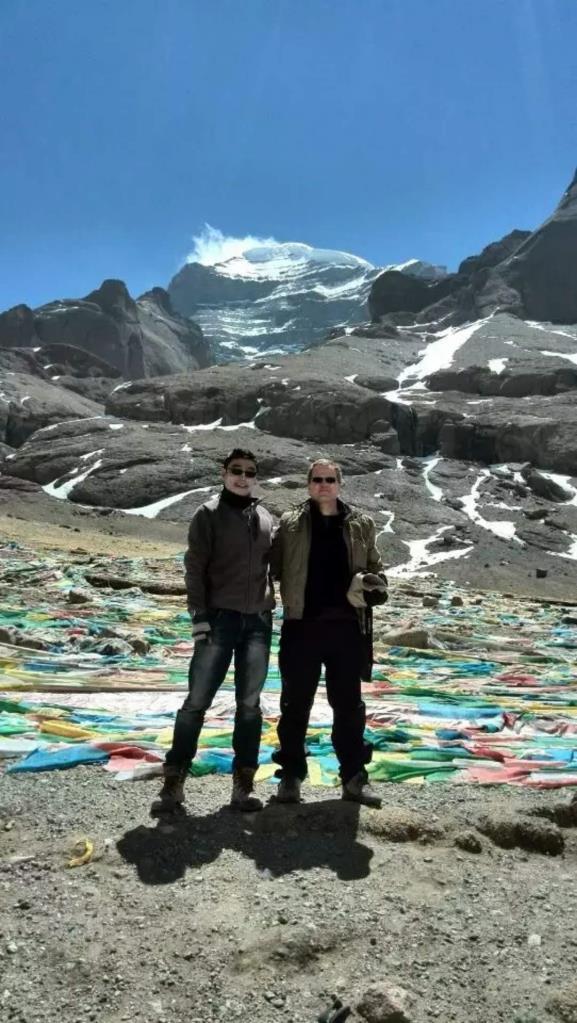
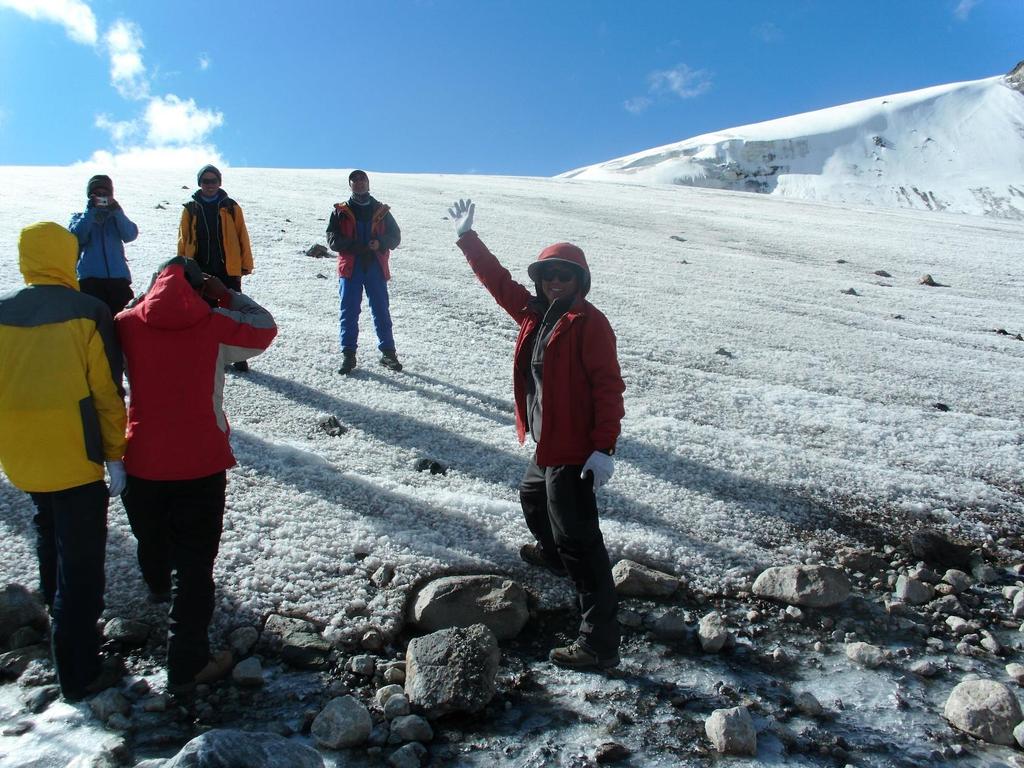
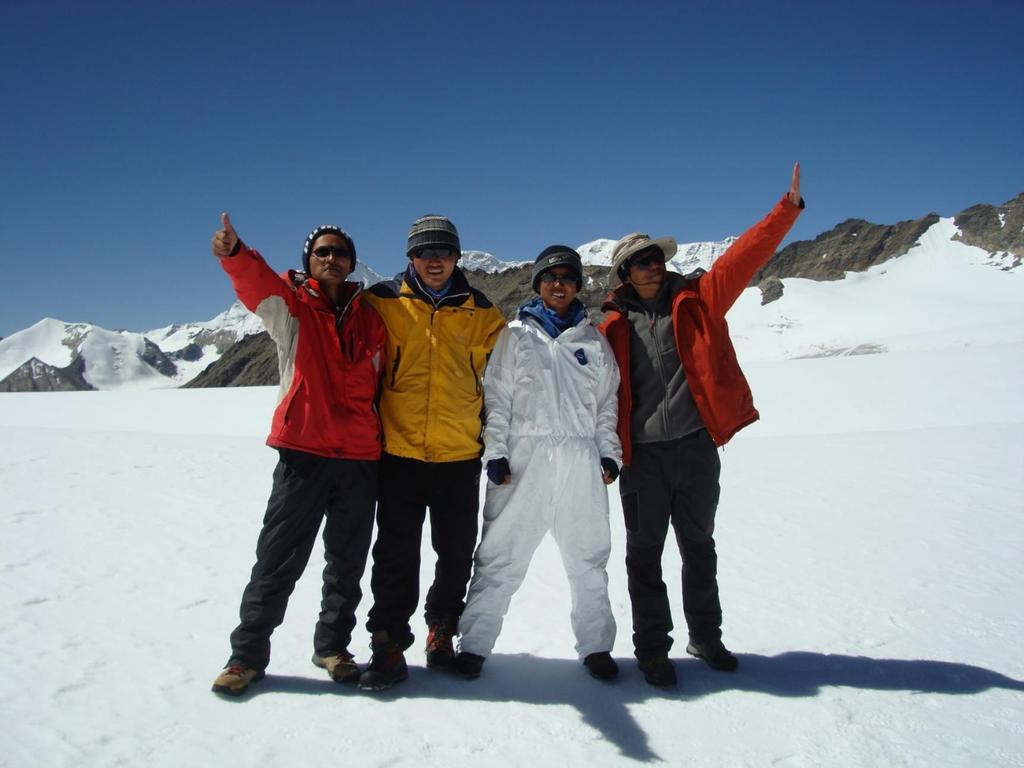
2 学习工作经历 发展历程 山东师范大学 2006 年 多次青藏高原冰川考察 ( 珠峰 ) 2010 年 中国科学院青藏高原研究所 芬兰 Lappeenranta University of Technology 2013 年 Short visit to Yale Twice AGU 青藏高原河流考察 耶鲁 - 南信大大气环境中心 2017 年 南京信息工程大学


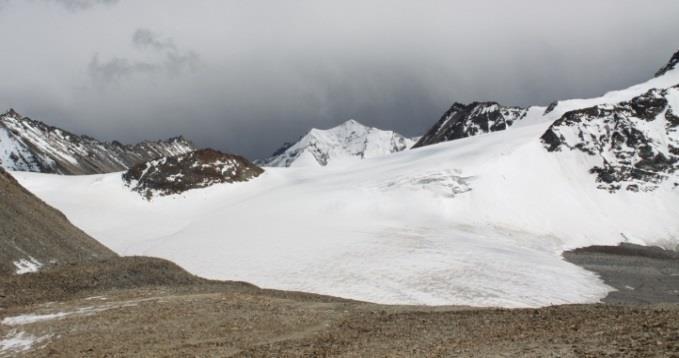
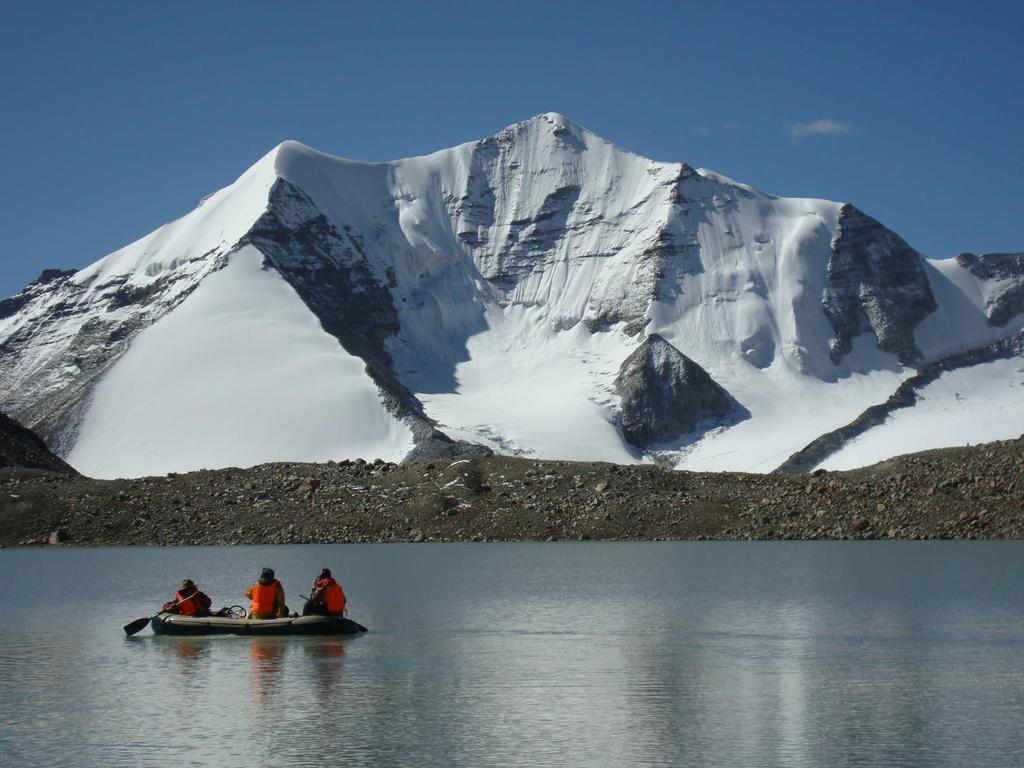
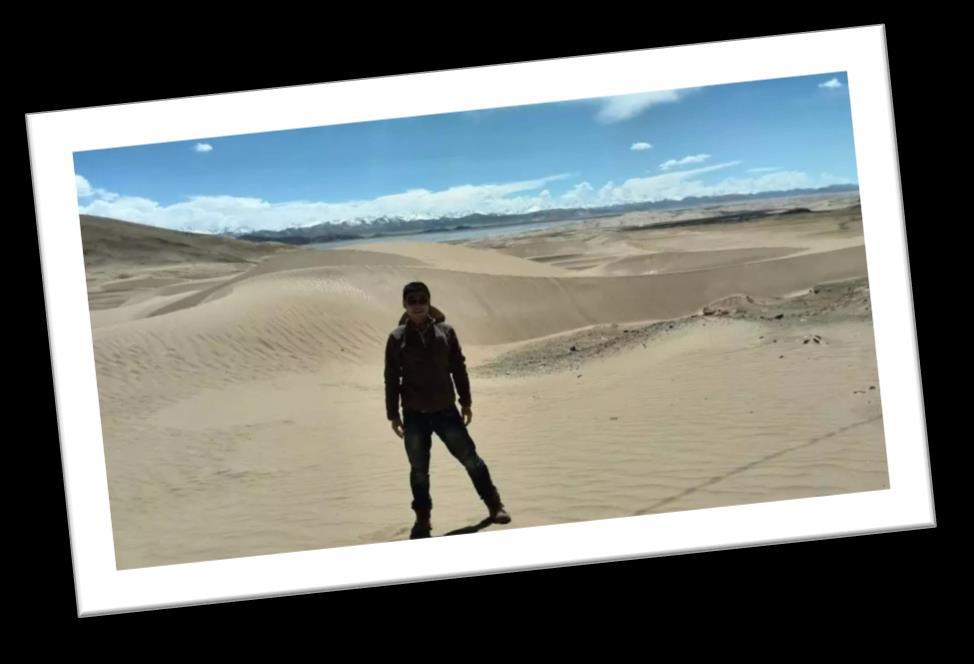
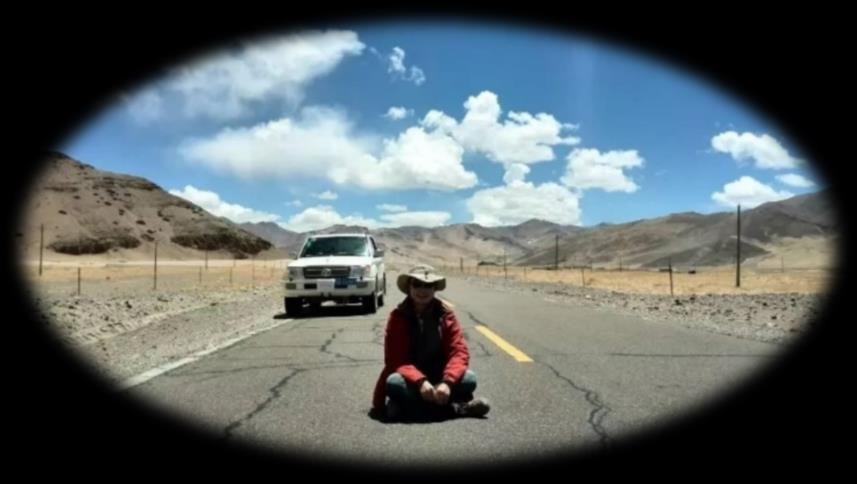
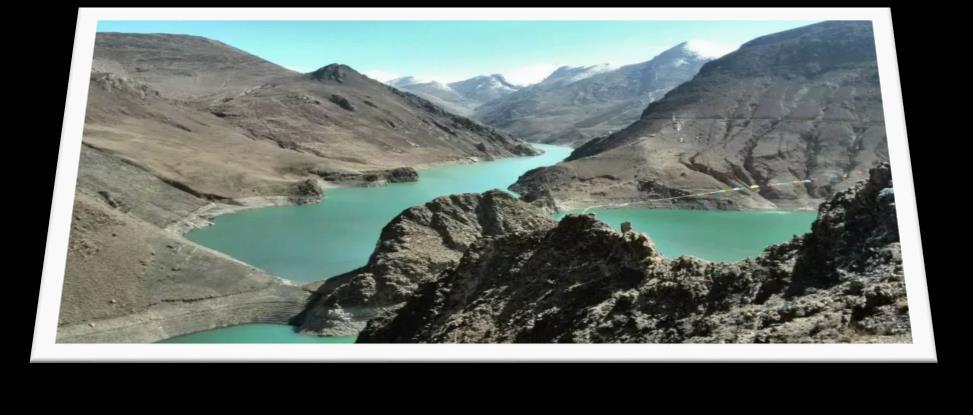
3 The Tibetan Plateau The Roof of the World and the Third Pole, The world's highest plateau, average elevation exceeding 4,500 m a.s.l., 2,500,000 km 2. CHINA Water tower of Asia Head waters of more than ten large INDIA rivers in Asia.

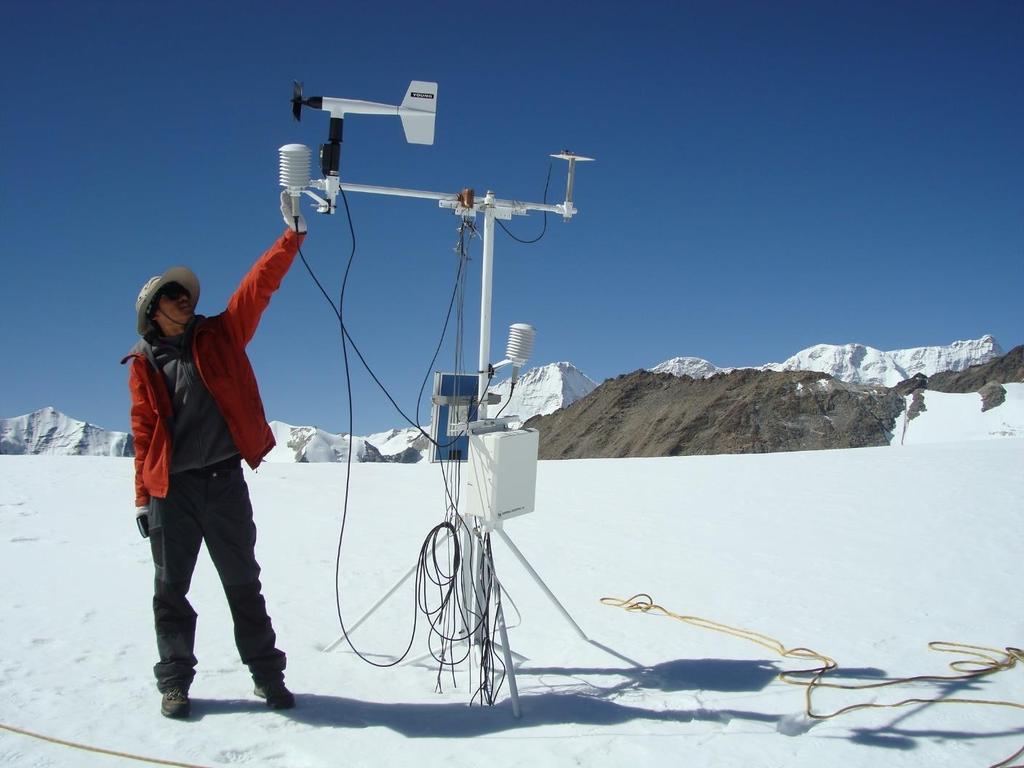
4 Work during master program SNICAR(Snow Ice Aerosol Radiative) (Gardner,A. S. and M. J. Sharp 2010) 实测数据与 SNICAR 模拟数据的对比验证 (Flanner et al. 2007)

5 SNICAR S-II S-I S-III BC 粉尘对 2011 年 7 月扎当冰川附加冰带反照率降低的贡献率


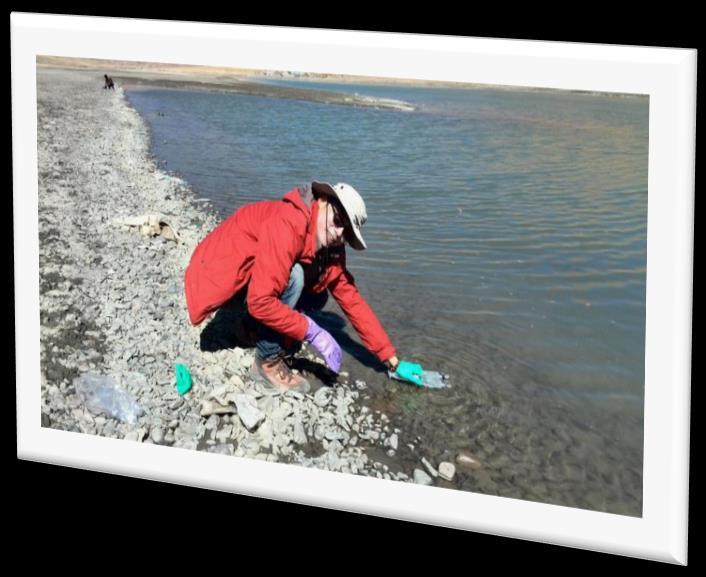
6 Work during doctoral program Water chemistry in rivers of the Tibetan Plateau Dissolved carbon and nitrogen in rivers of the Tibetan Plateau Ions and trace elements Riverine dissolved carbon and nitrogen concentrations Isotope compositions of dissolved organic carbon (DOC) Greenhouse gases (GHGs) emissions To present an overview of the environmental risks on the waters of the Tibetan Plateau and take the first step to provide information about the effects of climate change on the riverine carbon and nitrogen issues of the plateau
 Lancang Jiang (Mekong, P- L) Yellow River (P-YL) India Ocean Water System Indus River (Indus I-I) Yarlung Tsangpo (I-YT) Nujiang")
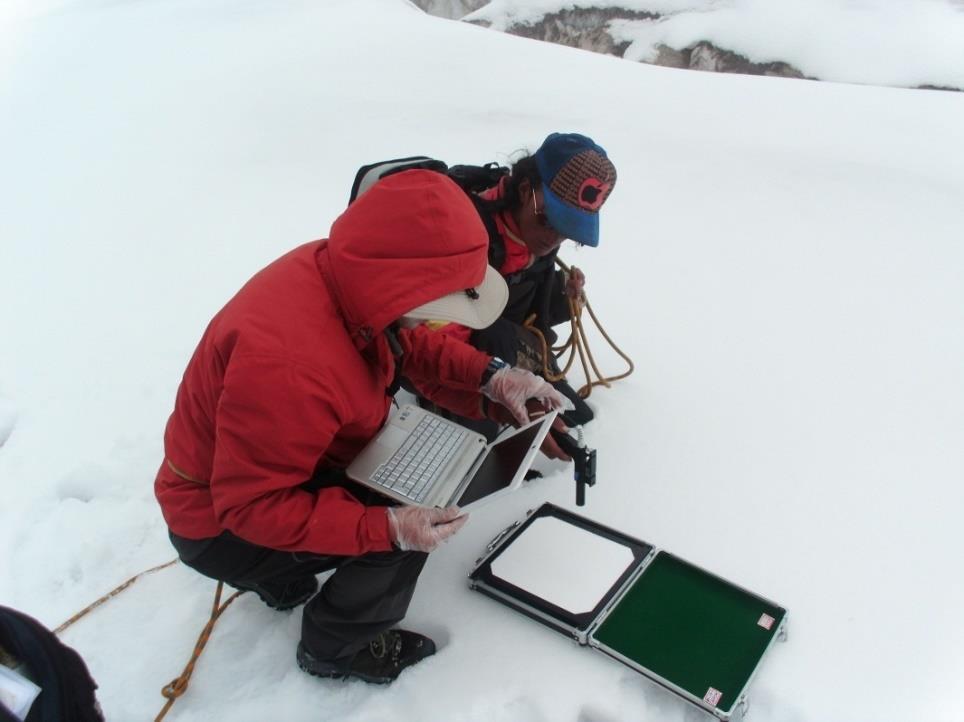
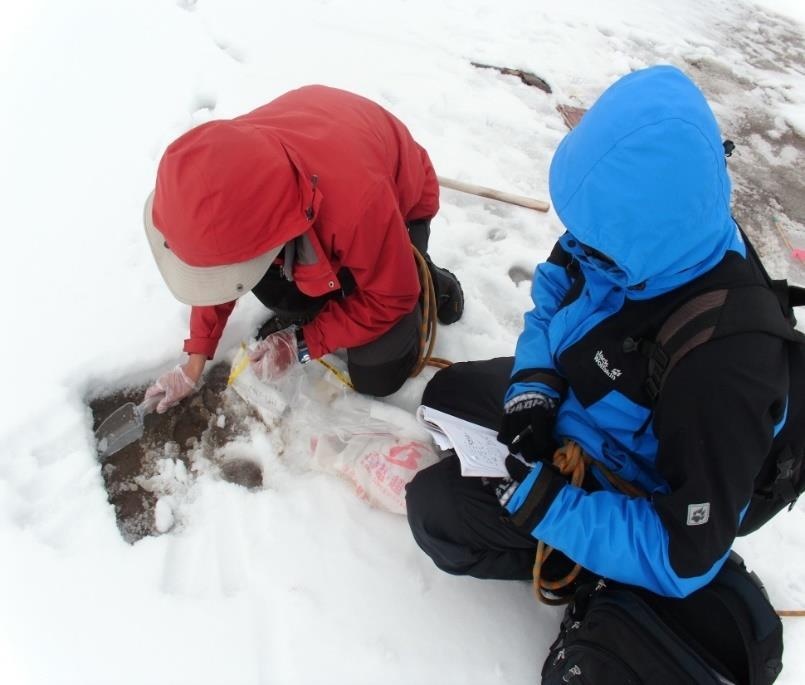
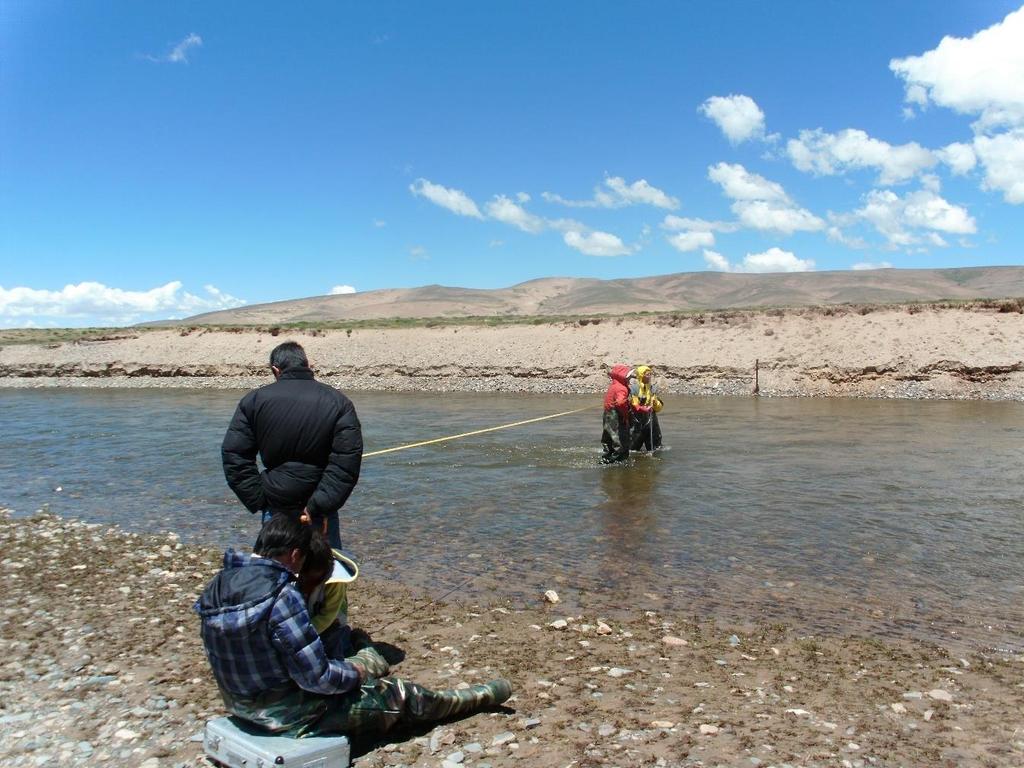
7 Study area and sampling sites Inland river watershed Shule He (IL-S) Hei He (IL-H) Buha He (IL-B) Pacific Ocean Water System Yangtze River (P-YZ) Lancang Jiang (Mekong, P- L) Yellow River (P-YL) India Ocean Water System Indus River (Indus I-I) Yarlung Tsangpo (I-YT) Nujiang (Salween, I-N)
8 Water ionic chemistry in rivers of the Tibetan Plateau Average concentrations of major ions of the rivers on the Tibetan Plateau and in the world. Data source: a. this study; b. Müller et al. (2008); c. Chen et al. (2002); d. Huang et al. (2009); e. Meybeck and Ragu (2012); f. Meybeck and Helmer, (1989).
9 The Gibbs graph of major ion compositions (weight ratio) in the Yangtze River and the Yarlung Tsangpo.
10 Water quality assessment in rivers of Tibetan Plateau concentrations of several elements in rivers were higher than that of WHO guideline for drinking. Sr Rb Ti Tl B Ba Hg Yangtze River Mainstream * Yarlung Tsangpo Yarlung Tsangpo tributaries Mn Cr Ni Cu Zn Cd Sb Ba Pb U Mo Mainstream * * Lhasa River Doxung Tsangbo Xiabu Qu 265.0* 12.0* Nianchu River Nyang River Note: unit for Hg concentration is ng L -1, others are μg L -1
11 Waters quality assessment in rivers of the Tibetan Plateau arsenic concentrations in rivers were higher than that of WHO guideline for drinking. Seasonal variations of dissolved trace metal levels of Lhasa River (a) and Duilong Qu (b) (Li et al., 2014).
12 Carbon emission and discharge from rivers, figure is modified from (Raymond, 2005 Nature). Dissolved nitrogen and GHGs emissions from aquatic system, figure is modified from (Beaulieu et al., 2011).

13 Dissolved carbon and nitrogen in rivers of the Third Pole a. Concentration distributions of dissolved C and N in the rivers of the Tibetan; b. Mean concentrations of dissolved C and N in river of the Tibetan Plateau and the global average Plateau (Qu et al., 2017).
")
14 Correlation between riverine C and N in rivers of the Tibetan Plateau and the related influential factors (Qu et al., 2017)
15 Distributions of Δ 14 C and δ 13 C of dissolved organic carbon for rivers of the Tibetan Plateau and other regions in the world. (Qu et al., 2017).
16 Significant relationship between permafrost soil area as a percentage of watershed area (%) and 14 C age of dissolved organic carbon (DOC) in years before present (ybp) (Qu et al., 2017)

17 The thickness of the active layer has increased by 0.15 to 0.50 m and ground temperature at a depth of 6 m has risen by about 0.1 to 0.3 between 1996 and 2001 (Cheng et al., 2007)

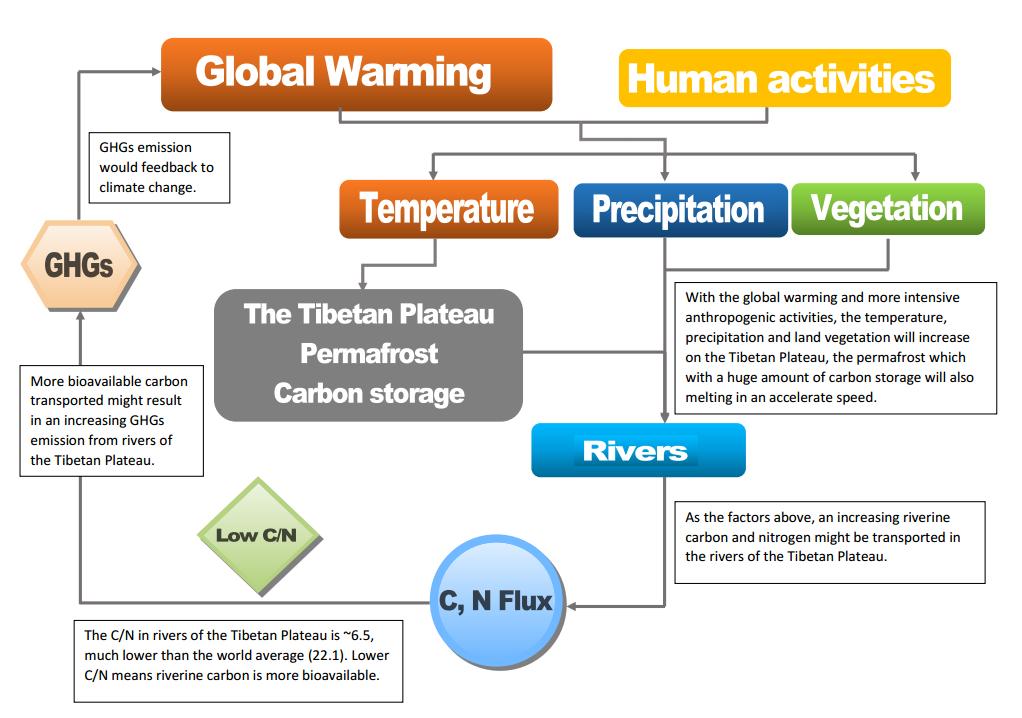
18 Summary and perspectives Water chemistry in the Himalayan region was influenced by the natural process (e.g. global warming, snow/glacier melting, runoff and soil erosion changing) as well as anthropogenic activities in the surrounding area.
19
20 Future work Next 课题组的优势 : 1. 温室气体的多年连续积累观测 ; 2. 物理过程的解释 ; 3. 最关键 - 人员 尝试解决的科学问题 : 1. 以高原 ( 黄河源 ) 为依托, 探索碳 ( 包括温室气体 ) 在河水中的迁移 ( 排放 ) 机制 ; 2. 目前观测到的一些利用物理过程比较难解释的现象, 尝试引入化学的方法 ; 3. 基于温室气体排放的观测, 探索湖泊 ( 自然开放水体, 如太湖 ; 封闭水体, 全椒鱼塘 ) 中碳的含量, 成分, 来源及其归宿
21
22

23
24


25
26
27
28
 Email: bin.b.qu@outlook.")
29 Room 211 Meteorological Building, Yale-NUIST Center on Atmospheric Environment Nanjing University of Information Science and Technology 219 Ningliu Road Nanjing, Jiangsu Province, China 其他相关视频 1f524 (2:47 开始 ) bin.b.qu@outlook.com