Event Speaker Lisa Jacobson. President, The Business Council for Sustainable Energy
|
|
|
- Pearl Chambers
- 5 years ago
- Views:
Transcription


1 Event Speaker Lisa Jacobson President, The Business Council for Sustainable Energy
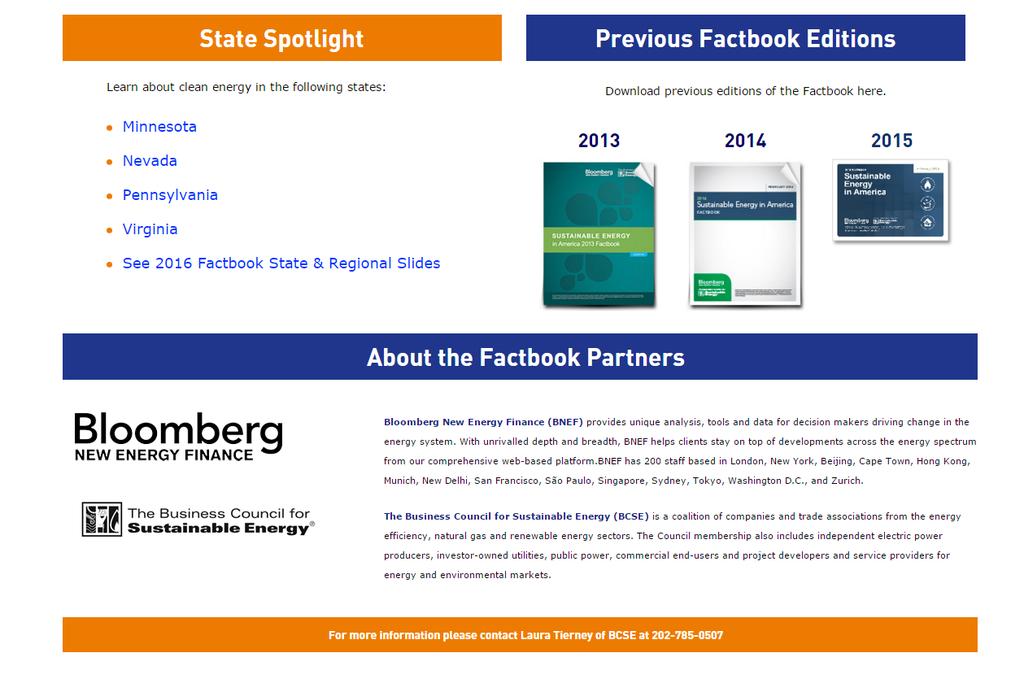
2 About the BCSE The Business Council for Sustainable Energy (BCSE) is a coalition of companies and trade associations from the energy efficiency, natural gas and renewable energy sectors. The Council advocates for policies at state, national and international levels that: increase the use of commercially-available clean energy technologies, products and services support an affordable, reliable power system reduce air pollution & greenhouse gas emissions

3 2016 BCSE Members


4 2016 SUSTAINABLE ENERGY IN AMERICA Factbook GET THE FACTS No portion of this document may be reproduced, scanned into an electronic system, distributed, publicly displayed or used as the basis of derivative works without attributing Bloomberg Finance L.P. and the Business Council for Sustainable Energy. For more information on terms of use, please contact Copyright and Disclaimer notice on the last page applies throughout. Developed in partnership with the Business Council for Sustainable Energy.
5
6

7 2015: A YEAR OF MILESTONES
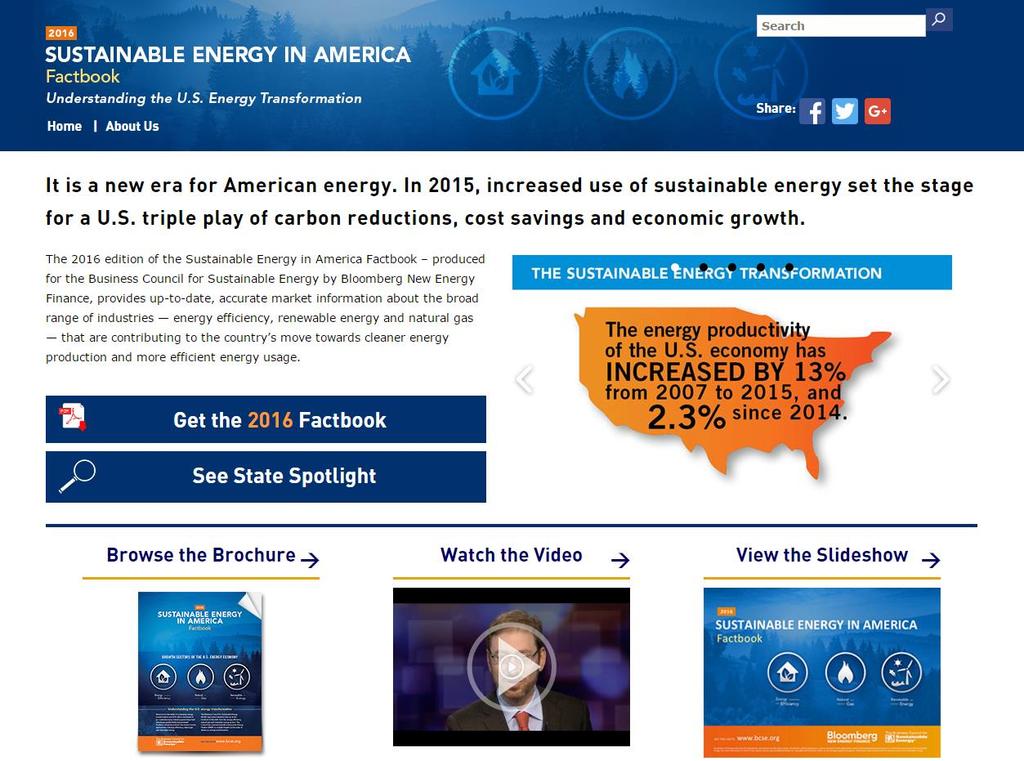
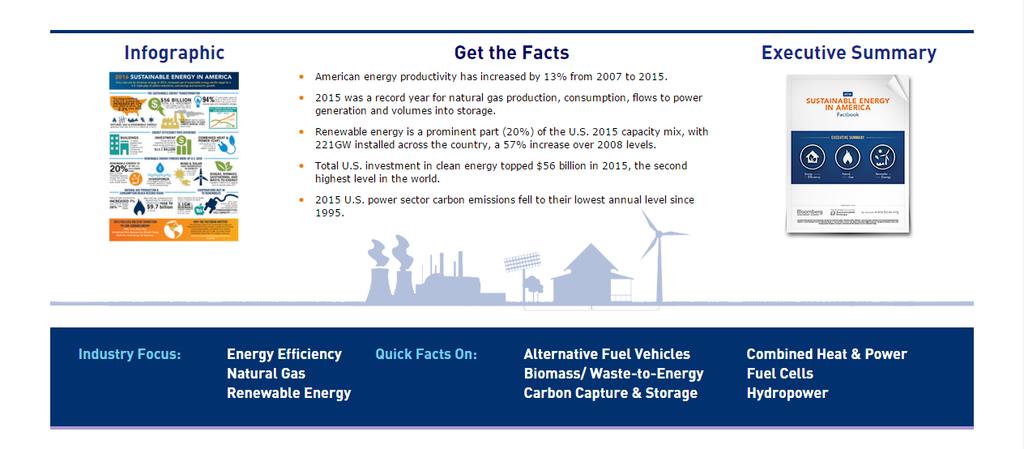
8 US energy overview: Economy s energy productivity: GDP and primary energy consumption (indexed to 1990 levels) GDP (indexed) Primary energy consumption (indexed) The US economy is increasingly energy productive, resulting in a decoupling between growth in GDP and growth in energy consumption. As US GDP expanded 83% over the last 25 years, energy consumption only ticked up 17%. By one measure (US GDP per unit of energy consumed), productivity has improved 56% since 1990, 13% since 2007, and 2.3% between 2014 and Source: US Energy Information Administration (EIA), Bureau of Economic Analysis, Bloomberg Terminal Notes: Values for 2015 energy consumption are projected, accounting for seasonality, based on latest monthly values from EIA (data available through September 2015). GDP is real and chained (2009 dollars); annual growth rate for GDP for 2015 is based on consensus of economic forecasts gathered on the Bloomberg Terminal as of January Bloomberg Finance L.P Developed in partnership with The Business Council for Sustainable Energy. 8
9 Financing: US utility energy efficiency spending and budgets ($bn) budget budget 6.2 budget Natural gas Electric From 2006 to 2011, US utility expenditure for energy efficiency grew 25% per year. The budgeted amount for 2014 would represent a 25% growth between 2013 and Maryland was the state with the largest increase in utility budgets for energy efficiency, with an increase from $119m in 2013 to $292m in In December 2015, US Congress renewed the energy-efficient commercial buildings tax deduction and nonbusiness (ie, residential) Energy-efficient Property Credit that retroactively reinstates tax credits for projects completed in 2015 and Source: CEE, ACEEE, Bloomberg New Energy Finance Bloomberg Finance L.P Developed in partnership with The Business Council for Sustainable Energy. 9
10 Deployment: US natural gas production and gasdirected rig count (Bcfd, rigs) Production (Bcfd) Shale Other lower 48 Rigs Number of rigs 1,800 1,600 1,400 1,200 1, Natural gas production in 2015 was up 7% from 2014 levels, 26% from 2007 levels. Shale production now accounts from almost half of total. Technological improvements in efficiencies (like pad drilling and longer laterals) and drilling in productive sweet spots has allowed production to increase even as rig counts drop. Source: Bloomberg New Energy Finance, EIA, Baker Hughes. Data up through the latest comprehensive numbers available (September 2015). Bloomberg Finance L.P Developed in partnership with The Business Council for Sustainable Energy. 10
11 US energy overview: Greenhouse gas emissions from the power sector (MtCO2e) ,000 2,500 GHG emissions from power sector, e 2, levels 1,500 1,000 CPP target, In 2015, power-sector emissions sunk to their lowest levels (1,985Mt) since 1995 as cleaner-burning natural gas has displaced generation from coal-fired power plants. Emissions are 18% below 2005 levels. The Clean Power Plan targets a 32% cut from 2005 levels by Source: Bloomberg New Energy Finance, EIA, EPA Notes: Values for 2015 are projected, accounting for seasonality, based on latest monthly values from EIA (data available through September 2015). Bloomberg Finance L.P Developed in partnership with The Business Council for Sustainable Energy. 11
12 US energy overview: Retail and wholesale power prices Wholesale power prices ($/MWh) Average retail power prices ($/MWh) NYISO ISONE CAISO PJM MISO ERCOT Northwest New York New England California PJM MISO ERCOT Northwest Florida Southwest Southeast Wholesale prices fell by about a third in 2015, as natural gas prices fell and more renewables connected to the grid. Retail power prices in most regions remain well below the peak prices seen in In 2015, retail electricity rates fell by 1.3% on average nationwide. New York (-5.8%) and Texas (-2.7%) saw the biggest year-on-year declines. Exceptions included California and New England where retail prices rose marginally (1.8% and 1.3%, respectively). Source: Bloomberg New Energy Finance, EIA, Bloomberg Terminal Notes: Data through end-november Wholesale prices taken from proxy power hubs in each ISO. Prices are in real 2014 dollars. Bloomberg Finance L.P Developed in partnership with The Business Council for Sustainable Energy. 12


13 Finance: Corporate procurement of clean energy Renewable capacity contracted by corporations, by technology, (MW) Key players in corporate procurement % 250% 200% 150% 100% 50% Retail Financial & Insurance Tech 0.0 0% Solar Wind Biomass & Waste Fuel Cells Year on year change Manufacturing Corporate procurement of clean energy doubled in 2014 and again in 2015, breaching 3.5GW. Wind and solar are the energy technologies of choice. When procurement levels were low between 2008 and 2012, solar generally made up the majority of MW. After corporate procurement took off in 2013, however, wind has made up the dominant portion of procurement. Google has been the largest player to date, procuring 71MW of solar and 1.6GW of wind. Amazon is second, with 80MW of solar and 458MW of wind contracted in 2015 alone. Large individual projects include Facebook s 202MW purchasing power agreement (PPA) with Shannon Wind Farm in Texas, and Apple s 153MW PPA with First Solar. Source: Bloomberg New Energy Finance, company announcements Note: this slide has been updated to reflect two late-reporting commitments from Google for 0.4GW of wind contracts. Bloomberg Finance L.P Developed in partnership with The Business Council for Sustainable Energy. 13

14 21 June 2016 STATE ENERGY FACTSHEET: PENNSYLVANIA
15 PA ELECTRICITY GENERATION MIX BY TECHNOLOGY, (%) 100% 90% 80% 70% 60% 50% 40% 30% 20% 10% 0% 3% 3% 3% 4% 4% 4% 15% 19% 24% 22% 24% 28% 34% 33% 34% 35% 36% 37% 48% 44% 39% 39% 36% 30% Renewables Gas Nuclear Oil Coal Source: Bloomberg New Energy Finance, EIA 15
16 PA ELECTRICITY SALES AND GENERATION, (TWH) Retail electricity sales Net electricity exports In-state electricity generation Source: Bloomberg New Energy Finance, EIA 16
17 PA ELECTRICITY PRICES RELATIVE TO REGIONAL (PJM) AND US AVERAGES, ( /KWH) PA PJM US average Source: Bloomberg New Energy Finance, EIA Note: PJM is PA s wholesale power market, composed of 13 neighboring states. 17
18 PA NATURAL GAS PRODUCTION AND POWER SECTOR CONSUMPTION, (BCFD) Natural gas production Natural gas consumption in power sector Source: Bloomberg New Energy Finance, EIA 18
19 PA RENEWABLE CAPACITY ADDITIONS, (MW) Wind Solar Biomass, biogas, waste-to-energy Hydro Source: Bloomberg New Energy Finance, EIA Note: includes BNEF data on distributed (ie, residential, commercial, and industrial) solar capacity. 19
20 PA CUMULATIVE RENEWABLE CAPACITY, (GW) Source: Bloomberg New Energy Finance, EIA Note: includes BNEF data on distributed (ie, residential, commercial, and industrial) solar capacity. 20
21 STATES UTILITY ELECTRICITY EFFICIENCY BUDGETS AS A FRACTION OF STATE- WIDE ELECTRICITY REVENUE, 2014 (%) 4.5% 4.0% 3.5% 3.0% 2.5% 2.0% 1.5% 1.0% 0.5% 0.0% MD IL NJ PA IN OH WV DE Source: ACEEE 21
22 UNSUBSIDIZED LCOE OF SELECT TECHNOLOGIES IN THE US COMPARED TO SUBSIDIZED AND UNSUBSIDIZED LCOE OF ONSHORE WIND AND SOLAR PV IN PA, H ($/MWH) CHP Geothermal* Waste-to-energy* Biomass* Solar PV Onshore wind Coal Natural gas CCGT Small hydro US range (unsubsidized) US mid (unsubsidized) PA (unsubsidized) PA (subsidized) Source: Bloomberg New Energy Finance Notes: *LCOE for waste-to-energy in this report is a global estimate; biomass and geothermal LCOEs are Americas region estimates; all other LCOEs in Figure 13 are either US or PA-specific. Variations in PA versus US average result from variations in capacity factor, capex and financing rates. Bars indicate the range of unsubsidized LCOE for each technology in the US. Key policies such as the $23/MWh Production Tax Credit (PTC) and accelerated depreciated (MACRS) bring down unsubsidized LCOEs to subsidized levels. LCOE for combined heat and power (CHP) is for reciprocating engines with CHP. LCOE for small hydro assumes 56% capacity factor, but this can vary significantly depending on annual rainfall conditions. 22
23 Contact Us Lisa Jacobson, President Business Council for Sustainable Energy th Street, NW, Suite 708 Washington, DC