Habibollah Fakhraei, Charles T. Driscoll Department of Civil and Environmental Engineering, Syracuse University
|
|
|
- Janice Ferguson
- 5 years ago
- Views:
Transcription


1 Habibollah Fakhraei, Charles T. Driscoll Department of Civil and Environmental Engineering, Syracuse University National Atmospheric Deposition Program Annual Meeting and Scientific Symposium Portland, ME October 212
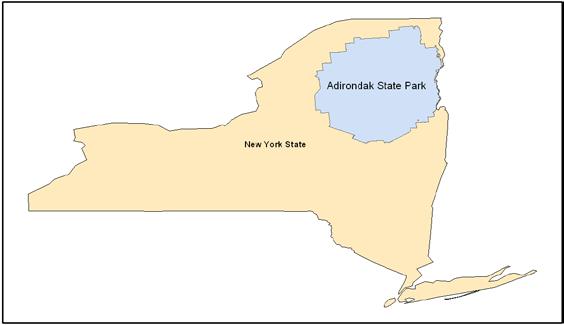
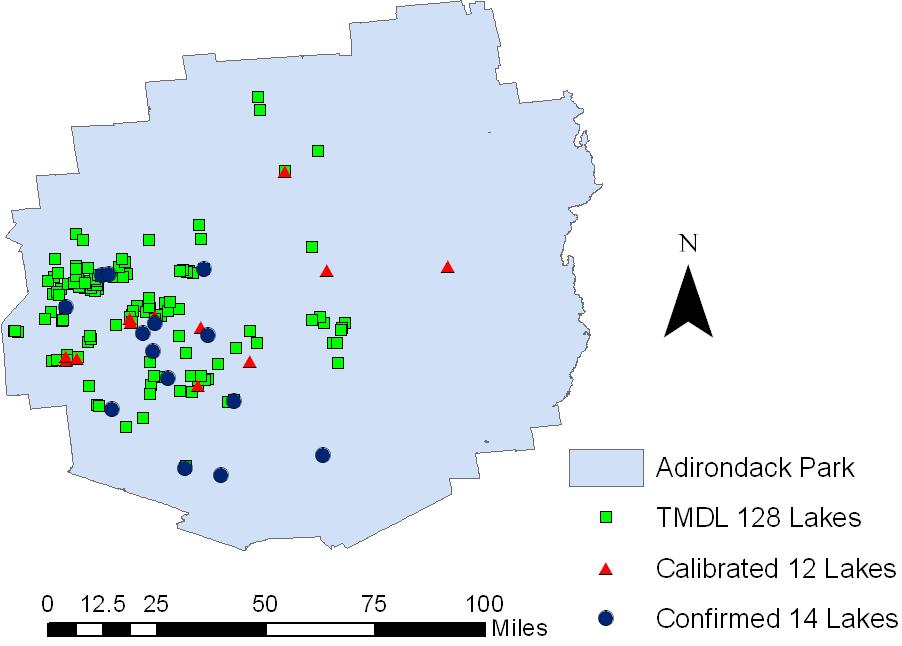
2 Introduction The Adirondack region of NY receives among the highest rates of sulphur and nitrogen deposition in the USA (Driscoll et al., 1991; Stoddard and Murdoch, 1991) The median ph and soil % base saturation of 44 Adirondack lakes decreased from 6.6 and 12.3 % (pre-industrial condition) to 5.9 and 7.9% (near peak acidification), respectively (Zhai et. al.28) NYSDEC designated 128 lakes that are impaired due to acidity which are mostly located in southwestern Adirondacks; critical loads of acidity will be determined for impaired lakes. To develop critical load an integrated biogeochemical model (PnET- BGC) was applied. The model was calibrated by 12 lakes then confirmed by 14 other lakes.
3
4 Calibrated lakes No Lake Surficial geology Lake type DOC HRT SO 4 2- NO 3 - ANC Lab ph µmoles L -1 µmolesl -1 µeql -1 SU 1 Arbutus Lake medium till drainage low Brook Trout Lake thin till drainage low Carry Pond Seepage low Clear Pond thick till drainage low Constable Pond thin till chain drainage low East Copperas Pond thin till drainage high Grass Pond medium till drainage low Middle Branch Lake thin till drainage low Middle Settle Lake thin till drainage low Raquette Reservoir medium till drainage high Squash Pond thin till chain drainage high West Pond thin till drainage low


5 PnET Water balance Photosynthesis Living biomass Litterfall Wet Deposition Dry Deposition Climatic data Solar radiation Precipitation Temperature Net Mineralization Uptake BGC Aqueous reactions Surface reactions Cation exchange Adsorption Humic binding Aluminum dissolution/precipitation Weathering Deep water flow BGC Surface water Aqueous reactions SO4 2-, NO3 - retention

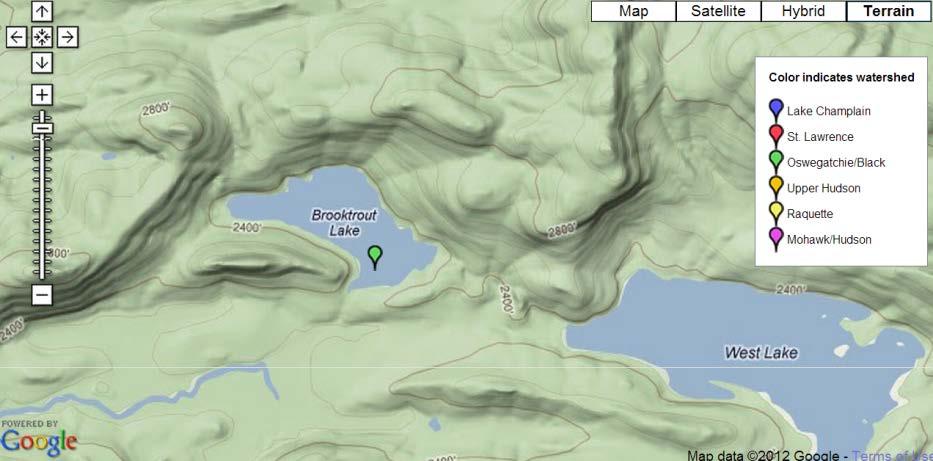
6 Brook Trout Lake (Source: ALSC website,
7 4.5 4 Atmospheric deposition (Model Inputs) 3.5 Deposition (g/m2/yr) SO 4 SO4 Deposition 2% SO4 Reduction 4% SO4 Reduction 6% SO4 Reduction 8% SO4 Reduction 1 1% SO4 Reduction Deposition (g/m2/yr) NO 3 NO3 Deposition 2% NO3 Reduction 4% NO3 Reduction 6% NO3 Reduction 8% NO3 Reduction 1% NO3 Reduction
8 Measured Simulated 8 7 SO 4 SO4(µmol /L) NO 3 NO3(µmol /L)
9 Measured Simulated 6.5 ph 6 ph ANC 2 ANC(μeq/l)
10 1:1 SO4 26 Tested Lakes 1:1 NO Simulated SO4 (µmol/l) Simulated NO3 (µmol/l) Measured SO4 (µmol/l) Measured NO3 (µmol/l) 1:1 ANC 1:1 ph Simulated ANC (µeq/l) Measured ANC (µeq/l) Simulated ph Measured ph
11 8 7 6 Measured Simulated 2% Reduction 4% Reduction 6% Reduction 8% Reduction 1% Reduction SO 4 Brook Trout Lake SO4(µmol /L) NO 3 NO3(µmol /L)
12 6.5 Measured Simulated Target ph (5.4) Target ph (6) 2% Reduction 4% Reduction 6% Reduction 8% Reduction 1% Reduction SO 4 Reduction Scenarios 6 ph NO 3 Reduction Scenarios ph
13 Measured Simulated 2% Reduction 4% Reduction 6% Reduction 8% Reduction 1% Reduction 4 3 SO 4 Reduction Scenarios 2 ANC(μeq/l) NO 3 Reduction Scenarios 2 ANC(μeq/l)
14 26 Tested Lakes Observed Predicted SO4 (umol/l) Observed Predicted NO3 (umol/l) Hindcast (18) Current ( ) Forcast(22). Hindcast (18) Current ( ) Forcast(22) 1. Observed Predicted Target ANC (4 μeq/l) 7. Observed Predicted Target ph (5.4) Target ph (6) ANC ( μeq/l) 4. ph Hindcast (18) Current ( ) Forcast(22) 4. Hindcast (18) Current ( ) Forcast(22) -2.
15 Conclusions This project is in progress; to determine Critical Loads for 128 impaired lakes we will use the data from the simulations of the 26 sites to extrapolate to the population of impaired lakes. Model does a good reasonable job in simulating sulfate and ANC, it is less effective in simulating nitrate and ph. Simulations suggest mean ANC and ph decreased 3 µeq/l and 1 unit, respectively, from pre anthropogenic to current conditions. Simulations suggest that it will take approximately 2 years for lake-watershed to achieve to the steady state. Decreases in sulfate are more effective in increasing ANC and ph than decreases in nitrate.