Modelling the carbon fluxes and budgets on the northwest European continental shelf and beyond
|
|
|
- Martin McDaniel
- 5 years ago
- Views:
Transcription


1 Modelling the carbon fluxes and budgets on the northwest European continental shelf and beyond Jason Holt, Sarah Wakelin, Roger Proctor, Graham Tattersal, James Harle: POL Tim Smyth, Jerry Blackford, Icarus Allen: PML Mike Ashworth: STFC GCOMS
2 The global carbon budget The NW European shelf carbon budget Ocean-Shelf carbon fluxes Shelf sea s contribution to the global budget

3 Global Carbon budget
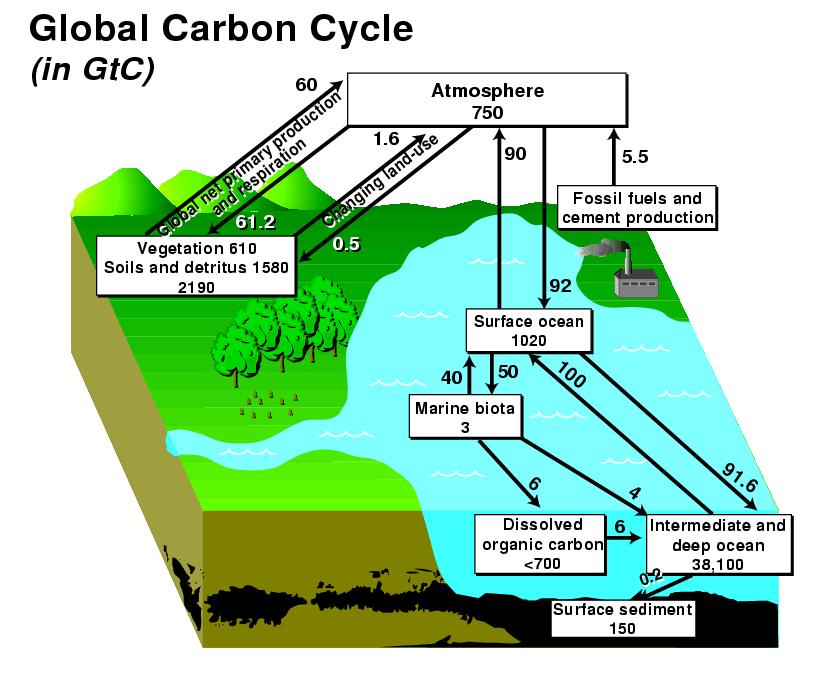
4

5 Satellite estimates of Primary production All the PP hot-spots are coastal Bio-optical takes into account class II waters Not straightforwardly related to carbon drawdown Jan Dec Smyth 2007
6 Ocean Carbon Cycle Air-Sea Flux: F Photosynthesis: P Advection: A oc A ic Dissolved Inorganic Carbon: C io Organic Carbon: C o Sinking: S Pelagic respiration: R P
7 Coastal-Ocean Carbon Cycle Air-Sea Flux: F Photosynthesis: P Advection: A oc A ic Dissolved Inorganic Carbon: C io Organic Carbon: C o Sinking: S Benthic respiration: R B Pelagic respiration: R P Pelagic Benthic Resuspension tides and waves Nutrient re-cycling Benthic coupling Terrestrial coupling (rivers/coast) Units: x10 12 molcyr -1 = 0.012Pg Cyr -1
8 The shelf-sea carbon pump Sea surface Thermocline Deep Ocean Shelf sea Photosynthesis Respiration Mixing Sea bed Section Stratification maintains vertical asymmetry in P-R: drives airsea pco 2 difference. But these seas are often well mixed in winter.
9 Does the shelf-sea pump work? How much of the carbon (drawn-down during the growing seasons) is permanently isolated from the atmosphere? Transport to deep ocean Burial or does it just re-equilibrate with the atmosphere after winter mixing?


10 POLCOMS-ERSEM Net Primary Production 1995 Pelagic Particulates Pico-f Bacteria Phytoplankton Flagell -ates Dino-f Diatoms DIC Si NO 3 NH 4 PO 4 N u t r i e n t s Dissolved Meso- Micro- Heterotrophs D e t r i t u s Aerobic Bacteria Anaerobic Bacteria Consumers Suspension Feeders Meiobenthos Benthic Oxygenated Layer Deposit Feeders Redox Discontinuity Layer Reduced Layer N u t r I e n t s gcm -2 yr -1 Decouples nutrient and carbon cycles mgcm -2 (red = x2 PAR)
11 The AMM simulation ~12 km resolution, 34 s-leves 1987 spinup, 1988 to years POLCOM-ERSEM ERA40 + Operational ECMWF Surface forcing ~300 river flows 15 tidal constituents Time varying (spatially constant) atmos pco 2 Mean annual cycle for Ocean boundaries EO SPM/CDOM Attenuation River nutrient and DIC Validation v s ICES data: ~50% rms error for winter nutrients
12 Time series of air-sea flux Over estimating flux Southern North Sea Northern North Sea Under estimating flux Celtic Sea v s mol C m -2 yr -1 Frankignoulle & Borges (2001)
13 The shelf wide Carbon budget The loss term Small Difference = burial Acidification Equilibrium
14 Carbon export Horizontal advection is the dominant loss term Net advective loss of carbon (subtracting rivers): 1x10 12 mol C yr -1 Net burial: 0.02x10 12 mol C yr -1 But to be an effective sink C must leave the shelf to DEEP water Otherwise may re-equilibrate with atmosphere.

15 North Sea Circulation The main current out of the North Sea is a surface current Shelf-edge: frictional processes: e.g. Ekman draining; coastal downwelling After Turrel et 1992
16 Dividing fluxes according to vertical structure Sea surface Thermocline Deep Ocean Shelf sea Sea bed Section Above: z < thermocline or 150m Below: z >thermocline or 150m
17 Volume fluxes Above: 1.89Sv Below:-1.94Sv This is a downwelling shelf

18 The slope current Expected range Sv
19 Ekman draining Sea surface Shelf sea Deep Ocean Q ek ~(C d /f)(q/wh) 2.L Sea bed Q=2Sv, w=36km L=700km H=500m Q ek =0.4Sv

20 Inorganic Carbon flux Above: Below: Net:-5.4 Air-sea flux: 1 Rivers: 2.4 x10 12 molcyr -1
21 Ocean-shelf anomaly flux Subtract flux associated with mean concentration: Fanom=F-CFvol should time/depth average to zero <Fvol+Frivs> ~ 0 Above thermocline x10 12 mol C yr -1 inorganic x10 12 mol C yr -1 organic Below thermocline x10 12 mol C yr -1 inorganic x10 12 mol C yr -1 organic Errors from winter nitrate values
22 Total anomaly fluxes C-fluxes associated with high DIC: Total loss to deep ocean : x10 12 mol C yr -1 Total ocean-shelf exchange: x10 12 mol C yr -1 Air-sea: x10 12 mol C yr -1 Thomas et al mol C m -2 yr -1 for north sea x area of whole shelf: 1.7x10 12 mol C yr -1 Efficiency: Loss to deep ocean / Gross PP = 1.1/16.0 ~7%
23 Role of the slope current Acts to replenish on-shelf nutrients (positive correlation with summer organic carbon) Acts to remove DIC (negative correlation with summer inorganic carbon) Together it helps drive the continental shelf carbon pump.
24 Global contribution (in perspective) 0.01 Pg Cyr -1 of ~2 Pg Cyr -1 Global biological pump 1.5 Pg Cyr -1 of ~90 Pg Cyr -1 Global downwelling flux 7% efficient compared with ~20% Globally (EP/PP) How does this up-scale to shelf seas globally?

25 Importance of Costal Ocean to Global Carbon Budget: extrapolating sparse observations Borges (2005) Do we have enough pieces of the jigsaw to integrate CO2 fluxes in the coastal ocean? Estuaries, 28, 3-27 Including coastal seas increases oceanic uptake from 1.6 to 1.9 PgCyr -1 (increase is largest at high latitudes) But with estuaries and salt marshes coastal-ocean becomes a source of CO2 and reduces oceanic uptake to 1.4 PgCyr -1 i.e. not even certain of the sign!
26 Importance of Costal Ocean to Global Carbon Budget Important part of marine component of carbon cycles Highly susceptible to change Human influence Climate variability Closely balanced between being a source or a sink Largely absent from earth system models
27 Approaches for including shelf seas in Earth System Modelling Variable resolution global model ICOM Fine resolution global model (<1/4 o ) Re-focus on vertical co-ordinates/mixing schemes NEMO-shelf Nested Coastal-Ocean model The patch work approach: GCOMS Parameterised coastal-ocean Use a-priori (stationary, high-resolution) information to improve coastal-ocean representation on coarse-grid If resolution required is x10 v s deep ocean, computer resource required is 10 2 x0.07~x 7 (or x70 with time step)

28 The Global Coastal Ocean Modelling Project Run regional shelf-sea models for all of the coastal regions around the world to improve our estimates of their contribution to the global carbon cycle 55 Domains: Each fits comfortably on a typical local cluster Flexible execution strategies Aligned to QUEST Forms part of the Carbon-theme in the new NERC centre for Earth Observation
29 Conclusions The NW European shelf has a downwelling circulation This enables efficient carbon sequestration despite the lack of export flux of POC The net air-sea C-flux closely matches the flux to deep ocean This model provides LOWER bounds on C- fluxes The global implications of the shelf-sea pump are largely un-quantified