Day 1: Confidence Intervals, Center and Spread (CLT, Variability of Sample Mean) Day 2: Regression, Regression Inference, Classification
|
|
|
- Randall Fields
- 5 years ago
- Views:
Transcription
1 Data 8, Final Review Review schedule: - Day 1: Confidence Intervals, Center and Spread (CLT, Variability of Sample Mean) Day 2: Regression, Regression Inference, Classification Your friendly reviewers today: Hari Subbaraj, Rohan Narain, Ryan Roggenkemper, Howard Ki, Claire Zhang
2 Data 8, Final Review Review schedule: - Day 1: Confidence Intervals, Center and Spread (CLT, Variability of Sample Mean) Day 2: Regression, Regression Inference, Classification Your friendly reviewers today: Hari Subbaraj, Rohan Narain, Ryan Roggenkemper, Howard Ki, Claire Zhang
3 Confidence Intervals Situation: we want to use a sample to estimate a parameter of interest First step: we come up with an estimator/statistic to estimate the parameter For example, sample mean to estimate population mean Problem: taking a sample (usually) involves randomness! How do we know how good our estimate is? Idea: take many samples, see how much the estimate varies

4 Confidence Intervals This gave us the sampling distribution of the estimator What s the problem? We usually don t have the whole population to re-sample from Resampling is expensive and timely
5 Confidence Intervals Solution: assume our sample has a similar make-up to the population (the sample is representative of the population) Resample (with replacement) from the original sample Our resamples will be the same size as the original sample Bonus question: why does it have to be with replacement? Compute the same statistic/estimate for each resample This gives us an approximation to the true sampling distribution! This process is often called the bootstrap
6 Confidence Intervals Let s see an example where we want to estimate the average height in the population! Suppose we have a sample of 100 heights in a table called samp
7 Confidence Intervals
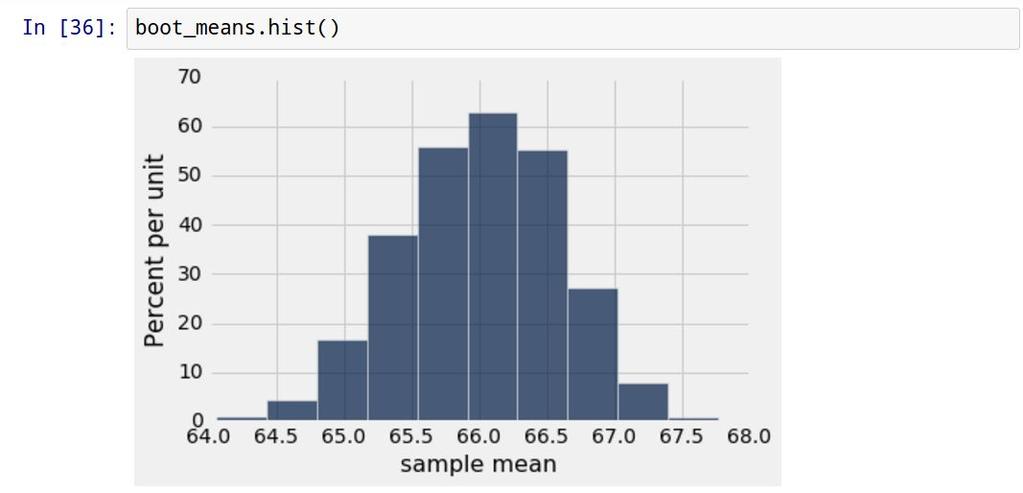
8 Confidence Intervals
9 Confidence Intervals Great! Now we have an idea of how our estimate varies when we take different random samples. Plots are awesome, but sometimes we want a more concise summary. That s where confidence intervals come in. Idea: give a range of likely values for our estimate. Often we pick the middle 95% of our data. How? Use the percentile function!

10 Confidence Intervals Conclusion: we are 95% confident that the population mean is between and
11 Interpretation of Confidence Intervals There is not a 95% chance that the true population parameter is in our calculated 95% confidence interval It does also not tell us anything about the whole population Just the population parameter we re attempting to estimate If we repeat the idea of making 95% confidence interval many times, we expect 95% of them to contain the true population parameter It either is or is not We will never actually know, as we don t know the population parameter The larger our confidence, the larger the interval An 80% confidence interval is contained inside of a 90% interval
12 Hypothesis testing via confidence intervals Suppose we have a hypothesis test at the 0.05 level: Null: population mean = 50 Alternative: population mean 50 Construct a 95% confidence interval for the population mean Reject the null if confidence interval does not contain 50 Motivation: confidence interval contains set of "plausible" values for population parameter. If 50 is not a plausible value for the parameter, the hypothesis that the parameter is 50 is likely misguided Confidence level of interval should reflect significance level of test. e.g. For test at 0.01 level, use 99% confidence interval Why is this important?
13 Data 8, Final Review Review schedule: - Day 1: Confidence Intervals, Center and Spread (CLT, Variability of Sample Mean) Day 2: Regression, Regression Inference, Classification Your friendly reviewers today: Hari Subbaraj, Rohan Narain, Ryan Roggenkemper, Howard Ki, Claire Zhang


14 Center and Spread Ways to measure the center Mean: Sensitive to outliers Median: Not so sensitive to outliers Ways to measure the spread Standard deviation: Root mean square of deviations from the average Variance: SD^2 (Mean square of deviations from the average)
15 Center and Spread: Normal Distribution Normal distribution: Bell shaped Center and spread tells us useful information about the normal curve Compared with Chebyshev bounds, these are much stronger!
16 Central Limit Theorem The probability distribution of the sum (or average) of a large random sample drawn with replacement will be roughly normal, regardless of the distribution of the population from which the sample is drawn


17 Central Limit Theorem Distribution of Original Sample Distribution of Sample Means
18 Conditions for the Central Limit Theorem You re taking random samples from a population. The sample size is kinda large. The statistic you re computing is the sum/average or some variant. You re looking at the probability distribution of the statistic (or a valid approximation of it). Not conditions: The population must have a Normal distribution a. If this were necessary, the theorem really wouldn t be worth remembering! The sample size has to be large relative to the population size. a. No need, that s the magic of sampling! You are trying to estimate the population mean a. All that matters is the estimator, not your interpretation of it!
19 Variability of the Sample Mean Imagine sampling, many times, and calculating the mean of our sample to get a rough picture of what the population mean is Want to measure the standard deviation of all possible sample means Measure how far off sample means are from the population mean Also interpreted as the accuracy of the sample mean Does smaller SD of the means point to more or less accuracy? If you can t get the population SD, use some approximation of it Notice that there s no talk about the number of bootstrap repetitions


20 Variability of the Sample Mean What happens as we change the sample size?
21 Central Limit Theorem The CLT states that the probability distribution of the sample mean is roughly normal, centered at the population mean, with SD equal to the formula below