Assessing Variability in Petroleum Vapor Intrusion
|
|
|
- June Hart
- 5 years ago
- Views:
Transcription

1 Assessing Variability in Petroleum Vapor Intrusion Jim Weaver United States Environmental Protection Agency Office of Research and Development National Risk Management Research Laboratory Ground Water and Ecosystem Restoration Division Ada, Oklahoma Tom Walker United States Environmental Protection Agency Office of Underground Storage Tanks Washington, DC
2 Outline Vapor Intrusion and Petroleum Vapor Intrusion Characteristics of Environmental Models PVIScreen model Examples Cumulative Frequency Curves Screen Shots Availability and Peer Reviews
 petroleum (right) are distinguished by prospects for")
3 Vapor Intrusion and Petroleum Vapor Intrusion Chlorinated Solvent (left) petroleum (right) are distinguished by prospects for biodegradation
4 Why vapor intrusion and models? Technical Challenges ambient air contamination, internal sources/sinks, temporal changes Social RP or homeowner reluctance to sample In some cases redeveloping a site no building exists for testing, so models are relied upon
5 Vapor Intrusion and Models Series of articles in the Denver Post in 2000 The vapor intrusion model (Johnson-Ettinger) over-predicted indoor air concentrations sometimes and under-predicted indoor air concentrations sometimes Model used with defaults and very few site specific values Model used to screen-in/screen-out sites absent a guidance Context of model use in site assessment not established
6 Example: Darcy s Law Darcy flux q = -K dh/dl Relationship from Darcy s sand tank experiments Empirical coefficient, the hydraulic conductivity (K), from experiment: measuring the flow (q) Material Value (m/d) Gravel 10 2 to 10 4 Sand 10-1 to 10 3 Clay 10-8 to 10-3 Sandstone 10-5 to 10 Basalt 10-6 to 10-2
7
8 PVIScreen PVIScreen includes: BioVapor equations, recoded in Java Johnson-Ettinger model if no biodegradation Automated Monte Carlo uncertainty analysis A petroleum hydrocarbon lens as a source (can be omitted to create soil sample or soil gas source +water sample source (?) Flexible and customizable unit choices User Interface Automated Report Primary raison d être To make uncertainty analysis practical by giving a prediction and estimate of its uncertainty
9 1.0 frequency A constant 0.0 parameter value 1.0 frequency frequency parameter value Uniform distribution: min, max Data-driven empirical distribution Inputs Multiple Model Runs Results 1.0 frequency 0.0 Results: indoor air concentration 0.0 parameter value All other inputs, Other distributions can be used: Triangular, truncated normal Log normal
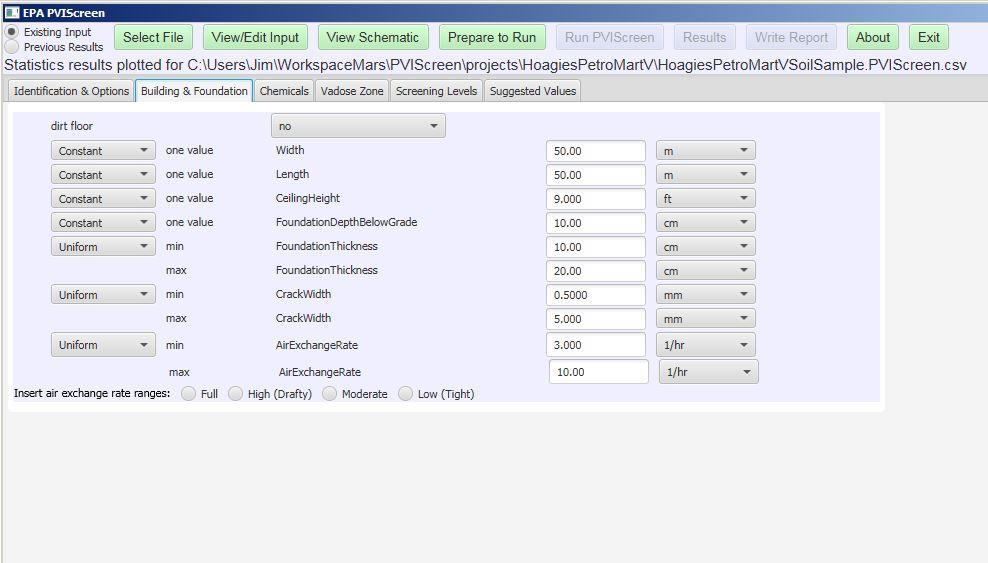
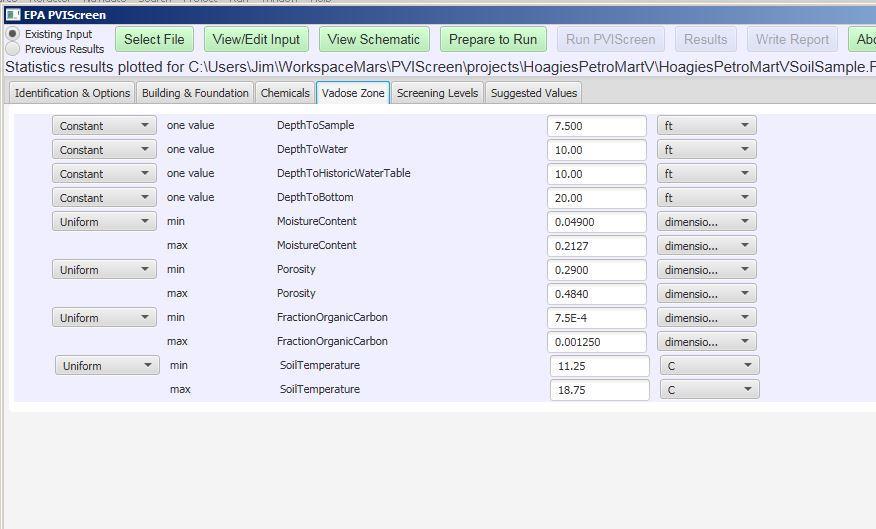
10 Example Problem Definition Reformulated Gasoline, BTEX + TPH Groups NAPL lens Some of the variable parameters Air Exchange Rate 0.1 to 1.5 hr -1 Moisture content 0.05 to 0.2 Porosity 0.3 to 0.5 Fraction Organic Carbon to Q soil 1 to 10 L/min Crack width 0.5 to 5 mm
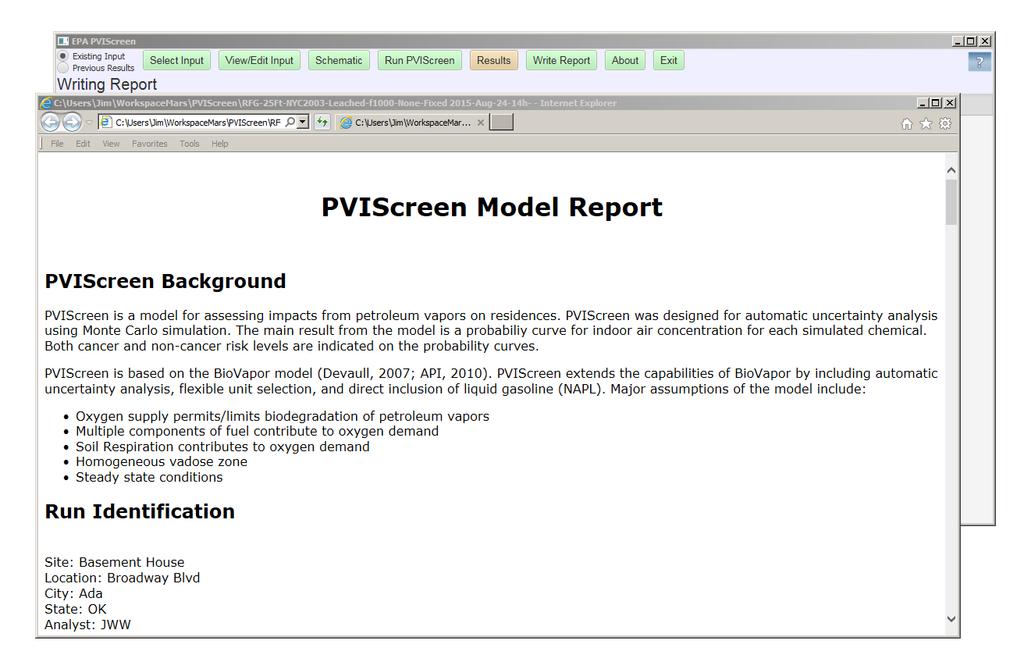
11 A simulation always must begin with an existing and compl Input file: template files are provided.
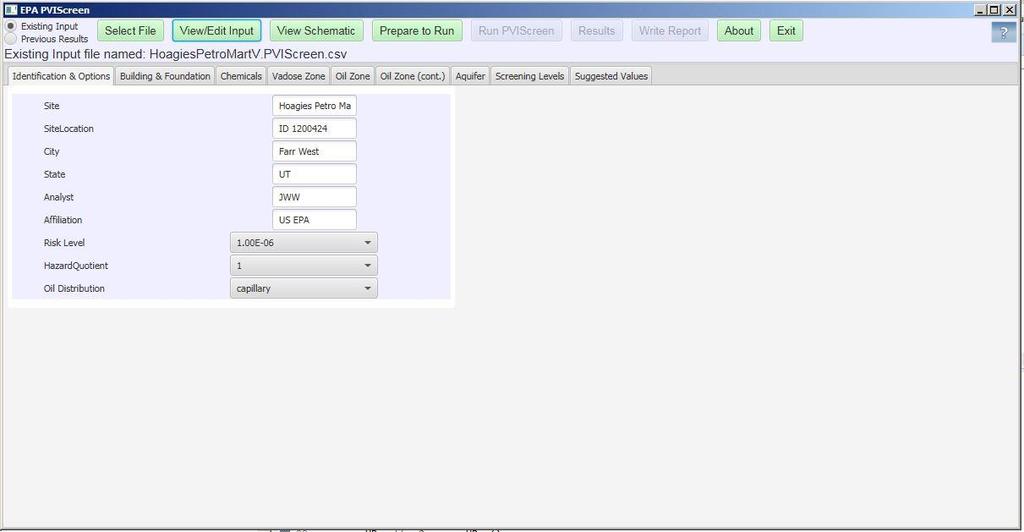
12 Run ID
13

14 Note to Self: need to have as many petroleum components Included as possible to account for oxygen demand: i.e., carbon fractions or TPH
15
16

17 Unlikely for practitioners to have better estimates and Arcane model focused parameters.

18 Check out all these spatial relationships!
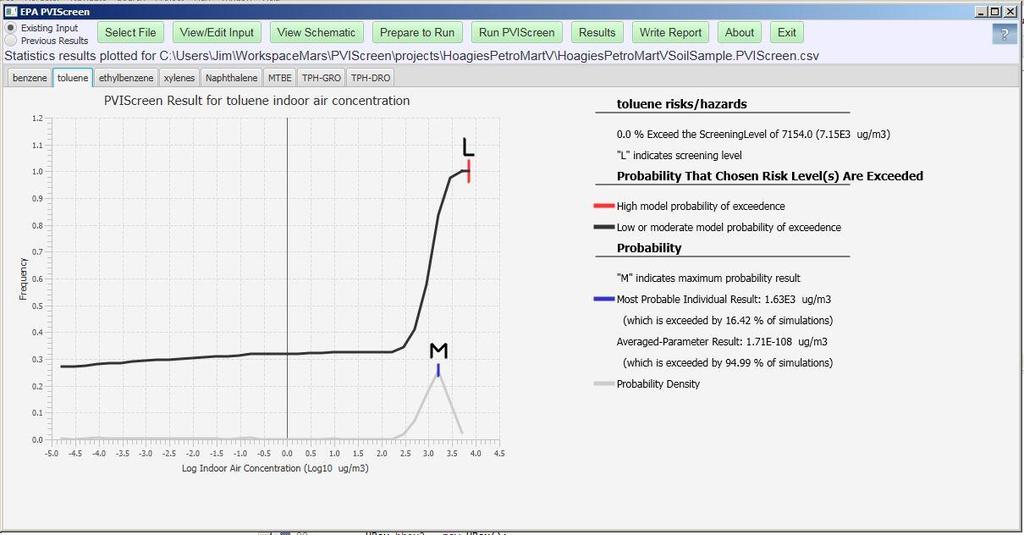
19 Results: Two forms graphic and table L = screening level; state, fed, tribal specified level M = most probable result
20 Tabular Results for Benzene
21 Graphical Results Frequency 0.0 to 1.0 L= screening level M = most probable Concentration (Log μg/m 3 )
22 Composite of 1,000 model runs Frequency 0.0 to 1.0 L= screening level M = most probable Concentration (Log μg/m 3 )
23 Graphical Results Frequency Example: 33% 0.0 to 1.0 of results <= 10 L= screening level μg/m 3 M = most probable Concentration (Log μg/m 3 )
24 Red Curve Indicates Potential Problem Frequency 0.0 to 1.0 L= screening level M = most probable Concentration (Log μg/m 3 )
25
26
27 Hoagies Petro Mart V Farr West, UT Site # 1
28 1.2 acre site Site Facts 2,400 sq ft convenience store, slab on grade Farmland North & West Major road w/ houses South & East Leak discovered Feb 2013 Lost inventory - ~ 1,500 gallons Faulty submersible pump in UST that pumps product to fuel dispenser

29 Benzene & LNAPL Thickness Monitoring Event Hoagies Petro Mart, Farr West, UT UDEQ Facility # , NAF <0.001 Farm Land A NE < < A SW 2-inch diameter GW monitoring well inch diameter GW monitoring well Vapor Monitoring Point 3.17 Soil contamination >UDEQ Screening Levels < Benzene, mg/l 1.35 LNAPL thickness, feet Groundwater Flow Direction Horizontal Scale, feet
30 Feet Below Grade A SW Hoagies Conceptual Site Model & X-Section Outdoor Air Benzene 0.42 ug/m3 TPH-gro <100 ug/m3 Convenience Store Indoor Air Benzene 55 ug/m3 TPH-gro 2150 ug/m3 A NE 0 Sub-Slab MW-16 MW-12 MW-8 MW-3 Sub-Slab Back Room Main Store 5 Clay, lean, sandy Silt, sandy Benzene 17,000 ug/m3 TPH-gro 8,900,000 ug/m3 O2 11 % CO2 4.6 % Benzene 850,000 ug/m3 TPH-gro 57,000,000 ug/m3 O2 8.3 % CO2 <8.4 % 10 Silt, elastic, moist Clay, fat, moist Sand, lean clay, moist, saturated Benzene 16.6 mg/kg TPH-gro 1260 mg/kg Benzene 32.4 mg/kg TPH-gro 5280 mg/kg 15 Benzene 0 mg/kg TPH-gro 0 mg/kg Sand, lean clay, moist Clay, lean, sandy 20 Sand, wellgraded Benzene 3.74 mg/kg TPH-gro 370 mg/kg Clay, fat, sandy Clay, fat Step 1: Emergency? NO Step 2: Characterize Site, Develop CSM, Precluding Factors? YES LNAPL plume not stable, in close proximity to building slab Step 3: Buildings within Lateral Inclusion Zone? YES Step 4: Sufficient Vertical Separation? NO LNAPL source 5 ft below building slab, 15 ft required Step 5: Sub-slab vapor and IA/OA sampling indicate PVI? YES Step 6: Mitigation: Indoor air filters, building demolition and source removal 0 40 Horizontal Scale, feet


31 Case Study 2: Hoagies, Farr West, UT IA, ug/m 3 Benzene 55 TPH-g 2200 MW On-Site Convenience Store Sub-Slab VMP OA, ug/m 3 Benzene 0.42 TPH-g <100 5 ft LNAPL Soil Vapor, ug/m 3 Benzene 850,000 TPH-g 85,000,000 O2 8.3% CO2 8.4% Soil, mg/kg 6 ft Benzene 32.4 TPH-g 5280 Step 1: Emergency? NO Step 2: Characterize Site, Define Extent & Degree of Contamination, Develop CSM No Precluding Factors: no pref. pathways or lead scavengers, <10% ethanol Step 3: Buildings within Lateral Inclusion Zone? YES Step 4: Sufficient Vertical Separation? NO LNAPL soil & GW sources, 15 ft required Step 5: Sub-slab vapor sampling indicate PVI? YES Step 6: PVI Mitigation: Indoor air filtration, source removal (building demolition & excavation most effective)
32 Site Investigation (cont.) Note: PVIScreen could be used before this stage as a predictive tool to help decide in sub slab or indoor air measurements are needed Foreshadowing Sub slab and indoor results Sub-Slab sample values 3 4 orders of magnitude >> the UT Tier II screening values Indoor sample values 1 2 orders of magnitude >> the UT Tier II screening values Outdoor vapor sample < indoor sample, thus, ambient air NOT a source

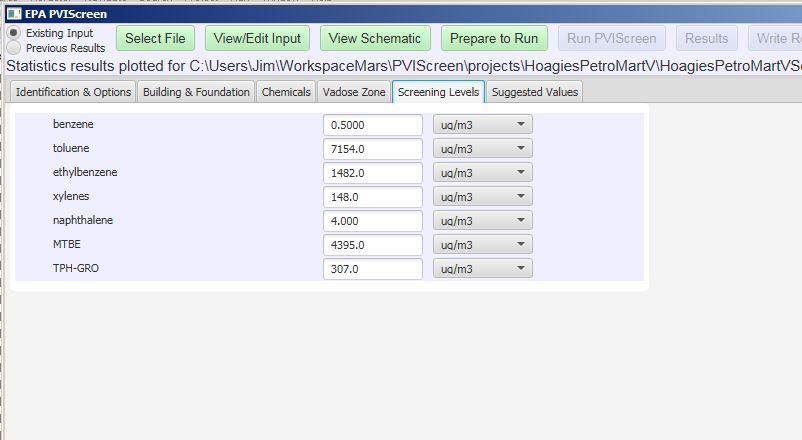
33 Table 4. Indoor and outdoor air, and sub-slab soil vapor samples collected in April 2015, indicate TPH, gasoline, and benzene levels exceed risk-based screening levels for commercial indoor air (contaminants exceeding screening levels are highlighted).

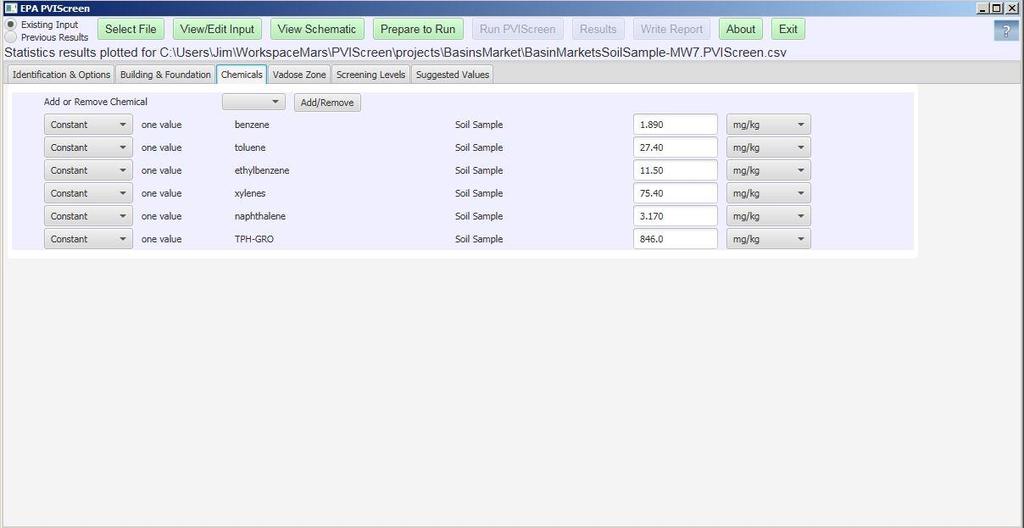
34 Soil Values
35 L = screening level; state, fed, tribal specified level M = most probable result
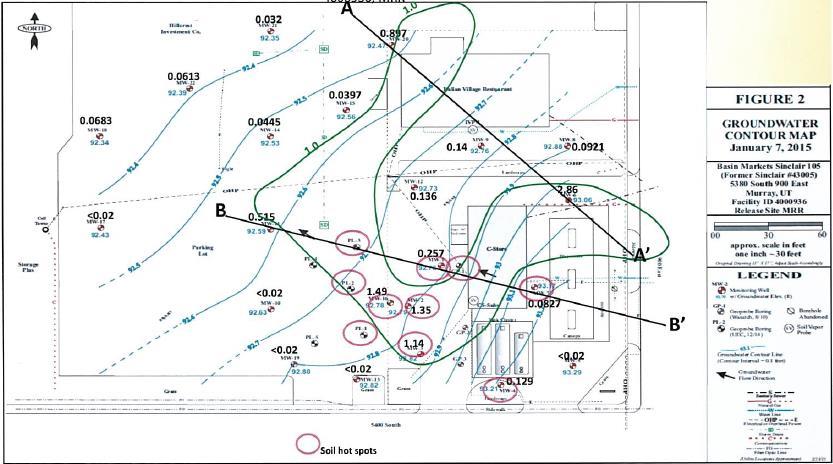
36 Basin Market Sinclair 105 and Italian Village Restaurant Murray, UT Site # 2
37 Site Facts ~ 1/3 acre corner gas station 2,000 sq foot store, 4,800 sq ft restaurant Restaurant and parking lot North & West Major road with businesses South & East Release reported August 2010 Active station w/ two 10K & one 8K gal USTs In 1988 former USTs were removed and some remediation occurred in 1990 Release(s) assumed to be spills/ overfills
38
39 Feet Below Grade Conceptual Site Model & X-Section: On-Site Convenience Store A Basin Market A Property Line Sinclair WNW Convenience Store ESE 0 Sub-Slab MW-11 PL-3 MW-1 GP-1 MW-7 VMP Silty sandy gravel fill Benz ug/m3 5.4 TPH-gro ug/m3 <100 O2 % 21% CO2 % <0.2% % 0.26% 5 Silty sand Benzene 17.9 mg/kg TPH-gro 2660 mg/kg Benzene mg/l Benzene mg/l Benzene 4.96 mg/kg TPH-gro 2140 mg/kg Benzene mg/l Sand Gravelly sand Presence of LNAPL defined by Benzene >10 mg/kg, TPH >100 mg/kg for unweathered gasoline Vertical Separation Distance Top of LNAPL to foundation = 5 ft (<15 required for screening out) Sub-slab vapor monitoring screens out PVI Pathway: 0.03 (33.33-fold) slab attenuation factor (EPA 2015) 5.4 ug/m3 X 0.03 = ug/m3 predicted IA 29 ug/m3 X 0.03 = 0.87 ug/m3 predicted IA Benzene 6.55 mg/kg TPH-gro 3410 mg/kg Thinly interbedded silt & sand Benzene 1.89 mg/kg TPH-gro 846 mg/kg Acceptable IA benzene, commercial = ug/m3 (EPA 2002, 2015) 0 GW Flow LNAPL Dissolved Horizontal Scale, feet 80
40 Sample Location Benzene mg/kg Soil Data TPH mg/kg GP ,140 8/12/10 GP ,000 8/12/10 MW ,410 2/10/11 MW ,060 2/10/11 MW ,910 2/10/11 MW ,200 2/10/11 MW /11/11 MW ,170 12/5/13 PL ,770 12/10/14 PL ,320 12/10/14 PL ,660 12/10/14 Date Collected
41
42 Basin Market Result: Potential for PVI
43 Feet Below Grade 0 B NW Conceptual Site Model & X-Section: Off-Site Restaurant MW-20 Italian Village Restaurant Property Line SVP-1 3ft MW-9 MW-6 B SE Gravel,silty sandy fill Benz ug/m3 <3.2 TPH-gro ug/m3 210 O2 % 21% CO2 % <0.2% % 0.45% 5 Silt Sand, silty Benzene mg/l Benzene mg/l Benzene mg/l GW Flow 10 Sand Benzene mg/kg TPH-gro 44.8 mg/kg Sand, silty 15 Silt Low-strength dissolved source is off-site & in close proximity to building Vertical Separation Distance Top of Dissolved Source to foundation = 7 ft (6 required for screening out) Near-slab vapor monitoring screens out PVI Pathway: 0.03 (33.33-fold) slab attenuation factor (EPA 2015) 3.2 ug/m3 X 0.03 = ug/m3 predicted IA 5.1 ug/m3 X 0.03 = ug/m3 predicted IA 0 Horizontal Scale, feet 60
44

45 Italian Village Benzene Result: No expectation for PVI
46 In Conclusion Model parameters are uncertain or unmeasured Models can be used to confirm conceptual model derived from field data PVIScreen can be used prior to subslab or indoor air sampling to aid decision-making (i.e., to sample more or not)
47 PVIScreen PVI Contacts Jim Weaver ) PVIScreen, modeling (ORD, Ada OK) General Questions Hal White ) Technical issues (OUST) Tom Walker ) ITRC PVI Liaison (OUST) Will Anderson ) Policy-related issues (OUST) Robin V. Davis, P.G., ) Technical Guide For Addressing Petroleum Vapor Intrusion At Leaking Underground Storage Tank Sites (EPA 510-R ) pvi-guide-final pdf Retired Environmental Scientist/Project Manager, Utah Department of Environmental Quality