Roland Ottolini, PE Director, Lee County Division of Natural Resources 09/11/2018
|
|
|
- Blake Grant
- 5 years ago
- Views:
Transcription

1 Roland Ottolini, PE Director, Lee County Division of Natural Resources 09/11/2018 1
2 What is a watershed? What is the State of Lee County s Watersheds? Defined by recent extreme events? Flooding 2017 Harmful Algal Blooms Lee County Actions Flood Remediation Water Quality TMDL / C2020 Support State and Federal Initiatives 2

3 Lee County Waterways & Historic Watersheds Flowways Flowway Arrows Historic Flowway Connections 3

4 4
5 INVEST 92L & HURRICANE IRMA: RAIN EVENTS What Happened What we Found Assessment Observations What we are Doing Remediation Efforts What We are Proposing Long-Term Planning Effort 5


6 6

7 Hurricane Irma Rainfall Total 9/9/17-9/11/17 7

8 20-Day Rainfall Totals & Frequency 8/23/17 9/11/17 8
9 PHASE Immediate Storm Debris Removal from Obstructed Waterways Orange River, Bedman Creek, Hickey Creek, Estero River, EMDD, County Canals PHASE Flood Assessments Identify Impediments to Storm Flow for Near Term or Short Term Remedial Efforts PHASE Long Term Plan Stormwater Master Plans Updates to Address Long Term Remedial Projects 9

10 10
11 FINDINGS Rainfall/ Runoff Impediments to Flow Permitting Observations Long Term Planning 11
12 RAINFALL & RUNOFF Invest 92L (August 22-25, 2017) & Hurricane Irma were major rainfall events singularly and cumulatively. Storm frequency depended on location within County Impacts to multiple jurisdictions municipalities, agencies, private property Drainage system was overwhelmed by generated runoff resulting in extensive flooding, exceeded most design standards & natural carrying capacity of creeks, streams, rivers Water levels did not fully recover from Invest 92L before Hurricane Irma arrived Storm surge in the Caloosahatchee restricted discharge capabilities of tributaries (Orange River, Bedman, Hickey Creek) 12


13 12.74 in Rainfall figures from Page Field 3.79 in Charley in 13
14 WSEL TENMILE CANAL AT OLD US 41 WEIR Source: USGS Station Approximate Conversion NGVD = NAVD88 HW 8/228/ HW 9/11/ WSEL NGVD Previous wet season /1/2016 1/31/2016 3/1/2016 3/31/2016 4/30/2016 5/30/2016 6/29/2016 7/29/2016 8/28/2016 9/27/ /27/ /26/ /26/2016 1/25/2017 2/24/2017 3/26/2017 4/25/2017 5/25/2017 6/24/2017 7/24/2017 8/23/2017 9/22/ /22/ /21/ /21/
15 Imperial River at Felts Avenue 2017 Water Elevations Imperial River at Bonita Grande 2017 Water Elevations 15
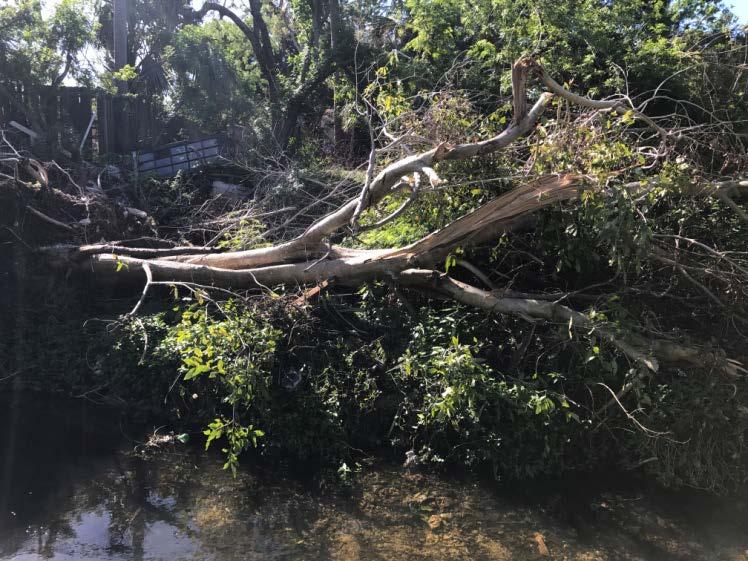
16 IMPEDIMENTS TO FLOW Inventory Created Based on Field Observations Vegetation excessive growth Debris-blocking catch basins, culverts, ditches, canals- existing & storm generated Fences across waterways Erosion and siltation Structural failures- culverts, private bridges, control structures Effected the depth and duration of flooding Multi-jurisdictional, lack of system continuity and inconsistent O&M Removing blockages can bring back built capacity at best, flooding still expected for similar sized storm events 16


17 17


18 18


19 19

20 20
21 Homes Built To Current FEMA 100 Year Elevation Were Not Flooded (Post 92) Rainfall Event Exceeded Design Capacity Of System Permit Criteria Addresses Differing Elements Of The Community: Road Elevations, Stormwater System, House Pads, Dialogue With SFWMD Recommended Development Patterns Impact Flooding - Master Planning Lack Of Continuity Throughout Watershed, Multiple Entity/Jurisdictions, Lack Of Downstream Impact Review Older Development Has Encroached Into Floodways & Reduced Historic Conveyance Capacity Need for Communities to Maintain Stormwater System in Accordance With SFWMD Permit Board of County Commissioners - Work Session 03/06/


22 22


23 23

24 24


25 100 Year 25 Year 5 Year Pond Estuary
26 LONG-TERM PLAN Obtain professional consultant services to provide an overall assessment of different geographic regions of the county regarding surface water management. The goal of this project is to establish plans to reduce flooding on a larger regional scale. Additional survey data as necessary Hydrology/ Hydraulic Modeling for a series of storm events Project alternatives analysis- cost/ benefit Public participation Prioritization, budgeting, cost share, grants, design, permitting, construction, O&M 26
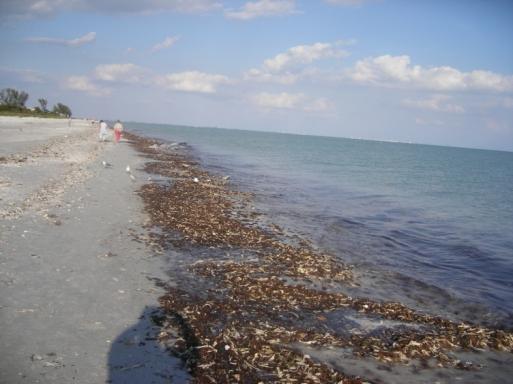
27 Harmful Algal Blooms (HABs) Blue Green Algae cyanobacteria microcystis toxic species Red Tide Karenia brevis Red Drift Algae Gov Scott Emergency Order $3.9m funding to date through FDEP Over 200,000 gal of blue/green algae slurry collected Over 2100 tons of marine debris collected 27

28 28

29 29


30 30

31 31

32 32

33 33
34 C2020/ TMDL Water quality efforts locally focus on TMDL compliance Total Maximum Daily Load- basically the amount of a certain pollutant that the waterbody can naturally assimilate and maintain healthy conditions. Often measured in lbs per year Caloosahatchee is impaired for nutrients (Nitrogen) which requires a 150,000 lb per year reduction through projects and programs C2020 parcel ranking criteria giving more weight to water quality 34


35 Powell Creek Preserve Popash Creek Preserve 35
36 State and Federal Initiatives Much of our water quality is influenced from lands and actions outside of Lee County TMDL east of Franklin Locks Everglades Restoration CERP CEPP Herbert Hoover Dike C43 Reservoir EAA Reservoir North Lake Okeechobee 36
37 DISCUSSION QUESTIONS qualityinfo 37