TRANSITION TO A 100% RENEWABLE ENERGY SYSTEM FOR NIGERIA
|
|
|
- Anis Parks
- 5 years ago
- Views:
Transcription
1 TRANSITION TO A 100% RENEWABLE ENERGY SYSTEM FOR NIGERIA Ayobami S. Oyewo, Arman Aghahosseini and Christian Breyer Lappeenranta University of Technology, Finland Neo-Carbon Energy 8th Researchers Seminar, Lappeenranta, August 23-24, 2017
2 Agenda Motivation Methodology and Data Results Off-grid electrification Summary 2
3 Introduction Access to reliable energy remains a challenge in many regions in Sub-Saharan Africa, as well as Nigeria. Over 90 million people in Nigeria lack access to grid electricity (55% of the country s population). The Nigerian Vision 20:2020 aims at a holistic economy transformation and identifies several barriers to the country s economy The barriers include erratic power supply, poor and crumbling infrastructure and high reliance on the oil sector The Nigerian Vision 20:2020 recognises the significance of renewable energy (RE) resources. This study presents the role of storage technology in a least cost electricity system for Nigeria, towards a 100% RE transition pathway. 3
.")
4 Current status of the power plant mix Key insights: Current power system is dominated by fossil gas and hydropower. 85% of the installed capacity is fuelled by gas. Nigeria has 12.5 GW installed capacity, of which, only 3.9 GW is operational (January to 15 th of August, 2015). Nigeria still experiences setbacks with regards to grid based electricity consumption, at 126 kwh per capita compared to other developing countries. source: Farfan J. and Breyer Ch., Structural changes of global power generation capacity towards sustainability and the risk of stranded investments supported by a sustainability indicator; J of Cleaner Production, 141, Per capita electricity consumption of Ghana and South Africa are 2.9 times (361 kwh) and 31 times (3926 kwh) higher than Nigeria, respectively 4
5 Nigeria s RE potential Resources Small Hydropower Large Hydropower Wind Solar Radiation Estimated Potential 3500 MW 11,250 MW 2 4 m/s at 10 m height (main land) kwh/(m 2 day) (4.2 TWh/day using 0.1% of land area) Biomass Fuel wood 11 million hectares of forest and wood land Animal waste 245 million assorted 2001 Energy crops and agricultural residues 28.2 million hectares of arable land 5
6 Agenda Motivation Methodology and Data Results Off-grid electrification Summary 6

 Aggregated load curve (left) and load curve with prosumers influence (right) for Nigeria in 2050.")
7 Methodology Overview Energy transition pathway from the current fossil based system to 100% RE by 2050 Transition is modelled in 5-year steps No more than 20% growth in absolute RE installed capacity shares compared to total power generation No new fossil fuelled power plants installed after 2015 Least cost RE power plant mix replaces phased out fossil power plants Energy system modelled to meet increasing electricity demand for each time step Research Objective: Find the least cost energy transition pathway for Nigeria. Total Electricity Consumption (TWh) Aggregated load curve (left) and load curve with prosumers influence (right) for Nigeria in
8 Methodology Modelling Objective Definition of an optimally structured energy system based on 100% RE supply optimal set of technologies, best adapted to the availability of the regions resources, optimal mix of capacities for all technologies, optimal operation modes for every element of the energy system, least cost energy supply for the given constraints. Input data historical weather data for: solar irradiation, wind speed and hydro precipitation available sustainable resources for biomass and geothermal energy synthesized power load data gas and water desalination demand efficiency/ yield characteristics of RE plants efficiency of energy conversion processes capex, opex, lifetime for all energy resources min and max capacity limits for all RE resources nodes and interconnections configuration LUT Energy model, key features linear optimization model hourly temporal resolution 0.45 x 0.45 spatial resolution multi-node approach flexibility and expandability enables energy transition modeling 8 Assessment of energy storage technologies in transition to a 100% RE system for Nigeria


9 9 Methodology Full system Renewable energy sources PV rooftop PV ground-mounted PV single-axis tracking Wind onshore Hydro run-of-river Hydro dam Geothermal energy CSP Waste-to-energy Biogas Biomass Electricity transmission node-internal AC transmission interconnected by HVDC lines Storage options Batteries Pumped hydro storage Adiabatic compressed air storage Thermal energy storage, Power-to-Heat Gas storage based on Power-to-Gas Water electrolysis Methanation CO 2 from air Energy Demand Electricity Industrial Gas Desalination Assessment Gas storage of energy storage technologies in transition to a 100% RE system for Nigeria
10 Agenda Motivation Methodology and Data Results Off-grid electrification Summary 10
11 Scenarios assumptions Key data million population in million km 2 ~664 TWh electricity demand (2050) ~5.12 million m 3 /a water desalination demand (2050) ~191.2 TWh non-energetic industrial gas demand (2050) Nigeria assumed as an electric island in this study Nigeria was subdivided into two subregions, namely, Nigeria-South and Nigeria-North Applied Scenarios Power Integrated: this includes the power plus water desalination and non-energetic industrial gas 11
 and wind power (right) generation profiles for")

12 Scenario assumptions Generation profile Solar PV single-axis tracking (left) and wind power (right) generation profiles for Nigeria Key Insights: PV resources available all through the year Good wind resources at some parts of the early days of the year 12
 and electricity generation (right), for the power scenario from 2015 up to 2050 Key Insights: PV installed")
.")
13 Results Installed capacities and electricity generation, for power scenario from 2015 to 2050 Installed capacities (left) and electricity generation (right), for the power scenario from 2015 up to 2050 Key Insights: PV installed capacity reaches 367 GW by 2050 By 2050, total annual generation reaches 737 TWh, of which PV single-axis contributes 527 TWh (72%). For both scenarios, PV single-axis dominates in terms of installed capacities and annual generation 13
 and electricity generation (right), for the integrated scenario from 2015 up to 2050 Key Insights:")
.")
14 Results Installed capacities and electricity generation, for integrated scenario from 2015 to 2050 Installed capacities (left) and electricity generation (right), for the integrated scenario from 2015 up to 2050 Key Insights: Solar PV dominates with respect to installed capacity and electricity generation By 2050, total annual generation reaches 1026 TWh, of which PV single-axis contributes 744 TWh (73%). PV account for 98% of the total electricity generation by

15 Results Installed capacities and electricity generation, for power scenario from 2015 to 2050 LCOE for power (left) and integrated (right) scenario, from 2015 to 2050 Key Insights: Fuel and CO 2 cost fizzle out of the system after 2040 In both scenarios, LCOE primary dominates the energy system until 2035 LCOE primary and LCOS dominate the system from 2030 till 2050 in both scenarios. 15

16 Results Installed capacities and electricity generation, for power scenario from 2015 to 2050 LCOE for power (left) and integrated (right) scenario, from 2015 to 2050 Key Insights: Decline in LCOE from 2030 in both scenario The LCOE PV single axis and battery dominates from 2035 till
17 Results Storage Mix Power scenario Integrated scenario 17
18 State of charge for storage technologies Aggregated yearly state-of-charge for storage technologies in 2050 for integrated scenario, battery (top left), gas storage (center), and A-CAES (right). Key Insights: Battery balance on a daily basis, mainly for solar PV A-CAES, hydro dams and gas on a weekly to seasonal basis. Grid is used throughout the year, mostly during the daily working hours. Aggregated yearly state of charge of Hydro storage (left) and grid profile for integrated scenario (right) for the year
 and the integrated scenario")

19 Results Carbon dioxide emissions Annual CO 2 emission and ratio of emission to electricity generation from 2015 to 2050, for the power scenario (left) and the integrated scenario (right) Key insights: Decline in carbon emissions as plants operating on fossil natural gas are eliminated from the system. Continuous reductions occur as the share of RE increases in the system 19
20 Results Hourly generation (power scenario) Hourly generation profile for a representative week in the middle of the year 2050 for Nigeria-south Key insights: Primary electricity source is solar PV. Solar PV electricity is stored in batteries during the daytime and discharged during the night hours Hourly generation profile for a representative week in the beginning of the year 2050 for Nigeria-south 20
21 Results Energy flow of the System of the Integrated scenario (2050) Key insights: PV dominates the electricity generation, Substantial part of demand is stored in batteries The energy system is very efficient due to low losses (losses 23%), thereof enabling heat supply 21
22 Agenda Motivation Methodology and Data Results Off-grid electrification Summary 22

23 Off-grid electrification Schematic of methodology 23
24 Off-grid electrification Night light emissions in Nigeria 24
25 Off-grid electrification Population density 25
26 Off-grid electrification Electrification option in all Nigerian states: Existing-Grid 26
27 Off-grid electrification Electrification option in all Nigerian states: Planned-Grid 27


28 Off-grid electrification Electrification option in all Nigerian states: Existing and planned grid Existing-Grid Planned-Grid 28
29 Summary Nigeria can reach 100% RE and zero carbon emission by The LCOE obtained for a fully sustainable energy system for Nigeria in the year 2050 is 43.0 /MWh and 34.0 /MWh for the power and integrated scenario, respectively. In addition, it is obviously feasible to replace the present fossil-based powered system with solar PV and other RE sources, and cut down the CO 2 emission level Solar PV was found most favourable energy source for Nigeria, balanced with battery storage Regarding storage output, battery storage output represents the largest share, with 360 TWh (90% of all storage throughput) in the power scenario, by This indicates the compatibility and predominat role of solar PV and battery, due to highly favourable economics Hydropower, as well as power generated from waste and biomass serve as gap filling (balancing) resources, for an effective and stable power system Fossil gas consumption is completely phased out after 2040 The results present a least cost transition path for Nigeria to meet the country s future power demands through a 100% RE system Regarding off-grid electrification: Grid extension accounts for the highest share, followed by solar home system option and then mini-grid in both scenarios. New policies are needed to ensure a quick development of a RE energy system of this dimension in Nigeria 29
30 THANK YOU FOR YOUR ATTENTION The authors gratefully acknowledge the public financing of Tekes, the Finnish Funding Agency for Innovation, for the Neo-Carbon Energy project under the number 40101/14. The first author would like to thank LUT Foundation for the valuable scholarship
31 FURTHER INFORMATION Supplementary data associated with this article can be found at: _technologies_in_transition_to_a_100_renewable_energy_system_for_nigeria _-_Supplementary_Material
32 Data Power Plant Capacities Technical and Financial Assumptions Capex variation based on learning curves Least cost power plant capacities based on Cost Efficiency of generation and storage Power to energy ratio of storage Available resource WACC is set to 7% for all years Variation in capex from for all power plant components utilised by model. 32
 and")

33 Results Primary electricity generation Primary electricity generation from different sources for power (left) and integrated (right) scenarios. Key insight: The share of solar PV technology develops fast and dominates till 2050, in both scenarios 33


34 Review of annualised cost (Power Scenario) Key insights: The entire transition period requires continuous capex Increasing opex due to phasing out of fossil fuel plants 34
")
35 Review of annualised cost (Power Scenario) Key insight: Annualised cost increased in the case of integrated scenario when compared to power scenario due to demand by additional sectors (desalination and gas sector) 35


 and Gas demand")
36 Results Gas Sector Gas input by source (left) and Gas demand for industry and electricity (right) Key insights: By 2050, synthetic natural gas dominates in terms of gas input by sources Biomethane and PtG based synthetic fuel can be used instead of fossil gas Gas for industrial demand is continuously increasing Annual levelised cost for gas (left) and Gas demand versus LCOG (right) 36
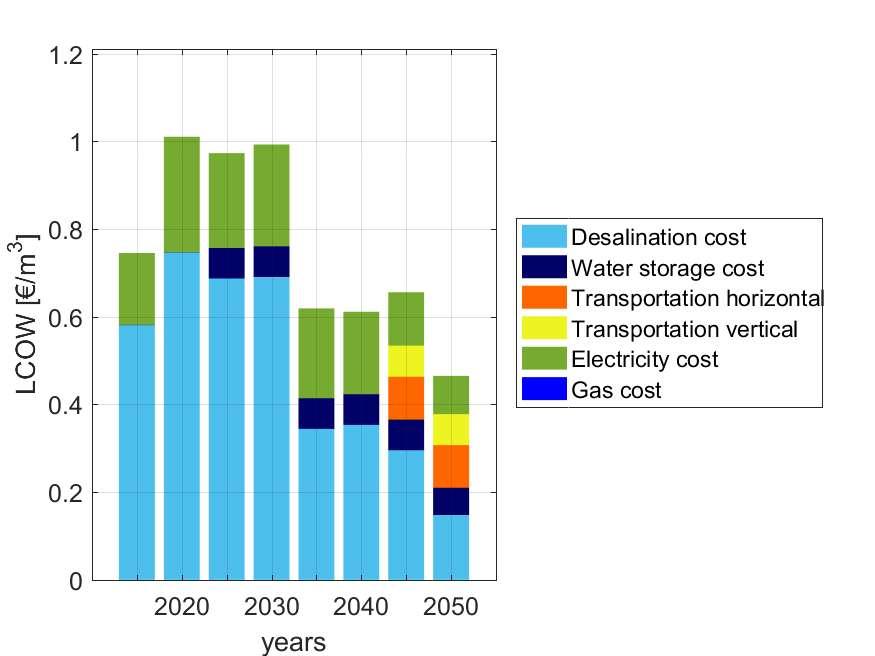
 Key insights: The")

37 Results Desalination levelised cost of water (left) and relative levelised cost of water (right) Key insights: The levelised cost of water (LCOW) is dominated by capex and opexvar till 2045 By 2050, capex and opexfix dominate the total LCOW 37

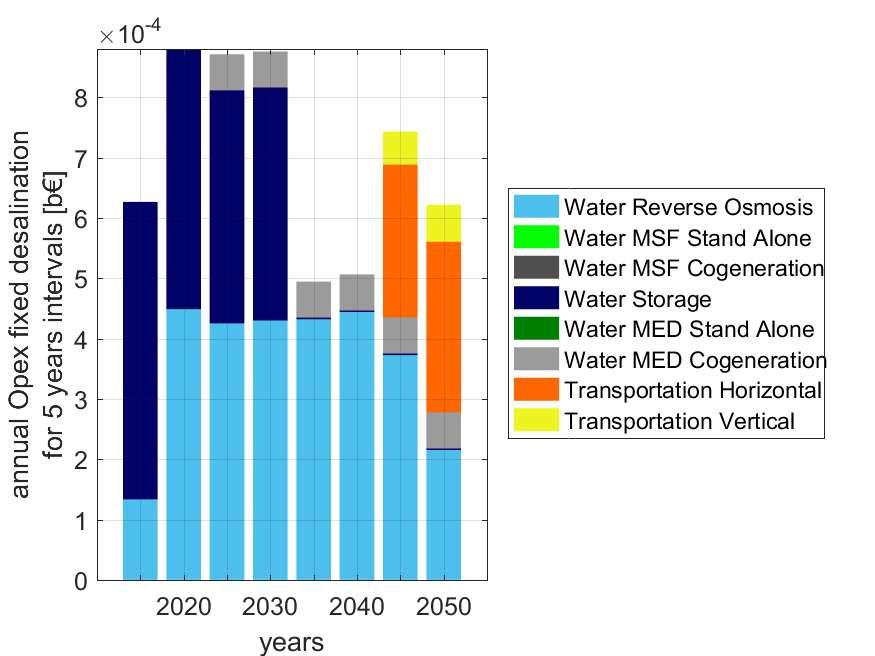
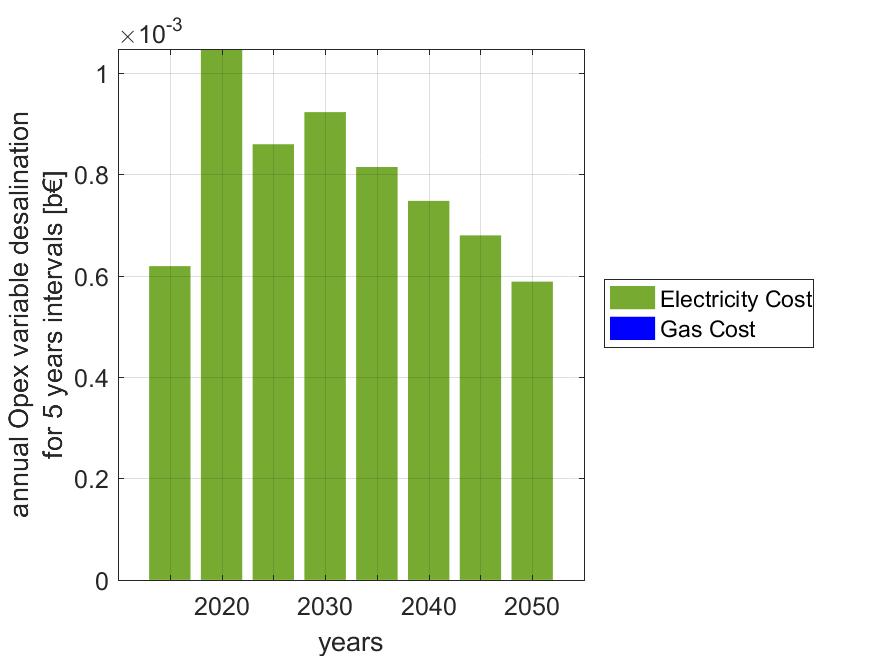
38 Results Review of annualised cost (Desalination) 38
, mainly due to less sunny days in this")

39 State of Charge (SoC) SoC of gas and methanation in 2050 Key insights: Gas storage is mostly used during the rainy season (March-May), mainly due to less sunny days in this period of year, especially in the South The highest amount of methanation is observed during the day time from 8 am to 6 pm by 2050, since solar PV is the dominant source of electricity 39