PHOSPHORUS REMOVAL: TREATMENT
|
|
|
- Allison Parsons
- 5 years ago
- Views:
Transcription


1 PHOSPHORUS REMOVAL: TREATMENT TECHNOLOGIES AND CAPABILITIES Jane Madden, PE, BCEE Senior Vice President CAWPCA Fall Workshop November 14, 2014
2 Agenda Phosphorus Removal Overview Phosphorus Regulations in Massachusetts Six Phosphorus Removal Case Studies Summary and Questions
3 Phosphorus Fractions In Wastewater Direct colorimetry Persulfate digestion & colorimetry Sulfuric acid digestion & colorimetry Analyses type Insoluble (retained on filter) mg/l phosphorus 0.45 µm filter Soluble (passes through filter) Orthophosphate fractions Acid-hydrolyzable fractions Organic fractions

 Chemical solid")
4 How is Phosphorus Removal Achieved? Convert soluble orthophosphates to a solid Remove solid Biological solid (microorganism) Chemical solid (precipitate)
5 Biological Phosphorus Removal P RELEASE P UPTAKE Primary Clarifier Secondary Clarifier Preliminary Treatment Effluent TP < 0.75 mg/l Anaerobic Aerobic Return Activated Sludge Waste Activated Sludge (TP ~4-7% of organic TSS)
6 Pros and Cons of Biological Phosphorus Removal Pros Sustainable treatment process Low O&M costs No chemical storage and feed systems Less sludge production Anaerobic selector provides improved sludge settleability Cons Phosphorus re-release Cannot achieve extremely low limits Subject to upsets (like any biological process) Can compete with biological nitrogen removal Some plants report dewaterability issues
7 Chemical Phosphorus Removal Chemical (Metal Salts and Polymer) Chemical (Metal Salts and Polymer) Dual point is more efficient than single point Preliminary Treatment Effluent TP < 0.5 mg/l Return Activated Sludge (add-on or integrated process) Waste Activated Sludge (TP ~ 2% of organic TSS AND TP in Chemical Sludge) Effluent TP < 0.2 mg/l
8 Chemicals (Metal Salts) Used for Phosphorus Removal Iron Salts Ferric Chloride Ferrous Sulfate Aluminum Salts Alum Poly Aluminum Chloride (PACl) Calcium Compounds Quick Lime Hydrated Lime
9 Pros and Cons of Chemical Phosphorus Removal Pros Lower limits can be consistently achieved No phosphorus re-release Cons High O&M Cost Increased sludge production and associated disposal costs Chemical sludge can be more difficult to thicken and dewater Additional chemicals for alkalinity control Not sustainable
10 Processes to Achieve Low TP Limits (0.2 mg/l or less) (case studies) Add-On Processes with Chemical Addition Filtration Conventional sand filters Cloth media filters Upflow filters Ballasted Flocculation ACTIFLO CoMag TM DensaDeg Integrated Processes BioMag Membrane Bioreactors (MBRs)

11 EPA Region 1 in Massachusetts Has Pushed the Envelope on Phosphorus Removal Massachusetts Communities with Phosphorus Limits <0.2 mg/l


12 Regulations have Inspired Innovation
 Aquadisks and Aquadiamonds to achieve 0.")
13 Charles River Pollution Control District, Medway, MA Originally Constructed mgd Upgraded and Expanded 1998 to 5.7 mgd Single-stage nitrification Disk filters TP to achieve 0.2 mg/l seasonally Upgrade under construction EBPR (A/O process) Aquadisks and Aquadiamonds to achieve 0.1 mg/l summer, 0.3 mg/l winter Bid Price: $17.4 M


14 Filtration Cloth Media

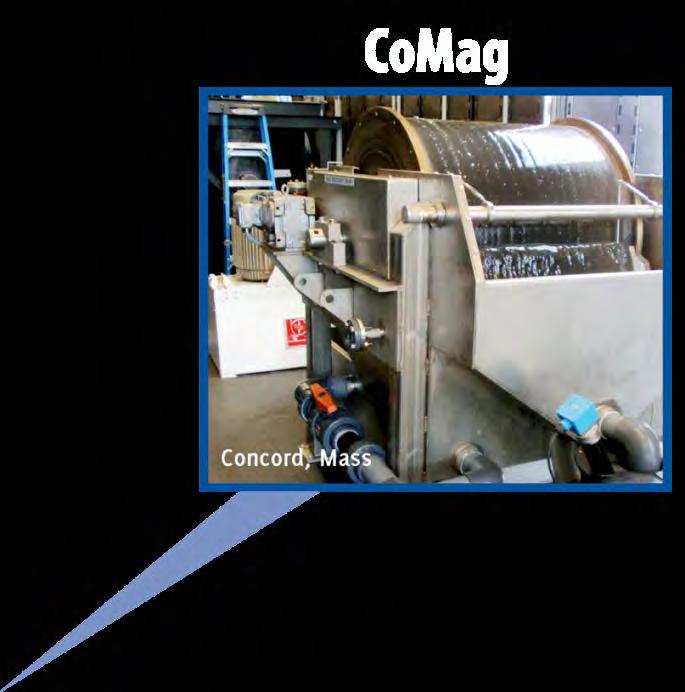
 Process: CoMag by Evoqua First full-scale")
15 Concord, MA Original facility designed by CDM Smith in early 1980s Average Daily Flow: 1.2 mgd Total Phosphorus 0.2 mg/l (April Oct) 1.0 mg/l (Nov Mar) Process: CoMag by Evoqua First full-scale facility in the world Construction Complete 2007 Construction Cost $13M
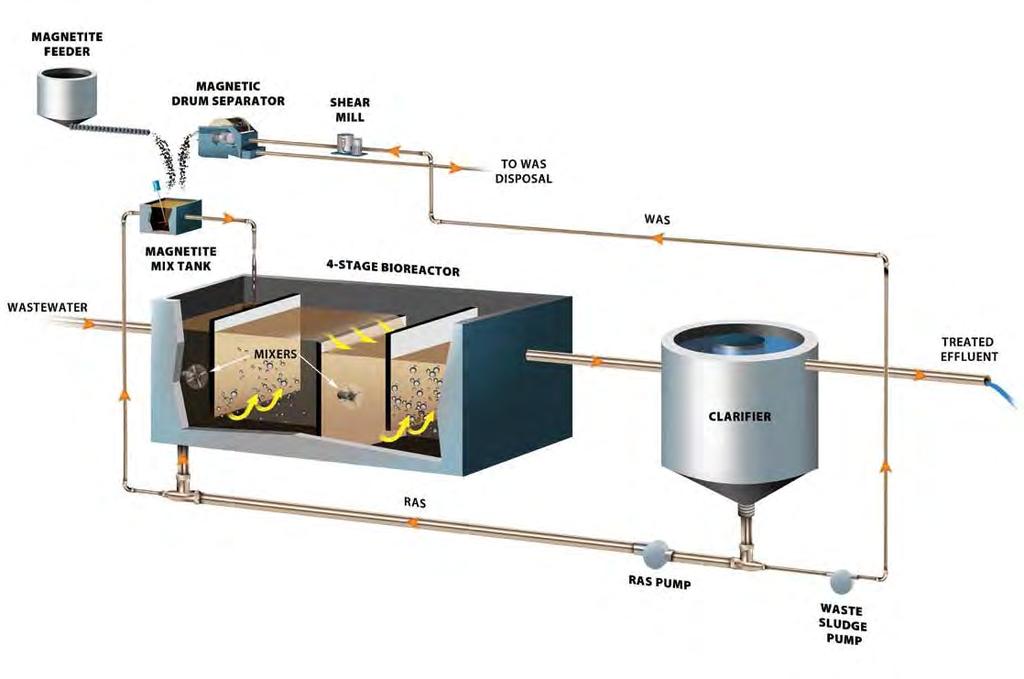
 Alum Addition To CoMag TM Influent Piping Optional Polishing Magnet Settled")
16 Concord CoMag TM Ballasted Flocculation System Clarifiers Magnetite Recycling Drums Reaction Tanks (Polymer Addition) Alum Addition To CoMag TM Influent Piping Optional Polishing Magnet Settled Sludge
17 Performance Test Results December Secondary Effluent 1.50 CoMag Effluent Total Phosphorus [mg/l] /10/ /12/ /14/ /16/ /18/ /20/ /22/2007 Date Average tertiary effluent TP < 0.05 mg/l
 Process: Actiflo by Kruger Constructed within existing abandoned tanks Construction Complete:")
18 Webster, MA Average Design Flow: 6 mgd Total Phosphorus 0.2 mg/l (Apr Oct) 1.0 mg/l (Nov Mar) Process: Actiflo by Kruger Constructed within existing abandoned tanks Construction Complete: Spring 2011 Construction Cost: $8M
19 Ballasted Flocculation ACTIFLO Hydrocyclones Sludge Coagulant Polymer Microsand Treated Water Raw Water Inlet Coagulation Tank Injection Tank Maturation Tank Settling Tank Sludge + Microsand Recirculation Pumps
 1.")
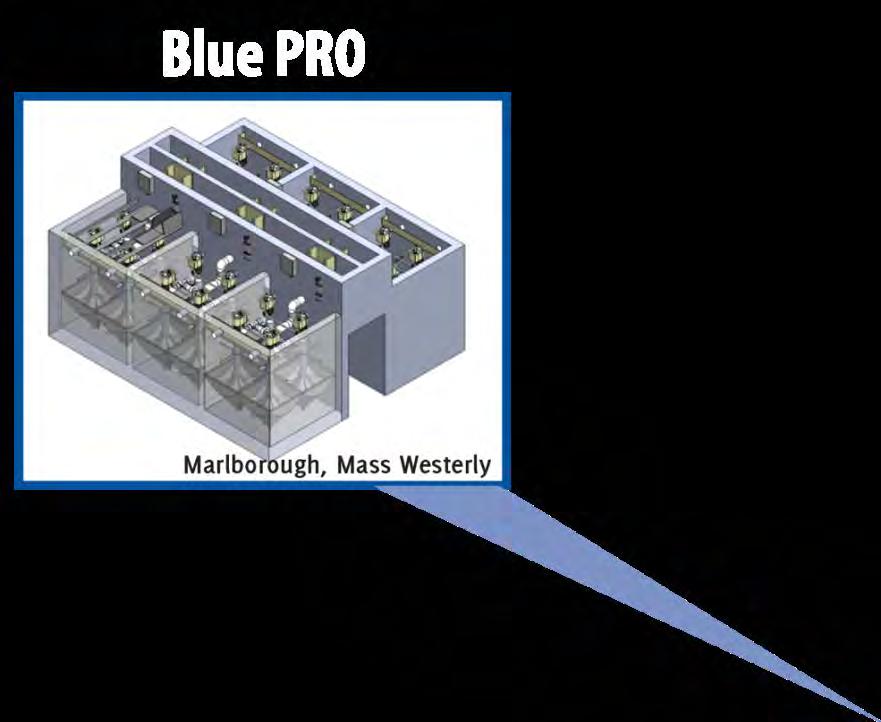
20 Marlborough Westerly WWTF Originally Constructed mgd Upgraded and Expanded 1988 to 2.89 mgd Single-stage seasonal nitrification Upgraded and Expanded 2012 to 4.15 mgd Single-stage year-round nitrification 0.1 mg/l (summer) 1.0 mg/l (winter) Construction Cost: $27.5M BluePro Filtration System by BlueWater Technologies


21 Filtration Upflow Filters Raw Water Inlet Clean Water Water HFO- Fe O CS Fe O Grain Fe O As O PO 4 3- Reject Stream Particles Dynasand Blue PRO


22 Facility Upgrade Blue PRO System Influent Channel Effluent and Recycle Pipes Filter Quad Weir Box Air Control Panel
23 2012 Plant Performance Description Permit/Design Values 2012 Values Flow (mgd) Average Daily Flow Maximum Daily Flow Influent (mg/l) CBOD TSS Phosphorus Effluent (mg/l) CBOD TSS Phosphorus in season Phosphorus off season
24 Influent and Effluent Total Phosphorus (mg/l) April October 2012 Total Phosphorus (mg/l) /1/2012 5/1/2012 6/1/2012 7/1/2012 8/1/2012 9/1/ /1/2012 Influent Effluent
 1.")
25 Marlborough Easterly WWTF Originally Constructed early 1970s 5.5 mgd Two-stage/two-sludge process Currently being upgraded to meet TP limits 0.1 mg/l (Apr-Oct) 1.0mg/L (Nov-Mar) Two-stage process with A/O in first stage and BioMag TM in second Construction Cost: $44M
26 Integrated Process - BioMag

27 Upper Blackstone Water Pollution Abatement District (UBWAD) WWTF Serves greater Worcester, MA 45 mgd ADF; 80 mgd MDF; 160 Peak hour 3 Phase improvements plan completed in 2012 at a cost of $180M

28 Facility Designed to Exceed 2001 Permit Limits Using Sustainable Process (EBNR A2/O) Incorporated Nitrogen removal Reduce O 2 demand Reduce chemicals for alkalinity control Biological phosphorus removal Gravity flow into and out of treatment facility
29 Currently working with District to Optimize EBNR and Pilot Conventional Technologies Process Optimization Pilot Studies Conversion from caustic to magnesium hydroxide for alkalinity control Addition of real-time instrumentation and controls Operation in step feed under high flows Targeted addition of ferric chloride A2/O with supplemental carbon Modified Bardenpho with and without supplemental carbon


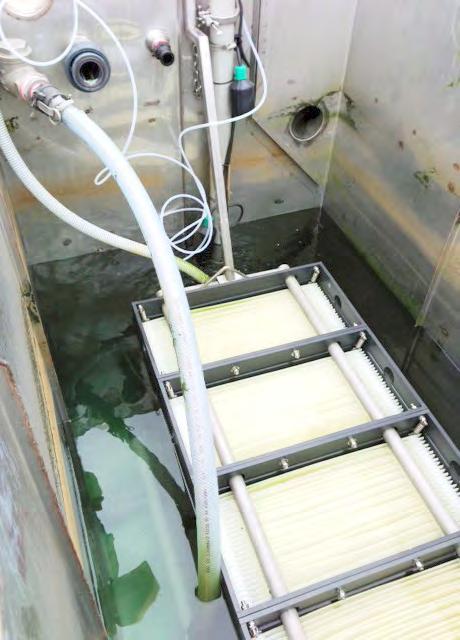
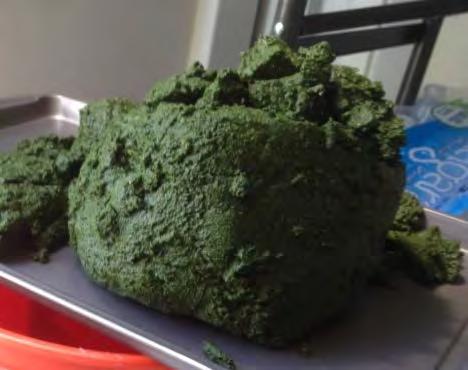
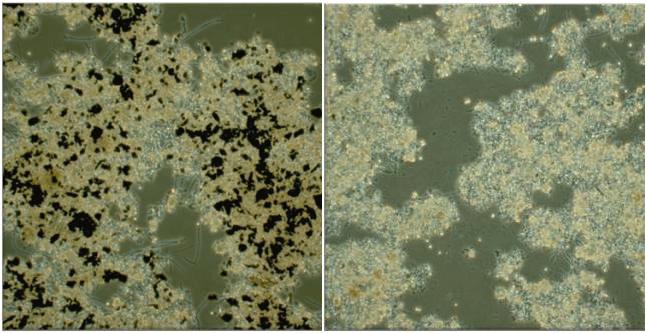
30 Innovative Technology Advanced Biological Nutrient Recovery (ABNR)

31 ABNR Mimics the Natural Process in a Controlled Environment (PBR) Consumes CO 2 Releases O 2 Consumes nutrients No chemical addition required Harvested algae is potentially a beneficial product Can remove metals and other contaminants
32 Summary Each facility is unique and will have a unique solution for phosphorus removal Be cognizant of permit language Push for seasonal average load or concentration Consider regulating ortho-p vs. TP (to mitigate non-reactive P) Biological nitrogen and phosphorus removal are often competing reactions Phosphorus removal facilities can be costly to construct And operate primarily due to power and chemicals Intermediate pumping; ancillary systems Cost of chemicals (for coagulation and alkalinity) and increase in sludge production


33 Questions? Blue Pro BioMag EBNR Actiflo CoMag Jane Madden, P.E., BCEE CDM Smith Cloth Filters