Peter M DeVita, RHUC From Church St. RHUC Net Zero Committee, Sustaining Creation Re-Newable Energy Co-op, DeVita Associates
|
|
|
- Prosper Boone
- 5 years ago
- Views:
Transcription

1 Peter M DeVita, MASc, MBA, P.Eng, FEC President of SC-REC, Co-Chair of Net Zero Committee, President of DeVita Associates consulting services Member of OSPE Energy Committee Centennial College Energy Program Centennial College Project Management Interns peterdev@rogers.com TEL: RHUC Net Zero Committee, Sustaining Creation Re-Newable Energy Co-op, DeVita Associates RHUC From Church St
2 Overview Summary A. Intro: Biblical Responsibility & Energy Sources B. RHUC Net Zero Story C. OPA FIT Program D. Ontario Electricity E. DeVita Associates & Centennial College Interns F. Sustaining Creation Co-op Services
3 A. Intro & Energy Overview
4 Biblical Responsibility Genesis reminds as that: The Supreme Being created the universe and all living things in it. Humans are an inseparable part of this creation. We have been given a special role and responsibility to care for creation.
5 Energy-Environment Economy What are we talking about? ENERGY in 2 main types 1. HEAT & 2. Electricity
6 Energy-Environment Economy What is main concern? Energy use... that creates GHG s We need energy to drive our economy but, our health and survival is at stake via global warming and pollution. => We must find energy sources that do not burn up the planet.

7 Sun and Earth Facts Ref: RETScreen Manual, Natural Resources Canada
8 Sun and Earth Facts The total solar energy absorbed by Earth's atmosphere, oceans and land masses is approximately 3,850,000 exajoules (EJ=10^18J) per year In 2002, this was more energy in one hour than the world used in one year!

9 Sun and Earth Facts -Earth Core
10 Sun and Earth Energy /year Solar 3,850,000 EJ ~4. x 10^24J Earth Core Heat Flow Annual Electricity used on Earth Ontario maximum production of electrical energy/yr 1.3 ZJ ~1.x 10^21J 56.7 EJ ~6. x 10^19J 788 PJ ~8. x 10^17J
11 B. RHUC Net Zero Story Key Objective: Reduce RHUC s carbon emissions to Zero (0) by the end of 2013.
12 1. Heating related Concept Proposal May 2009 a. Conservation measures b. Solar Hot water c. Earth heat exchange system with radiant floor heating and heat recovery fresh air unit in Sanctuary; 2. Electricity related A. Photo Voltaic power generation
13 Visits over Summer Doing our homework Lawrence Park UC St Thomas Anglican Philip Coulter s place Other Events SMA s eco fair Heritage Day
14
15
16 RHUC Current Energy Use & Green House Gas Volume (m3) Energy Content Green House Gasses produced (kw-hr) (kg) Heating: 50, , ,000 Electricity: -- 39,577 8,000
17 How do we compare to other UC churches in GTA?
18 Energy Use Comparison kw-hr/yr 900, , , , , , , , ,000 0 Total Energy - kw-hr/yr vs Area (ft2) Fairlawn (1924) Humbercrest Beach United Ebenezer (1852) Knox (1872) St Mark's (1983) RHUC (1880) Forest Hill (1940) Area - sq ft
19 Green House Gasses Comparison Tonnes/yr Total GHG Scatter Plot - Tonnes/yr vs Area (ft2) Fairlawn (1924) Humbercrest Beach United Ebenezer (1852) Knox (1872) St Mark's (1983) RHUC (1880) Forest Hill (1940) 0.00 Area - sq ft
20 (GHG/year) 70 kg/m GHG/m2 vs Age of Church , RHUC 60.2, Knox 50.7,Ebenezer y = x R² = GHG-kg/m , St Marks Linear (GHGkg/m2) Age - years GHGkg/m Forest Ebenezer Knox RHUC Fairlawn Hill Humberc Beach St Mark's Church (1852) (1872) (1880) (1924) (1940) rest United (1983)
21 How do we reduce our Carbon Footprint?
22 Heating progress Geo Thermal Exchange system to focus on Heating/Cooling Solar Water to be used to supplement the system along with a large water heat storage tank. Ask me for more data if you want to know.
23 Electricity Progress Co-op & PV Project
24 The Green Energy Act May 14, 2009 Implications for Electricity generation FIT & Micro Fit Community Power Renewable Energy Co-op The Green Energy Act motivates us to do the PV project first. => Need to create a renewable Energy Co-op first.
25 Co-op s 7 International Principles 1. Voluntary and open membership 2. Democratic member control 3. Member economic participation 4. Autonomy and independence 5. Education, training, and information 6. Cooperation among cooperatives 7. Concern for community
26 Sustaining Creation Co-op Articles submitted for approval on Feb 18, 2010 By-laws to be completed plus other required government documents; Call General Meeting and elect first general directors; Raise funds, OPA application & Begin the project (very ambitious target given external delays possible)
27 Next Steps for initial PV project Fund raising via debentures (loans with principle and interest payback) Co-op to apply for a Micro Fit project Firm up actual costs and choose supplier(s) to do the work Contract a Structural Engineer to examine CE roof and provide a design if roof reinforcement is needed

28 PV Planning

29 Planning

30 BING Satellite View

31 PV Panels on 1 Axis tracker

32 1-Axis Tracker Individual Panels

33 Grid Connected System
34 PV GHG Replacement impact A 10kW system will create about 13,000 kw-hr of clean energy per year = (2,624) kg of GHG = (2.6) Tonnes
35 How are we going to Finance this system? The system will be run by the Co-op; the Co-op will raise the funds to create this system; Main Reasons for creating the Co-op: o o o Separate the financials from those of the Church; Separate liabilities from the church; Potential to expand to member s homes and other churches;
36 Actual Numbers PV Financial Projections System Size (kw) 10 Estimated Cost per kw $9,000 # years (amt length) 20 Debenture Annual rate 4.00% Total System Cost = amt of debenture $90,000 Summary of Expected Results 20 yr of PV rev $198,886 total debenture payout $132,447 total debenture earnings $42,447 Co-op net in 20yrs $66,439
37 Fund Raising Memberships can be purchased as soon as the Co-op is created. The Debenture funds will be needed when the work is contracted. We will also seek Grants and or interest free Loans to assist in funding the initial venture.
38 C. OPA FIT Program
39 Looking to the Future FIT program PV Wind Bio-Mass Tariff & cost expectations, PV
40 Ref: A_speech_and_slides_Nov 25-09_(2).pdf
41 The rationale for a feed-in tariff is not limited to the reduction of GHG emissions, for which a FiT is in fact an expensive instrument. There are important objectives related to reduction of technological costs and overall innovation that are also served by a well-designed policy. The long-term cost of the FiT program needs to be controlled through a commitment to a tariff degression policy (such as that in place in Germany), through which the tariff on new contracts is reduced to account for the reduction in renewable technology development and deployment costs over time.
42 PV Tariffs Contract price, OPA web site, Sept 27, 2010 Solar PV Projects Rooftop 10 kw 80.2 /kwh Rooftop > 10 kw 250 kw 71.3 /kwh Rooftop > 250 kw 500 kw 63.5 /kwh Rooftop > 500 kw 53.9 /kwh Groundmounted 10 kw 64.2 /kwh Groundmounted* >10 kw 10 MW 44.3 /kwh Length of contract Percentage escalated Peak performance factor Average lead time 20 years Not eligible Not eligible 1 year for smaller projects 3 years for larger projects
43 Domestic Content Requirements Solar PV microfit: 40% on or before Dec 31, 2010 and 60% after Solar PV projects: 50% on or before Dec 21, 2010 and 60% after Wind projects: 25% on or before Dec 31, 2011 and 50% after Domestic content requirements are FIT contract obligations Ref: es_nov 25-09_(2).pdf
44 Qualifying for Domestic Content Designated Activity Qualifying Percentage 1. Silicon used in solar photovoltaic cells manufactured in an Ontario refinery Silicon ingots and wafer cast in Ontario Crystalline silicon solar photovoltaic cells formed in Ontario Solar photovoltaic modules made in Ontario and encapsulated in Ontario Inverter assembly and testing in Ontario 9 6. Mounting systems entirely machined or formed or cast in Ontario 9 7. Wiring and electrical hardware sourced from an Ontario supplier All on- and off-site labour and services 27 Total 100
45 OPA Objectives -Micro FITs OPA s microfit encourages the development of micro-generation installations Mostly rooftop solar PV Mostly residential, small commercial, institutional The program provides a variety of opportunities, for example: Own your own project Lease your roof Lease project equipment Community projects Ref: _JoAnne_Butler_AWMA_speech_and_slides_Nov 25-09_(2).pdf
46 Micro FIT Application process 1. OPA microfit application Applicant is assigned a reference number for the project 2. Applicant submits a connection request to the LDC Applicant must provide microfit reference number 3. Applicant installs project and obtain necessary approvals e.g. Electrical Safety Authority 4. Applicant and LDC complete connection of project Sign Connection Agreement, pay connection costs, install meter 5. LDC informs OPA of connection details Use of web-based interface 6. OPA prepares and offers microfit Contract Electronic contracting 7. OPA informs LDC to start settlement
47 Eligibility Rues - Sept 2010 As we discussed, the microfit advisory panel has heard feedback regarding faith communities and is looking into expanding the eligibility categories, but as of right now, that change hasn t been made. from REFO office, Sept 27, 2010
48

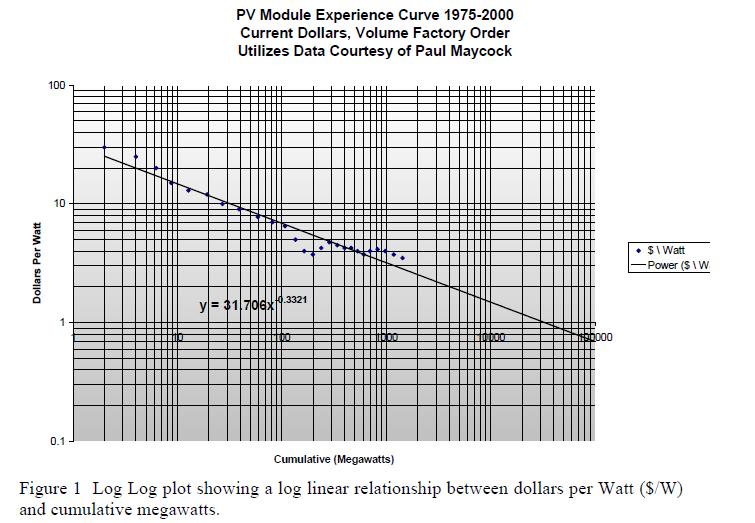
49 Ref: The European PV Technology Platform WG 2 - Information, promotion, education and market deployment
50 System Price Projections System Prices (USD/Wp) Country Australia Europe Japan USA Average* *Prices are approxmate for a FIT of >1MW YEAR Estimated Micro FIT capital cost projections CAD (.93 exchange) Conjectured future Micro FIT tariff
51 D. Ontario Electricity

52 Ontario Electricity :Capacity
53 Ontario Electricity Capacity Mind the Gap- 2015

54 Required New Capacity

55 COMMERCIAL OPERATION CHART Ref: OPA, 1Q2010 results New capacity

56 COMMERCIAL OPERATION CHART Ref: OPA, 1Q2010 results

57 COMMERCIAL OPERATION CHART
58 FIT Progress Date Total FIT applications - all types Large Scale FIT Apps capacity (MW) Large Scale approved (MW) PV related (MW) Micro Fit applications Micro FIT Approved Micro Fit Max capacity (MW) Total FIT Apps or Approved (MW) App'd as of Apr ,500 App's as of Sept ,300 20,000 10, ,300 April capacity can power 600,000 homes. Sept applications represent about 50% of Ontario demand.
59
60 E. DeVita Associates & Centennial College Interns
61 DeVita Associates (consulting services with Centennial College Interns) 1.Energy consumption analysis and report assess heating/cooling energy consumption establishes the building s base line energy usage and current carbon emissions. 2. Comparative data data will be plotted and compared to data from over 20 other faith community buildings.
62 Conservation Analysis 3. Building Insulation Analysis and Report Insulation analysis of: - Roof, - Windows & doors, - Walls RETScreen analysis giving: - $ paybacks, - energy savings, - emission reductions 4. Building Electrical Analysis and Report Analysis of all lighting with energy consumption and emissions Proposal for new forms of lighting to reduce energy costs and emissions RETScreen analysis for paybacks life cycle cost analysis of bulbs/fixtures
63 Heating/Cooling Sytem 5. Geo Exchange System potential a. Costs, paybacks, emission reductions b. Grant Funding potential and application submissions c. size of a Heat Pump system to provide heating/cooling. d. size of the Geo field estimated and approximate locations e. RETScreen report
64 F. SC-REC s PV Services
65 F. SC-REC s PV Services Sustaining Creation Co-op services to assist in managing the project Debenture s offering and organization Other Funding potential and applications OPA Application Process Managing the RFP process and contractors Long term system managers building(s) examined for potential PV sites RETScreen analysis and detailed financial analysis with approximate costs Energy potential and emission s impact
66 Questions? The End