BIOLOGICAL TREATMENT of RUNOFF. Sarah A. White, Ph.D. 27 July 2017
|
|
|
- Gabriel May
- 5 years ago
- Views:
Transcription


1 BIOLOGICAL TREATMENT of RUNOFF Sarah A. White, Ph.D. 27 July 2017

2 Water challenges & concerns

3 Irrigation timing? Plant diseases? Cultural practices? How much have I lost? $ and opportunity cost

4
5 Biological treatment technologies Sediment basins Filter strips Vegetative buffers Vegetative waterways Constructed water (wetland) treatment basins (CWs) Surface-flow Subsurface-flow Floating wetlands


6 Sediment/erosion control Develop an erosion / sediment control plant Prevent sediment from leaving the nursery stabilize critical areas grass (time of year) or mulch erosion control blankets/netting SNA BMP Manual 2 nd ed.

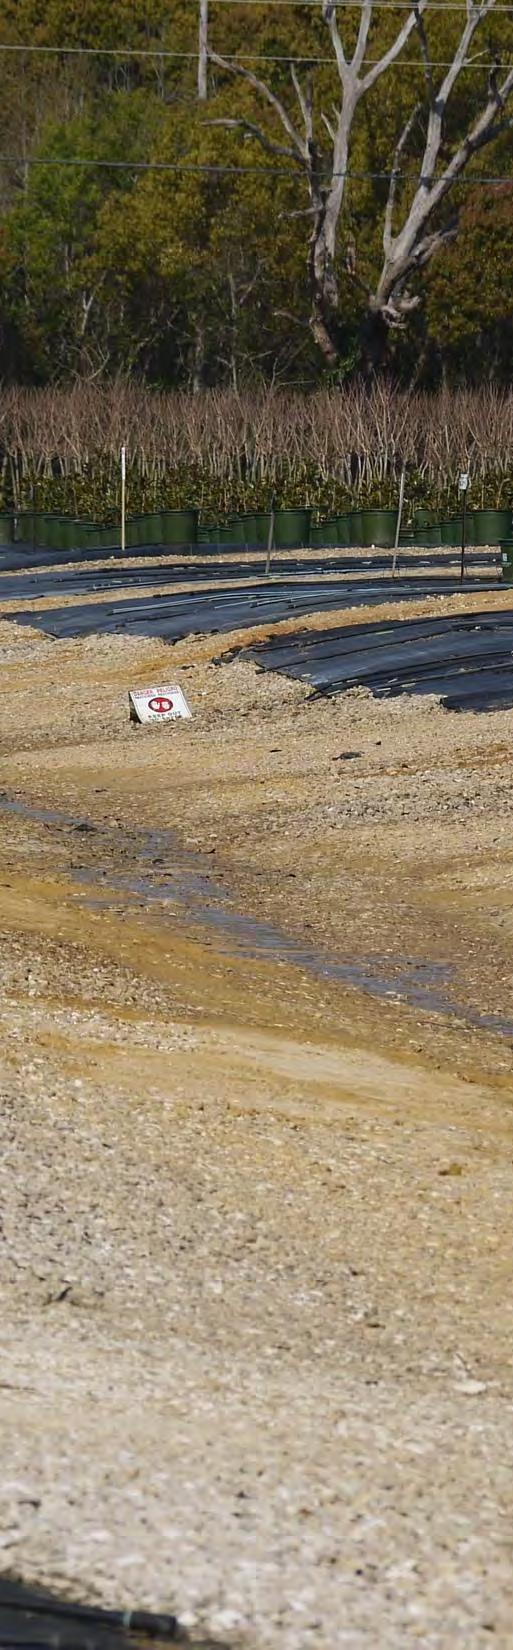
7 Sediment basins

8 Bioretention basin

9

10

11

12
13 Biological treatment technologies Sediment basins Filter strips Vegetative buffers Vegetative waterways Constructed water (wetland) treatment basins (CWs) Surface-flow Subsurface-flow Floating wetlands
 pathogens Before they enter surface water Image: Peter")
14 Filter strips Bands of vegetation used between production areas & retention ponds Slow runoff Trap: Sediment Fertilizer pesticides (potentially) pathogens Before they enter surface water Image: Peter Rogers

15

16


17
 treatment basins (CWs) Surface-flow Subsurface-flow Floating")
18 Biological treatment technologies Sediment basins Filter strips Vegetative buffers Vegetative waterways Constructed water (wetland) treatment basins (CWs) Surface-flow Subsurface-flow Floating wetlands
 Recycle or release")
19 Constructed water treatment basins (CWs) Recycle or release water

20 Wetland (water basin) functions Soils provide habitat for microbes Microbes process nutrients organic contaminants Vegetation slows water Plant uptake/absorption nutrients trace metals other compounds
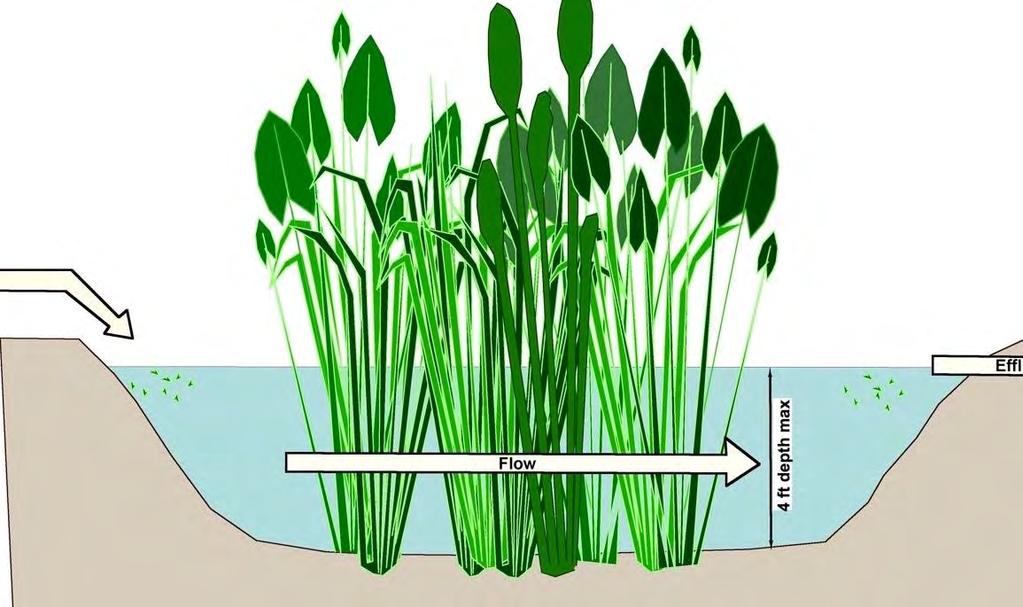
21 Surface-flow CWS


22 Case Study: Monrovia Cairo, GA CW 2 CW 1

23 Case Study: CW1 14 years 120 acres of production drain to wetland 9.3 acre wetland Two-stage deep cell shallow cell

24 How well do surface-flow CWs clean nursery runoff?
25 Nitrogen results Nitrogen Removal (%) Water Temperature ( o C) Apr-02 Jun-02 Aug-02 Oct-02 Dec-02 Feb-03 Apr-03 Jun-03 Aug-03 Oct-03 Dec-03 Feb-04 Apr-04 Jun-04 Aug-04 Oct-04 Dec-04 Feb-05 Apr-05 Jun-05 Aug-05 Oct-05 Dec-05 Feb-06 Wetland efficiency 1st stage temp.

")
26 Phosphorus results Removal efficacy (%) / Export Phosphorus (ppm)
27 Surface-flow CWS Most efficient with high to moderate runoff volumes Efficient nitrogen removal Phosphorus not consistently treated Pesticide removal 50-98% organochlorine organophosphate pyrethroid

28 Subsurface flow CWS

29 Subsurface flow CWS

30 Subsurface flow CWS Reduce ammoniacal N emissions Efficient nitrogen & phosphorus removal sediment will become P saturated Pesticide removal depends upon pesticide class

31 Floating treatment wetlands (FTW) Image source: Floating islands international

32 Floating treatment wetlands (FTWs)


33 Floating wetland: functions Large root surface area for microbe habitat Particulate filtration Nutrient removal Provide edge shelter & general wildlife habitat


34 N & P remediation Canna Canna
35 Remediation efficiencies Contaminant Filter strip Water Treatment Basin Design (% Removal) FTW Surface flow Subsurface flow TSS ± TP ± TN Herbicides* 30-91? TSS = total suspended solids TP = total phosphorus TN = total nitrogen * Removal efficacy vary by compound, some not removed
36 Conclusions Each technology discussed has specific benefits and limitations Technology applied for remediation depends upon site-specific considerations operation size treatment volume contaminants of concern


37 Contact Information Sarah A. White, Ph.D. Department of Plant & Environmental Sciences Clemson University E-143 Poole Agricultural Center Clemson, SC Resources: Constructed Wetlands: A How to Guide for Nurseries Available for free: Cleanwater3.org treatment technology information