Demonstration of an Integrated Biorefinery
|
|
|
- Vernon Parsons
- 5 years ago
- Views:
Transcription
1 Demonstration of an Integrated Biorefinery Dick Arnold Red Shield Acquisition, LLC Old Town s Bioenergy Business E2Tech/MPPA Forum ~ February 27, 2014 Reinventing Maine s Pulp, Paper & Forest Products Industries
2 2 OTFF Overview

3 OTFF Overview Bio-Energy Campus Pulping Operation Biorefinery Configured for Alternative/Renewable Energy Development UM s FBRI Technology Research Center OTFF s Piloting, Analytical and Technical Services Biomass Boiler Operations with 16 MW Turbine Integrated into ISO-NE Markets ~ FERC QF Status Additional Generating Capacity > 9.5 MW Gas Turbine Participation in REC Market (Renewable Energy Credits) 200,000 tonne capacity market pulp mill ~ northern bleached hardwood Kraft (NBHK) Pre-extraction & acid recovery IP and technology Production of high-quality fiber products, while simultaneously producing feedstock for a biorefinery
4 Vision ~ Old Town & Patriarch Goal Long Term Viability and Sustainable Jobs Fiber Security Low cost position Innovation/Technology Development Energy Independence Vision Creating value through utilization of the existing infrastructure Create an environment of continuous improvement focused on efficient and economically viable operations given the high cost of wood in the Northeast Development and demonstration of a technically and economically viable biofuels process that converts wood to jet fuel (biofuels) Pursue opportunities for growth that create value and diversity of its manufacturing model in Old Town Operate a green, efficient energy platform reducing greenhouse gas emissions and carbon footprint Create a center of excellence for developing technologies and intellectual property in the area of bioenergy
5 OTFF Technology Tree Technology Value Biotechnology Service Bioplastics Biochemicals Carbon Fiber Complete DOE FOA Cellulosic Ethanol/ Licensing Higher Value Products: Bio-Jet/Bio-PET Validate Clean Sugar & Ethanol Marketing Finalize Patents Development Collect Demo Metrics/ Apply to Commercial Pro-forma Revenue Validation Provide Service for Revenue Technology Development/ Biotech Service Clean Sugars C6/C5 Collect Pilot Metrics/ Apply to Demo Pro-forma Wood Deconstruction Assets


6 OTFF Sustainability Safety Culture Environmental Stewardship (Conservation & Sustainability) Sustainability & Green Initiatives provide strong future growth Proximity to raw materials Second generation feed stock ~ renewable resource Established infrastructure supported by an ongoing business Pulp from northern mixed hardwoods Chain of custody certification Traceability Strategic partnerships 6
7 Technology Pathways Pre-extraction of Hemicellulose (C5) and Acid Recovery Impact on pulp quality Acid recovery purity and markets Complex process and capital intensive C5 Rich Sugars Fermented to Bio-Butanol -> upgrading to bio-jet Inefficient fermentation (water balance) Butanol an intermediate ~ conversion technologies not proven at scale High Capex and Opex ~ $24 per gallon and 36 cent sugar C6 Rich Sugars with Algal Fermentation with hydrocarbon upgrade to bio-jet Proposed IBR Solazyme ~ fermentation only ~ 3 rd parties to condition and upgrade Opportunity for by-product development Economic viability ~ $16 per gallon at 30 cent sugars; Capex at $100 per gallon Wood to Jet Fuel ~ technically feasible but not economical Could pilot end product with Logos or Solazyme plus POS & EPO 2nd Generation Clean Sugars ~ OTFF s Core Value Performance ~ comparable to corn dextrose Low sugar cost ~ with biomass, cent range commercially viable Capex ~ re-purposed pulp mill < $4 range as benchmark Plastics, Chemicals and Carbon Fibers ~ scale and feedstock costs
8 Value of Technology Carbon Fibers 150x Carbon Fiber Process Chemicals 30x Relative Value Carbon Fibers: OTFF commercial sugar plant as feedstock $0.10/# Feedstock 10x $1.00/# Chemicals 5x $5.00/# Carbon Fiber Fuel Comparison: $0.03 Biomass 5x $0.15 Sugars 3x Fuels (~$3/Gal) Pulp Comparison: $0.06 Wood 4x $0.24 Pulp (~$500 ADST) Biomass BTU Value: $0.03 Biomass 3x $0.10 Wood Pellets (~$200/ton) Biofuels 15x Pulp 8x Sugras 5x Bio-energy 3x Pulp Wood Chips 2x Biomass wood chips x Energy Pulp Process Sugar Process Biofuel Process Bio-Chemical Process Process Steps in Value Chain 8

9 Bridging the Gap to Value Long term viability in a volatile pulping industry The Ethanol Platform, is the first step in mitigating scale-up risk for cellulosic feedstock production. Old Town has proven technology for producing clean cellulosic sugars from wood for conversion to bio-fuels, bio-plastics, bio-chemicals and potentially carbon fibers. The steps to commercialization over the next several years: a logical pathway that demonstrates the technology, incorporating a model that maximizes profitability, manages debt and capital; a continuation of technology development to higher value conversion technologies and products; and a commercial deployment strategy that includes the viability of bolt-on technology, licensing and re-purposed pulp mills.


10 Ethanol Platform Ethanol Biofuel Further Upgrading BioJet BioJet Naptha Kerosene BioPET Soft Drink Bottles/Caps Water Bottles/Caps Recycled Plastics Bio chemicals Ethyl Halides Ethyl Esters Diethyl Ether Ethyl Amines Antiseptic Solvent Medical Ethanol
11 Gasoline/Ethanol Consumption in New England Regional Markets State Gasoline Ethanol OTFF Volume Percentage of Ethanol Market Maine 669,816,000 66,981, % Connecticut 1,456,098, ,609,800 Massachusetts 2,768,472, ,847,200 New Hampshire 699,258,000 69,925,800 Rhode Island 371,364,000 37,136,400 Vermont 319,494,000 31,949,400 New England 6,284,502, ,450,200 13,000, % Data from 2011 U.S. Energy Information Administration. Ethanol Market is calculated on a 10% blending basis to motor gasoline.
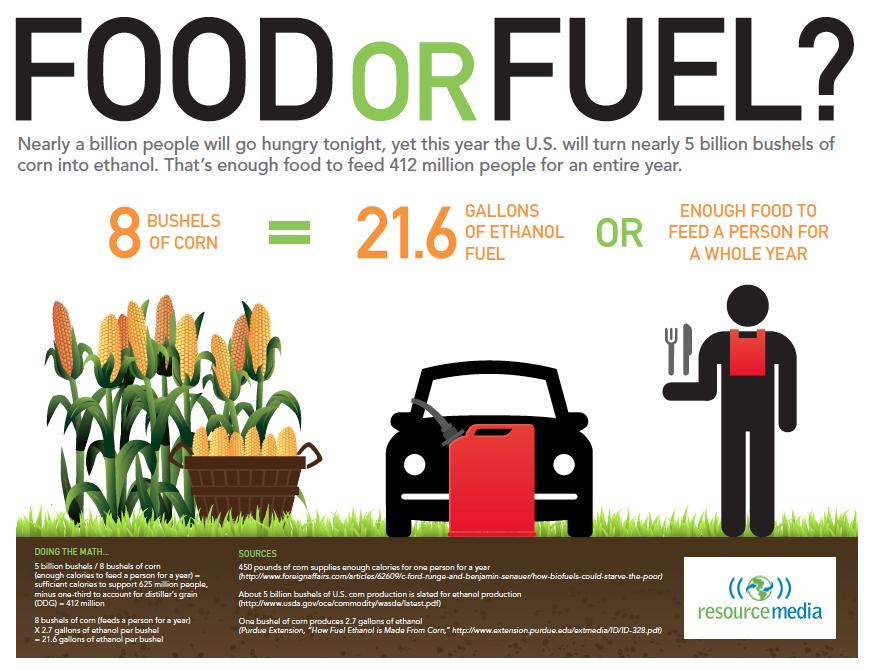
12 Competitive Advantage FOOD VS. FUEL 12 12


13 Feedstock Future luxresearch Yield (kg/ha/yr) Biofuels today (~2% of petroleum 0 use) Algae 15m T/yr 400k ha Cane Sugar beet Corn Wheat Rapeseed Sunflower, Barley Petroleum Palm, Soy Agricultural waste Forest harvest and waste Current cultivation area (million ha) Oil crops Sugar crops Non-crop biomass Equivalent annual petroleum use Conclusion: Biomass cultivation technologies and opportunities are highly local Biofuels use a small amount of biomass today Potential to become local and global constraint Biomass yield depends highly on local sun, soil, and water Losers: Purpose-grown energy crops and algae bioreactors Winners: Agricultural and forest waste Wildcards: low-capex and offshore algae
14 Market Capacity Capacity 50 MM Ton/year US 12 MM Ton/year Canada Repurposing 10% of this capacity would correspond to 12.4 Billion # sugar/year No. of Facilities Chemical Digesters in North America (2011) Canadian Pulp Mills US Pulp Mills Production Class ADSTPY (000 s)

15 OTFF Technical Services Technology Center with unmatched capability Industrial manufacturing environment Operating pilot plant Experienced Industry professionals Demonstrateable expertise (2012) Made 20 tons of wood derived clean lignocellulosic sugar Sold for a variety of fermentation applications Poised as outsourced technology partner to other businesses Lab & Pilot scale cellulosic feedstock development Manufacturing experience perspective in development work Engineering Services for limited project scopes Innovative and Creative follow through to meet customer goals Extensive piloting equipment & capability Validation of customers theoretical ideas/concepts Cellulosic sugar and acid analytical lab capabilities Capable of supplying cellulosic sugars for customer processes