Pails - Part Cost Reduction Opportunities. Rob Giles October 20, 2010
|
|
|
- Suzan Manning
- 5 years ago
- Views:
Transcription

1 Pails - Part Cost Reduction Opportunities Rob Giles October 20, 2010
2 Pail Part Cost 9% 5% 6% Resin Primary Equipment Energy (Incl. Process Utilities) Other 80%
3 5 Gallon Pail Part Cost Reduction Material Reduce Substitute Increase equipment productivity Reduce energy
4 Material Reduce Thinwall part design Reduce wall thickness Add ribs/structural elements IML for barrier IML for structure (development) Optimize current part designs Audit/optimize current production Reduce scrap Substitute Lower flow, tougher materials HDPE vs PP Coinjection (regrind) IP challenges 1 Gram HDPE at 15 sec cycle $3,000/year!
5 Ribs
 Previous design 63 grams (34 % weight reduction) 3.")
6 55 MFR PP, 41.5 grams (0.018 sidewall = 450 L/T) Previous design 63 grams (34 % weight reduction) 3.3 seconds, 0.13 s injection, 220 tonnes 2 Liter Pail In HyPAC

7 In Mold Labeling Common for decoration Some applications for barrier properties Why not structural? Consider Added Value
8 Audit/Optimize Current Production frequency Capability +/- 0.15% Current variation +/- 1% shot weight 940 g 960 g trace 3 trace 4 Target Weight 950 grams
9 Improved Repeatability frequency shot weight
10 Improved Repeatability - Potential Savings Current average weight 950 grams +/- 1% Current minimum acceptable weight 940 grams Achievable repeatability +/- 0.15% New average target weight 941 grams Resin savings = 9 grams/part At 15 second cycle, 8000 hours/yr, $0.70/lb resin, savings are $26,600/yr! Audit/Upgrade Existing Molds and Machines
11 VALUE OF 10 GRAM PART WEIGHT REDUCTION Annual Resin Savings, $ $38,000 $36,000 $34,000 $32,000 $30,000 $28,000 $26,000 $24,000 $22,000 $20, CYCLE, sec VALUE OF 10 GRAM PART WEIGHT REDUCTION


12 Reduce Gate Vestige
13 Cold Sprue

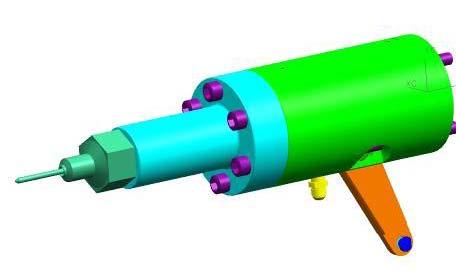
14 Pin Shut Off

15 Single Drop Hot Runner More precise temperature control at gate = less vestige, Better cooling at gate = faster cycle
16 Potential Savings Reduce gate vestige 1 gram at 15 second cycle, 8000 hours/yr, $0.70/lb resin, savings are $3,000/yr per system eliminate manpower to trim gates One customer in Latin America has 3 people/shift = $40k/yr reduce part failure frequency Less concern about cycle interruptions more production hours per system Faster cycles more output per system
17 Material Substitution PP vs HDPE Lower Specific Gravity Lower Heat Capacity Lower Melt Temperature Material Cost HDPE PP
18 RESIN PRICES OCT SEPT RESIN PRICES $US/lb IMPACT CO-PP BOTTLE PET CRYSTAL PS HDPE OCT JAN JUL FEB APR OCT SEPT DATE Source: Plastics News

19 HDPE vs PP Resin Savings PP HDPE Weight, g Material cost, $/lb Material cost per pail, $ Difference, $ PP pail has to be lightweighted 20% to make up for material price difference Resin Prices September 2010
20 Increase Equipment Productivity Faster clamp cycles Faster injection performance Improved uptime Improved repeatability Reduced scrap Increase cavitation

 Faster actuators Linear bearings Lighter weight,")
21 Faster Clamp Cycles High performance position/velocity/pressure/temp sensors EtherCAT fieldbus = faster reaction time Powerful IPC with fast scan rates (250 microseconds) Faster actuators Linear bearings Lighter weight, FEA designed cast platens Speed With Control
22 CLAMP DRY CYCLE SECONDS DRY CYCLE YEAR 500 Ton Clamp, 900 mm Clamp Stroke
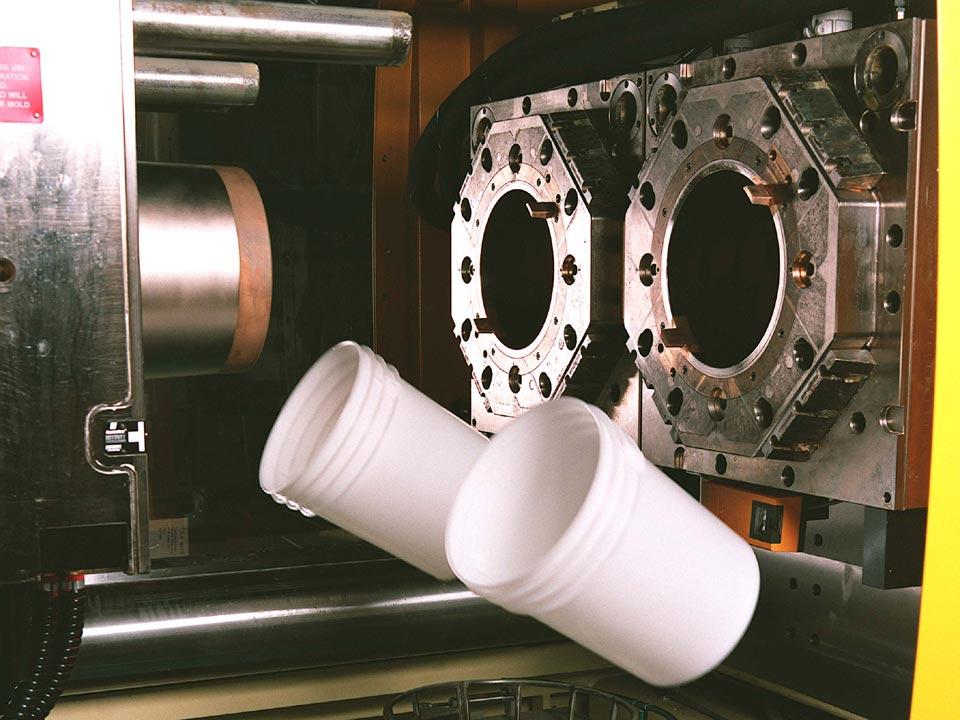
23 Increase Productivity
24 Injection Cycle Improvements Sensors / fieldbus / IPC / actuators as discussed in clamp improvements Process optimization, overlapping functions More responsive injection 85 mm screw can fill 950 gram pail in 0.6 sec! Higher recovery rates Optimized screw designs Faster, more powerful, more responsive screw drives
25 SINGLE CAVITY 950 G. 5 GALLON HDPE PAIL INJECTION UNITS 350 THROUGHPUT THROUGHPUT, KG/HR CYCLE TIME, SEC RS115/100 HIGH POWER RS95/85 HIGH OUTPUT RS95/90L HIGH POWER RS95/85 HIGH POWER
26 ANNUAL OUTPUT OUTPUT, MM ANNUAL OUTPUT, MM CYCLE, SEC
 465 tonnes (513 US tons) 1.8 sec 80.")
27 Filling: 1 drop Fill Time Cavity Pressure Clamp Force (per cavity) 1.4 sec 83.8 MPa (12,154 psi) 465 tonnes (513 US tons) 1.8 sec 80.9 MPa (11,734 psi) 451 tonnes (497 US tons)
 430 tonnes (474 US tons) 1.8 sec 67.")
28 Filling: 3 drop Fill Time Cavity Pressure Clamp Force (per cavity) 1.4 sec 70.1 MPa (10,167 psi) 430 tonnes (474 US tons) 1.8 sec 67.8 MPa (9834 psi) 418 tonnes (461 US tons) 8% Less Clamp Tonnage
29 Machines Energy Reduction Hybrid technology Hydromechanical or toggle clamps Servoelectric screw drives Direct drive option Hydraulic injection Right-sizing drives All-electric machines

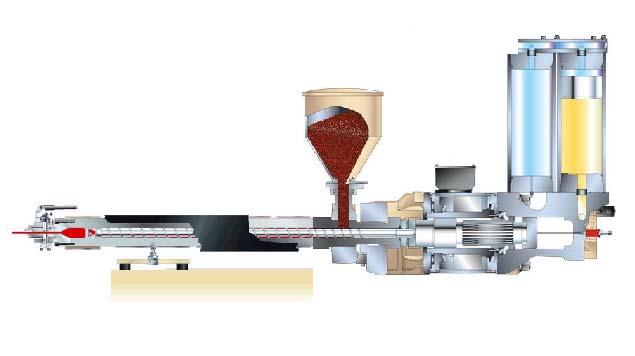
30 Hybrid Machines Hydromechanical Clamp Toggle Clamp E Drive RS Direct E Drive RS

31 5 GALLON PAILS - ENERGY CONSUMPTION kwh/kg YEAR ENERGY CONSUMPTION Energy required to melt HDPE = 0.18 kwh/kg 0.1 kwh/kg $0.10/kWh
32 Cost of an Injection Molded Part ENERGY 2% 4% 2% 1% 2% 5% 5% 4% 3% 2% 1%1% 9% 10% 59% 11% 4% Material Machine Molds Labor Cooling Space Other Energy 80% Machinery Heat, Vent, A.C. Lighting Chillers Cooling Tower Compressors Grinders Tools Misc.

33 Implementation of policies and procedures to measure, set targets, and monitor energy related KPIs to continuously reduce and sustain energy consumption Total Energy Management
34 Thank You! Questions/Comments?