Climate and Materials Management. SERDC November 3, 2009 Jennifer Brady USEPA Office of Resource Conservation and Recovery
|
|
|
- Paulina Stokes
- 5 years ago
- Views:
Transcription
1 Climate and Materials Management SERDC November 3, 2009 Jennifer Brady USEPA Office of Resource Conservation and Recovery
2 How are Waste and Climate Connected?? What is the Life Cycle of a material? The simplified version: Raw material extraction (bauxite mining, tree harvesting, oil pumped from underground, etc.) Raw materials are processed into manufacturing inputs (trees made into paper, etc.) Products are made from manufacturing inputs Products are used End-of-life products (and other discards) are managed as recyclables or waste

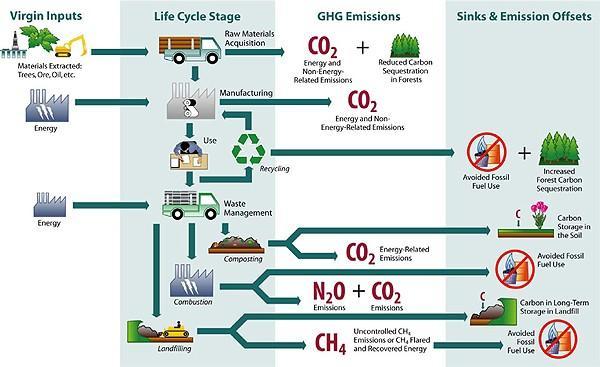
3 The Life Cycle
4 Greenhouse Gases There are many Greenhouse Gases (GHG) associated with the product life cycle (CO 2, CH 4, N 2 O, etc.), Each GHG has a different impact on global warming We normalize the data using Global Warming Potentials (GWP) a relative scale which compares the impact of the GHG to the impact of the same mass of CO 2 (GWP of CO 2 =1) for example, GWP for CH 4 = 21 and for N 2 O = 310 emissions of 1 million metric tons of CH 4 and N 2 O are equivalent to emissions of 21 and 310 million metric tons of CO 2, respectively Normalized GHG data are expressed as carbon dioxide equivalent, or CO 2 e
5 Upstream and Downstream Emissions You are standing in a stream of materials, holding a product that you just purchased Upstream of you is the part of the lifecycle where raw materials are extracted and processed, and goods are manufactured Downstream of you is where products are sent for reuse, materials are recycled, energy is recovered, or discards are landfilled.
6 Upstream Links GHG emissions associated with energy production are avoided through source reduction & recycling Replacement of discarded materials requires energy to extract, transport, and process raw virgin materials. Manufacturing products from recycled materials typically requires less energy than manufacturing from virgin materials.
7 Upstream Links continued Process energy GHGs comprise the majority of upstream emissions for the manufacture of both virgin and recycled materials on average, approximately 80 percent* The transportation energy associated with manufacturing accounts for a small share of upstream emissions on average less than 20%* *for materials considered in EPA s Waste Reduction Model
8 GHG emissions avoided by recycling rather than landfilling 100 tons of: Aluminum Cans Steel Cans Glass HDPE PET Corrugated Boxes Newspaper 1,371 MTOC2e 184 MTOC2e 32 MTOC2e 144 MTOC2e 159 MTOC2e 344 MTOC2e 191 MTOC2e
9 What s the impact of recycling on GHG emissions? In 2007, the U.S. recycled 33 % (85 million tons) of MSW 1 Avoided emissions of 193 million MTCO2e Equivalent to the annual GHG emissions of 35 million passenger vehicles (about 14 percent of passenger vehicles registered in the U.S.) Source:


10 Systems Based View of US GHG Emissions Source: USEPA, Opportunities to Reduce Greenhouse Gas Emissions through Materials and Land Management Practices, September 2009.
11 Legislation Kerry - Boxer Clean Energy Jobs and American Power Act Does include some provisions for recycling Money for State recycling programs Not part of cap and trade Waxman-Markey No recycling included
12 How do we measure the Waste and Climate Connection?? The Waste Reduction Model (WARM) WARM was designed to provide waste managers with a simple tool to help them understand and evaluate the greenhouse gas implications of their waste management decisions
13 Emission factors developed for: Source reduction Recycling Composting Combustion Landfilling 26 material types and 6 categories of mixed materials (paper, metals, plastics, organics, MSW, and recyclables)
14 Materials in WARM Aluminum Cans Magazines/Third-class Mail Food Scraps Steel Cans Medium Density Fiberboard Yard Trimmings Copper Wire Corrugated Cardboard Grass Glass Dimensional Lumber Leaves HDPE Mixed Paper (3 categories) Branches LDPE Mixed Metals Carpet PET Mixed Plastics PCs Newspaper Mixed Organics Clay Bricks Office Paper Mixed Recyclables Concrete Phonebooks Mixed MSW Fly Ash Textbooks Tires

15 Modelling the Waste-Climate Connection
16 Output
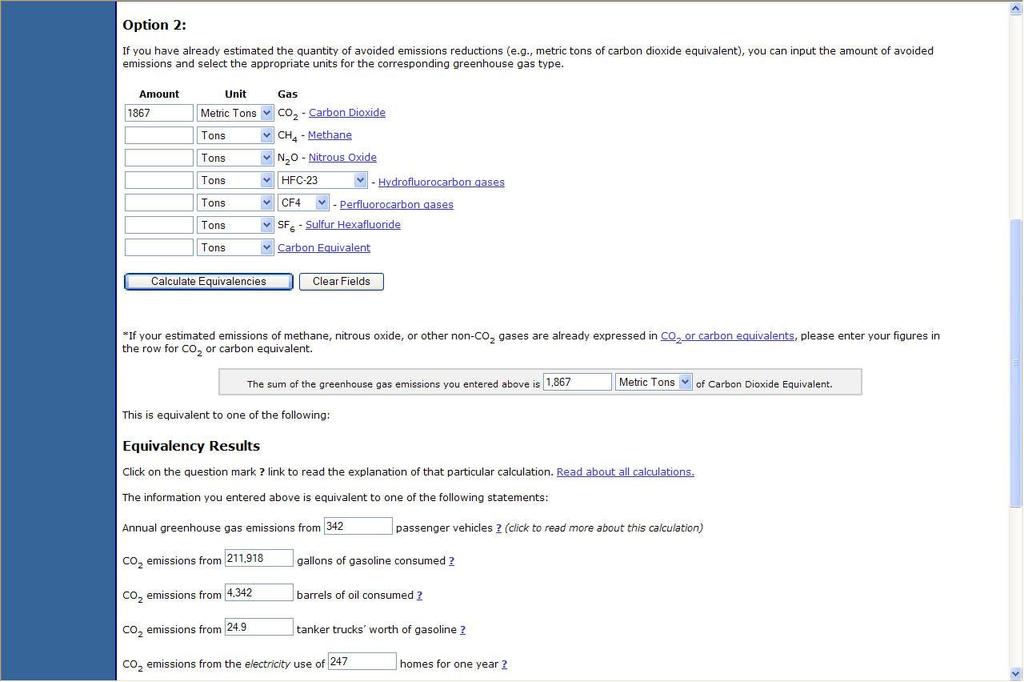
17 Equivalencies
18 Equivalencies Output Annual GHG emissions from passenger vehicles CO 2 Emissions from gasoline consumed CO 2 from the electricity used of homes
19 Contact Information Jennifer Brady USEPA Office of Resource Conservation and Recovery Phone: EPA s Waste Reduction Model