PROPERTY OWNERS MEETING SEWER SERVICE CHARGE RATES
|
|
|
- Amice Cole
- 5 years ago
- Views:
Transcription

1 PROPERTY OWNERS MEETING SEWER SERVICE CHARGE RATES Burlingame Hills Sewer Maintenance District Burlingame Public Library Lane Community Room 480 Primrose Road Burlingame, CA May 23, :30 P.M. County of San Mateo Department of Public Works
2 OVERVIEW OF TONIGHT S MEETING: District Information District Funding Elements of the Sewer Service Charge Rates In District Costs Out of District Costs Minimum Fund Reserve Targets Proposed Rates Rate Setting Timeline Questions and Comments

3 HISMD: Pipes ~ 1 Mile ERU BHSMD: Pipes ~ 7 Miles ERU CSCSD: Pipes ~ 19 Miles ERU 1,501 DCSD: Pipes ~ 4 Miles ERU ESMD: Pipes ~ 0.3 Miles ERU - 18 ELHSMD: Pipes ~ 29 Miles ERU 1,657 SHCSD: Pipes ~ 2 Miles ERU - 58 OKSMD: Pipes ~ 2 Miles ERU KSSMD: Pipes ~ 0.8 Miles ERU - 74 FOSMD: Pipes ~ 81 Miles ERU 12,597

4 DISTRICT BOUNDARY MAP: Sewage Flows Through City of Burlingame To The City s Treatment Plant At 1103 Airport Boulevard For Treatment Burlingame District Boundary Millbrae Burlingame Hillsborough Hillsborough
5 SEWER/SANITATION DISTRICTS IN COUNTY GOVERNMENT: EACH DISTRICT IS AN INDEPENDENT ENTITY WITH ITS OWN SEPARATE BUDGET Each District s Governing Board is the Board of Supervisors The District receives Sewer Service Charges and limited property taxes within the District boundaries to fund sewer service The Sewer Service Charges are a Fee For Service, Not a Tax The District collects Sewer Service Charges on the Tax Bill because it is least costly way to collect the fee
6 WHERE DOES MY PROPERTY TAX MONEY GO? BHSMD Sample Property Tax Allocation (TRA ) Burlingame Hills Sewer 2.22% County Harbor District 0.45% Air Quality Mngmnt 0.27% San Mateo Jr. College 8.64% Mosquito Abatement 0.24% Peninsula Hospital Dist 1.17% County Education Tax 4.50% General County Tax 30.21% San Mateo High 22.03% Burlingame Elem 17.69% Free Library 4.40% County Fire Protection 8.19%
7 DISTRICT SPECIFIC STATISTICS: District Age (yrs) * Number of Connections ** Equivalent Residential Units ** Downstream Transport Agency Treatment Facility Burlingame SMD City of Burlingame City of Burlingame *Age based on District formation date ** Based on SSC Report District Miles of Pipe Percentage in Easements Percentage in Streets Burlingame SMD % 59.43%
8 ORGANIZATIONAL STRUCTURE OF DISTRICTS: SAN MATEO COUNTY BOARD OF SUPERVISORS COUNTY MANAGER'S OFFICE DEPARTMENT OF PUBLIC WORKS James C. Porter, Director UTILITIES-FLOOD CONTROL-WATERSHED PROTECTION SECTION Ann M. Stillman, Principal Civil Engineer BURLINGAME HILLS SMD DEVONSHIRE CSD EMERALD LAKE HEIGHTS SMD HARBOR INDUSTRIAL SMD OAK KNOLL SMD CRYSTAL SPRINGS CSD EDGEWOOD SMD FAIR OAKS SMD KENSINGTON SQUARE SMD SCENIC HEIGHTS CSD


9 HOW DOES A SEWER SYSTEM WORK? Each District Relies On Downstream Agencies To Transport The District Collected Sewage To The Treatment Plant Image Source: Pixel-Gym

10 DISTRICT EXPENSES: IN DISTRICT COSTS: Operation and Maintenance Regulation Compliance District Capital Improvement Projects OUT OF DISTRICT COSTS: Sewage Transport and Treatment Downstream Agency Capital Improvement Projects
11 DISTRICT EXPENSES: Burlingame Hills Sewer Maintenance District FY Proposed Balanced Budget Rate of $1,275 Per ERU Other Revenue (Tax Revenue & Interest) 8.8% Regulations 3.9% Fund Reserve * 9.6% In District O&M 16.6% Treatment 30.1% * Contributes to Fund Reserve District CIP 30.1% Out of District CIP 0.9%
12 DISTRICT EXPENDITURE COMPARISON Burlingame Hills Sewer Maintenance District Fiscal Year and Expenditure Comparison Expenditure ($) $500,000 $400,000 $300,000 $200,000 Regulations District CIP O&M Out of District CIP $100,000 Treatment $- Out of District CIP costs are lower in FY due to City s 25-year Revenue Bonds Fiscal Year


13 OPERATION AND MAINTENANCE: ROUTINE AND PREVENTATIVE MAINTENANCE REPAIR OF DAMAGED PIPES EMERGENCY RESPONSE CUSTOMER ASISTANCE DISTRICT ADMINISTRATION


14 OPERATION AND MAINTENANCE: EMERGENCY RESPONSE 24 HOURS A DAY, 7 DAYS A WEEK Image Source: City of Irving, Texas


15 OPERATION AND MAINTENANCE: ANTICIPATED EXPENDITURES FOR FUTURE OPERATION & MAINTENANCE BASED ON 5-YEAR HISTORICAL COSTS 4% annual increase for inflation 3% O&M contingency to account for unanticipated expenses
16 REGULATION COMPLIANCE: THE DISTRICTS ARE REGULATED BY: The Regional Water Quality Control Board The State Water Resources Control Board The State Porter-Cologne Act The Federal Clean Water Act


17 REGULATION COMPLIANCE: GOAL TO ELIMINATE SANITARY SEWER OVERFLOWS (SSO) What is a SSO? Raw Sewage Leaves the Pipe and Flows on the Ground Surface Sewage, if Not Captured, Can Reach Storm Drains, Creeks, Lakes, the Bay, and Ocean SSO from Manhole SSO from Manhole Near Creek SSO from Cleanout


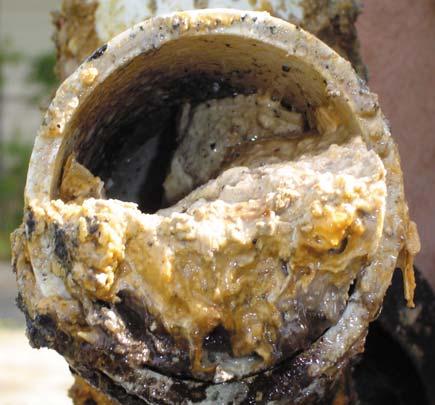

18 REGULATION COMPLIANCE: WHAT CAUSES A SSO? Blockages, breaks, and Infiltration & Inflow in the sewer pipe will cause a SSO.


19 REGULATION COMPLIANCE: WHY IS IT IMPORTANT TO ELIMINATE SSOs? UNTREATED SEWAGE IS A THREAT TO PUBLIC HEALTH, ANIMALS, AND THE ENVIRONMENT.
20 REGULATION COMPLIANCE: WHY IS IT IMPORTANT TO ELIMINATE SSOs? AGENCIES HAVE BEEN LEVIED STIFF PENALTIES OR PAID LARGE SETTLEMENTS IN LAWSUITS FOR SSOs. Notice of Violation & Intent to File Suit (60-Day Notice) Plaintiffs Baykeeper, West County Toxic Coalition Lawyers for Clean Water Environmental Advocates vs. Defendants West County Wastewater District (WCWD) City of Richmond Veolia Water NA Downey Brand LLP Collection System Settlement Agreement o o o WCWD Collection System Capital Improvement Program o Commit $5M over 10 years System Evaluation and Capacity Assurance Plan (SECAP) o Revise within 18 months o Update 2015 o CCTV-Sewer Condition Grading o Gravity Sewer Line Cleaning Schedule o <12 once every 4 years o >12 once every 10 years o Design for 5 year-24/hr Storm Event o Continue FOG Program - Increase FSE Inspections Attain SSO Reduction Goals Fines!!! Settlement Agreement Fees WCWD/Richmond/Veolia owca NPDES Effluent Limit Violations The San Francisco Bay Regional Water Quality Control Board imposed a $516,000 fine to the City of South San Francisco in 2006 for sewer overflows and a $626,000 administrative civil liability to the City and County of San Francisco in an impending order. osep Rose Foundation $80,000 oattorneys Fees (Plaintiff) $57,000 ocollection System Settlement Fees oattorneys Fees (Plaintiff) - $538,000 ooversight Cost (Plaintiff) - $100,000 oattorneys Fees (Defendants) - $300,000 ostaff Resources/In-house Counsel - $50,000 osettlement Agreement was reached in 15 months
21 REGULATION COMPLIANCE: What are the Districts required to do? Develop Sewer System Management Plans (SSMP) Report all SSOs
22 REGULATION COMPLIANCE: Sewer System Management Plan (SSMP) Goals: Maintaining or improving the condition of collection systems to provide reliable service in the future Cost-effectively minimizing infiltration/inflow (I&I) and providing adequate sewer capacity for wet weather flows Minimizing the number and impact of SSOs
23 REGULATION COMPLIANCE: What are the elements of a SSMP and when do they need to be completed by? Aug Aug Aug Collection system management goals Organization of personnel, chain of command, and communications Overflow emergency response plan Fat, Oils and Grease (FOG) control program Legal authority for permitting flows into the system, I&I control and enforcement of proper design, installation, testing standards and inspection requirements for new and rehabilitated sewers Measures and activities to maintain the wastewater collection system Design and construction standards Capacity Management Monitoring plan for SSMP program effectiveness Periodic SSMP Audits, periodic SSMP updates, and implementation of program Communication Program
24 REGULATION COMPLIANCE: What SSMP Elements were factored into the rates? Condition Assessment through Closed Circuit Television Inspection (CCTV) of pipes 1/6 of system per year Spot Repairs Repairing sections of pipe based on CCTV findings Repair 2% of televised pipe system per year Equipment Upgrades Replacing, upgrading, or purchasing equipment for effective maintenance of sewer system Regulatory Requirements and Reporting Costs associated with required reporting and SSMP development
25 DISTRICT CAPITAL IMPROVEMENT PROJECTS (CIP): High priority CIPs identified in Sewer Master Plans completed in 1999 and 2000 Improvements recommended based on Lack of capacity in pipe Priority 1 Excessive maintenance costs Priority 2 Damaged pipes Priority 3
26 DISTRICT CAPITAL IMPROVEMENT PROJECTS (CIP): What was recommended in my District? District CIP Identified in Sewer Master Plan Priority Number of Projects Identified Length of Pipe to be Upgraded Estimated Construction Cost Priority 1 Capacity 2 ~ 1,820 $379,500 Priority 2 Maintenance 2 ~ 4,120 $679,700 Priority 3 Structural 3 ~ 5,040 $ 830,800 Totals 7 10,980 ft. * $1,890,000 ** * CIP Lengths Identified Represent Approximately 28.9% of District s Total Length of Sewer Mains (37,972 feet). ** Estimated cost includes design, administration, and inspection
27 DISTRICT CAPITAL IMPROVEMENT PROJECTS (CIP): Recommended CIP in my District:
28 DISTRICT CAPITAL IMPROVEMENT PROJECTS (CIP): What projects still need to be completed? Remaining District CIP Priority Number of Projects Length of Pipe to be Upgraded Estimated Construction Cost Priority 1 Capacity 2 ~ 1,820 $379,500 Priority 2 Maintenance 2 ~ 4,120 $679,700 Priority 3 Structural 3 ~ 5,040 $ 830,800 Totals 7 10,980 ft. * $1,890,000 ** * Remaining CIP Lengths Represent Approximately 28.9% of District s Total Length of Sewer Mains (37,972 feet). **Estimated cost includes design, administration, and inspection

29 DISTRICT CAPITAL IMPROVEMENT PROJECTS (CIP): How were the CIP costs factored into the rates? Costs for CIPs were spread over 10 years 5% contingency applied for capital work Districts pipes are greater than 70 years old
30 OUT OF DISTRICT COSTS: Sewage Transport Treatment and Disposal Downstream Agency Capital Improvement Projects
31 SEWAGE TRANSPORT, TREATMENT, AND DISPOSAL: Each District has an Agreement with the downstream agency for sewage transport, treatment, and disposal BHSMD has an agreement with the City of Burlingame
32 SEWAGE TRANSPORT, TREATMENT, AND DISPOSAL: What does the Agreement specify? The District will pay the City of Burlingame: Collection System Cost (Transport) District pays 1.7 percent of total cost of operation and maintenance of City s system, as well as improvement projects District pays an additional 15% for overhead and supervision associated with collection system operation and maintenance
33 SEWAGE TRANSPORT, TREATMENT, AND DISPOSAL: What does the Agreement specify? The District will pay the City of Burlingame: Treatment Cost District s percentage of total treatment cost is based on the proportionate share of water consumed in the District versus all other areas that contribute sewage to the treatment plant District pays an additional 15% for overhead and supervision of plant operation and maintenance
34 SEWAGE TRANSPORT, TREATMENT, AND DISPOSAL: Payments to the City include reimbursing the City for the use of their sewer system and treatment facility, operation and maintenance costs associated with the usage, and capital improvement projects on the City s facilities The City raised their rates in 2006 by 9.5% (from an average rate of $530 to $580 per ERU) 28.5% total increase over 3 years ( ) The City s rates will increase by 9.5% in 2007 and 9.5% in 2008
35 SEWAGE TRANSPORT, TREATMENT, AND DISPOSAL: What affects the rates the District pays the City? Capital Improvement Projects on City s sewer system Capital Improvement Projects at the City s Treatment Plant City has bond financed approximately $20 million for recent system and treatment plant improvements Future capital improvements will be based on payas-you go financing after the revenue bonds are depleted City will be charging the District for a portion of cost of the improvements

36 SERVICES PROVIDED BY DISTRICTS: SEWAGE TREATMENT AND DISPOSAL PROCESS Image Source: SBSA
37 SEWAGE TRANSPORT, TREATMENT, AND DISPOSAL: A portion of the SSC rates were calculated to pay for transport, treatment, disposal and anticipated increases in treatment costs, and downstream capital improvements Based on information from downstream agencies or assumed increases based on historical data 3% contingency applied
38 MINIMUM FUND RESERVE TARGETS: 50% of Operations and Maintenance Costs (6 mo.) and 3% of the replacement value (Best Management Practices) or $100,000 for small districts District Replacement Value * Minimum Fund Reserve Target Burlingame SMD $4,113,000 $265,000 *Replacement value includes construction costs only
39 PROPOSED RATES: Balanced Budget SSC Rates determined to meet anticipated expenditures immediately Phased Increase SSC Rates determined to steadily increase to meet future expenditures Phased Increase may rely on Fund Reserve to meet future expenditures
40 PROPOSED RATES: Sewer Service Charge Rate ($/Year Per Residential Unit) Proposed Rates Balanced Budget $1,275 $1,275 $1,275 $1,375 $1,475 BHSMD Phased Increase $812 $950 $1,200 $1,400 $1,500 $1,600
41 SSC vs FUND RESERVE: Burlingame Hills Sewer Maintenance District Sewer Service Charge Options and Beginning FY Fund Reserve Fund Reserve ($) $400,000 $1,750 Fund Reserve (Balanced) $350,000 Min Target Fund Reserve $1,600 $300,000 $250,000 $297,790 $271,641 $1,450 $1,300 Balanced SSC $200,000 $1,150 $150,000 $1,000 $100,000 $850 Fund Reserve (Phased) Phased SSC $50,000 $ Fiscal Year Sewer Service Charge Rate ($)
42 RATE SETTING PROCESS: Key Dates May 2, 2007 Early/Mid May May 15 Mid/End of May June 5 June 8 July 24 Actions Sent all property owners information about sewer systems and what their sewer service charge pays for. Sent all property owners information about proposed rates and timing of meetings with property owners. District staff provided Board with status update on proposed sewer service charge rates and received approval of proposed process and elements of the rates. Meetings with property owners of each district to discuss the proposed rates, factors involved in establishing rates, and seek property owner input. Introduce Ordinance with proposed sewer service rates for through fiscal years and set Public Hearing for July 24 at 9:15am. Send Prop 218 notice (45 days prior to public hearing) to property owners with proposed rates. Hold public hearing, adopt Ordinance setting rates, and adopt Sewer Service Charges Report based on the adopted rates.
43 QUESTIONS & INPUT District Services Rate Development Rate Adoption Process and Schedule Others
44 CONTACT INFORMATION Please your comments and questions to: Information is available on our website at: