2017 Water Quality Report and Historical Analysis. Long Lake Mickey Lake Ruth Lake. Monitoring Years
|
|
|
- Miles Brooks
- 5 years ago
- Views:
Transcription


1 2017 Water Quality Report and Historical Analysis Long Lake Mickey Lake Ruth Lake Monitoring Years Submitted to: Long Lake Association October 2017 Prepared by: Great Lakes Environmental Center 739 Hastings St. Traverse City, MI Northwestern Michigan Community College Great Lakes Water Studies Institute 1701 E. Front St. Traverse City, MI Interns: Kathryn DePauw and Chelsea Cooper
2 Section I 2017 Long Lake, Mickey Lake, and Page Lake Water Quality Assessment 4 Long Lake Water Chemistry Data 8 Mickey Lake Water Chemistry Data 10 Ruth Lake Water Chemistry Data 12 Long Lake Physical Data 14 Mickey Lake Physical Data 17 Ruth Lake Physical Data 19 Dissolved Oxygen/Temperature Depth Profiles 20 Section II Historic Data Trends 26 Long Lake 27 Mickey Lake 36 Ruth Lake 39 Page Lake 42 Fern Lake 44 Seasonal Comparative Graphs 46 Section III References 48 1

3 Figure 1. Water quality sampling sites on Long Lake,
4 Table 1. Trophic State Classification (Chapra, 1997) Variable Oligotrophic Mesotrophic Eutrophic Total Phosphorus (μg/l) < >20 Chlorophyll a (μg/l) < >10 Secchi depth (ft) > >6.6 Table 4. Phosphorus Data for Area Lakes and Sediments Water Total Sediment Phosphorus Lake Phosphorus (μg/l) (mg TP/kg DW) Torch Burt Lime Crystal North Leelanau South Leelanau Glen Little Traverse Cedar Platte Mickey Site (top) (bottom) Mickey Site (top) (bottom) 3
5 Section I 2017 Long Lake, Mickey Lake, and Page Lake Water Quality Assessment The 2017 Long Lake, Mickey Lake, and Page Lake monitoring was initiated by the Long Lake Association in partnership with Great Lakes Environmental Center (GLEC) and Great Lakes Water Studies Institute. The point of this monitoring was to continue assessing the lake water quality and compare it to the collection of older data. By looking at emerging trends in water quality, concerns can be addressed and appropriate action plans created. The 2017 season s monitoring of Long, Mickey and Ruth Lake s water quality data was collected using the following equipment: 1) Water quality and measurement of water chemistry by using a YSI multiparameter water quality probe (supplied by GLEC), as well as collecting water samples for analysis of total phosphorus at the surface and near bottom, and a single calcium sample at each sampling site; 2) levels of Chlorophyll a at each sampling site (an indirect indicator of algae in the water column); and 3) measurement for secchi disk depth at each of the sampling points. Long Lake Water Chemistry Total Phosphorus: As noted in 2014 s report, Long Lake s phosphorus numbers were slightly higher than other area lakes. While this year s levels were slightly higher than last year's, Long Lake currently compares favorably in this area. There were higher 4
6 concentrations of near bottom phosphorus, especially in the late summer. Site 1 and 2 had the greatest increase when compared to Chlorophyll a: Chlorophyll a numbers are comparative to what we saw in the lake between Levels are slightly up, but not significantly enough to raise question. This may be indicative of a normal increase in the algal community as the water warms. Chlorophyll a numbers can vary widely from year to year and can be influenced by the time of year they were sampled, or by the specific environmental conditions present on the lake during the year. Secchi Depth: The secchi depths (measure of water clarity) as measured during the 2017 Spring/Summer sampling season fall in range of previous years, but are slightly lower than last year. It should be noted that numbers can vary widely from year to year and can be influenced by the time of year they were sampled, or by the specific environmental conditions present on the lake during the year. Hydrolab (Physical) Data Hydrolab profiles for Spring and Summer exhibited much of the same healthy characteristics as we ve seen in previous years. As expected, DO levels declined with depth due to temperature stratification of the lake that occurs during summer in the deeper areas, and spring s DO levels were desirable. In 2014, there was concern of anoxic conditions and prolonged DO deficits near bottom sediments that lead to a release of phosphorus bound in the sediments, contributing to the lake s higher phosphorus levels. This year the DO levels seem typical for this lake, but due to historical low oxygen trends in the hypolimnion, could potentially be a significant source of internal loading of phosphorus in Long Lake. Because of past slightly elevated 5
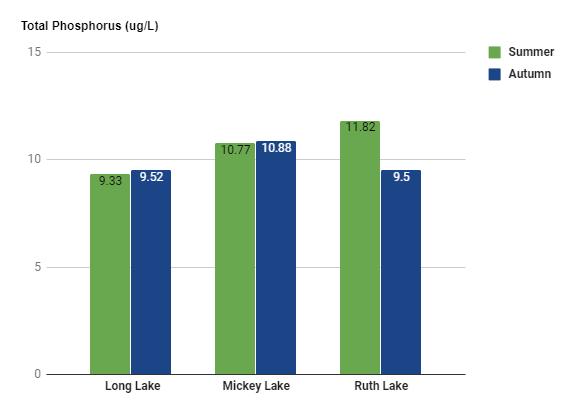
7 sediment phosphorus levels, it is recommended that additional sediment samples be taken from the three sampling points and analyzed for phosphorus again within the next two to three years. All other water quality data fell within healthy parameters and oligotrophic conditions are highly observable. Conclusions The data from this year s sampling season indicate that Long Lake would continue to be considered an oligotrophic, high quality lake based on total phosphorus in the water, chlorophyll a and secchi disk readings. Long Lake s 1, 2 and 3 testing sites total phosphorus numbers are well under the cutoff to be considered oligotrophic, according to the state s classifications (table 1.) This oligotrophic classification has been maintained for the past 20 years, since formal documentation of the lake first began. This can be fully determined on the next date that sediment phosphorus samples are taken. It is recommended that Long Lake continue to have a comprehensive outreach and education component regarding nutrient use near the lakeshore, as well as continuing efforts for surface water runoff control. These will all help limit the introduction of additional phosphorus to the lake ecosystem and help preserve its long held oligotrophic status. Mickey and Ruth Lake Water Chemistry Total Phosphorus: Total phosphorus levels in Mickey Lake were within the oligotrophic range, however, Ruth Lake crossed over into mesotrophic. Because Ruth Lake is more hydrologically separated from Long Lake than Mickey, and somewhat shallower, phosphorus accumulations in sediments may be more pronounced. 6
8 Chlorophyll a: Chlorophyll a data for Mickey Lake compares to the last sample taken (2014.) Ruth Lake s levels were significantly lower, but Chlorophyll a numbers can vary widely from year to year and can be influenced by the time of year they were sampled, or by the specific environmental conditions present on the lake during the year. A field error is also possible. Secchi Depth: Clarity of Mickey Lake is down a few meters from last year, and Ruth Lake s clarity has been historically low due to it s tannic qualities. It should be noted that secchi readings can vary widely from year to year and can be influenced by the time of year they were sampled, or by the specific environmental conditions present on the lake during the sampling. Hydrolab (Physical) Data Hydrolab data is also comparative to previous years for both lakes. Water quality in these lakes are generally good, and dense plant growth, low clarity and slightly elevated phosphorus levels are to be expected from Ruth Lake. Both lakes are not completely hydrologically separate from Long Lake, but the connection is shallow enough, especially with Ruth, that there is likely not a rapid exchange in rate between the lakes. Conclusions It is only recommended that approaches which limit phosphorus additions to the lake (lakeshore management) will help to reduce the phosphorus loading and subsequent accumulations in both Mickey and Ruth Lake. 7
9 Long Lake Water Chemistry Data June 9, 2017 Chlorophyll a (μg/l) Site 1 Site 2 Site Total Phosphorus (μg/l) Sample Location Site 1 Site 2 Site 3 Near Surface Near Bottom Calcium (mg/l) Site 1 Site 2 Site
10 Long Lake Water Chemistry Data August 9, 2017 Chlorophyll a (μg/l) Site 1 Site 2 Site Total Phosphorus (μg/l) Sample Location Site 1 Site 2 Site 3 Near Surface Near Bottom Calcium (mg/l) Site 1 Site 2 Site
11 Mickey Lake Water Chemistry Data June 9, 2017 Chlorophyll a (μg/l) Site 1 Site Total Phosphorus (μg/l) Sample Location Site 1 Site 2 Near Surface Near Bottom 28.1* 9.6 * Possible contamination from bottom sediment Calcium (mg/l) Site 1 Site
12 Mickey Lake Water Chemistry Data August 9, 2017 Chlorophyll a(μg/l) Site 1 Site Total Phosphorus (μg/l) Sample Location Site 1 Site 2 Near Surface Near Bottom Calcium (mg/l) Site
13 Ruth Lake Water Chemistry Data June 9, 2017 Chlorophyll a (μg/l) Site Total Phosphorus (μg/l) Sample Location Site 1 Near Surface 17.8 Calcium (mg/l) Site
14 Ruth Lake Chemistry Data August 9, 2017 Chlorophyll a (μg/l) Site Total Phosphorus (μg/l) Location Site 1 Near Surface 13.7 Calcium (mg/l) Site
15 Physical Data 2017 Long Lake Site #1 May 25th 2017 Air temperature: 52 Weather: overcast Average Secchi Depth: 10.1 m. Depth (m.) Temperature( ) Dissolved Oxygen (mg/l) ph Conductivity (μs/m) Surface Long Lake Site #1 August 9th 2017 Air temperature: 73 Weather: Sunny Average Secchi Depth: 5.95 m. Depth (m.) Temperature( ) Dissolved Oxygen (mg/l) ph Conductivity (μs/m) Surface
16 Long Lake Site #2 May 25th 2017 Air temperature: 54 Weather: overcast Average Secchi Depth: 9.8 m. Depth (m.) Temperature( ) Dissolved Oxygen (mg/l) ph Conductivity (μs/m) Surface ~ Long Lake Site #2 August 9th 2017 Air temperature: 76 Weather: partly sunny Average Secchi Depth: 6.1 m. Depth (m.) Temperature( ) Dissolved Oxygen (mg/l) ph Conductivity (μs/m) Surface
17 Long Lake Site #3 May 25th 2017 Air temperature: 54 Weather: light rain Average Secchi Depth: 10.3 m. Depth (m.) Temperature( ) Dissolved Oxygen (mg/l) ph Conductivity (μs/m) Surface Long Lake Site #3 August 9th 2017 Air temperature: 78 Weather: sunny Average Secchi Depth: 5.75 m. Depth (m.) Temperature( ) Dissolved Oxygen (mg/l) ph Conductivity (μs/m) Surface
18 Mickey Lake Site #1 May 25th 2017 Air temperature: 57 Weather: overcast Average Secchi Depth: 4.1 m. Depth (m.) Temperature( ) Dissolved Oxygen (mg/l) ph Conductivity (μs/m) Surface Mickey Lake Site #1 August 9th 2017 Air temperature: 78 Weather: sunny Average Secchi Depth: 3.85 m. Depth (m.) Temperature( ) Dissolved Oxygen (mg/l) ph Conductivity (μs/m) Surface
19 Mickey Lake Site #2 May 25th 2017 Air temperature: 57 Weather: light rain Average Secchi Depth: 4.4 m. Depth (m.) Temperature( ) Dissolved Oxygen (mg/l) ph Conductivity (μs/m) Surface ~ Mickey Lake Site #2 August 9th 2017 Air temperature: 78 Weather: sunny Average Secchi Depth: 4.45 m. Depth (m.) Temperature( ) Dissolved Oxygen (mg/l) ph Conductivity (μs/m) Surface
20 Ruth Lake Site #1 May 25th 2017 Air temperature: 52 Weather: light rain Average Secchi Depth: 1.1 m. Depth (m.) Temperature( ) Dissolved Oxygen (mg/l) ph Conductivity (μs/m) Surface Ruth Lake Site #1 August 9th 2017 Air temperature: 80 Weather: sunny Average Secchi Depth: 0.75 m. Depth (m.) Temperature( ) Dissolved Oxygen (mg/l) ph Conductivity (μs/m) Surface
21 Dissolved Oxygen/Temperature Depth Profiles
22 21
23 22
24 23
25 24
26 25
27 Section II Historic Data Trends Historical data trends for Mickey Lake, Ruth Lake, and Long Lake were established by processing yearly data reports from which were submitted by GLEC, Dr. Fusilier, and raw data collected by the Northwestern Michigan College interns in The intention is to create a long term picture of the lakes over time. This allows damaging trends in water quality to be identified and corrected, while also maintaining the healthy parameters already established. Parameters include seasonal total water Phosphorus, sediment Phosphorus, seasonal Chlorophyll a, seasonal secchi depth readings, total Nitrate Nitrogen, and Calcium. Dissolved Oxygen and temperature profiles are not included in this report and it is recommended that this historical data should be included in future reports. There is also historical ph, alkalinity, conductivity, and lake water quality index data that can also be added to this report at a later time. In collecting the data and creating consistency across the various years, several issues needed to be addressed. Data found within reports was assumed to be accurate, unless discrepancies were noted across the historical data. The original report data was used in instances where there were discrepancies. The transition from Spring/Summer to Autumn was established as October 15. Some measurements were converted to create a complete metric record. Possibly contaminated samples are noted in the data when noted in the reports. In the cases where only one sample has been collected, no graphs were created since no trend could be established. 26

28 Long Lake 27
29 * In 2005 there was possible sediment contamination in a sample. This sample was included in the graph, but the overall trend downward is still consistent with what we see in the spring/summer samples. This trend could be slightly more significant if not considering this sample. 28
30 29
31 Sediment Phosphorus (mg/kg) SPRING/SUMMER

32 * There was only 1 bottom sample taken in 2005, so it is not included in the graph. It would have decreased the slope of the trend slightly, but not significantly. The one autumn sample year, 2005, is also not included since no trend could be established. 31

33 Chlorophyll a (µg/l) AUTUMN
34 33
35 34
36 Calcium (mg/l) SPRING/SUMMER
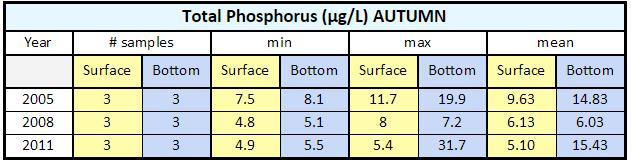
37 Mickey Lake Total Phosphorus (µg/l) SPRING/SUMMER Surface Bottom Surface Bottom Surface Bottom Surface Bottom * * Possible contamination from bottom sediment Total Phosphorus (µg/l) AUTUMN Surface Bottom Surface Bottom Surface Bottom Surface Bottom
38 Sediment Phosphorus (mg/kg) SPRING/SUMMER * There has been no Nitrate/Nitrite Nitrogen data collected on Mickey Lake. Chlorophyll a (µg/l) SPRING/SUMMER Chlorophyll a (µg/l) AUTUMN
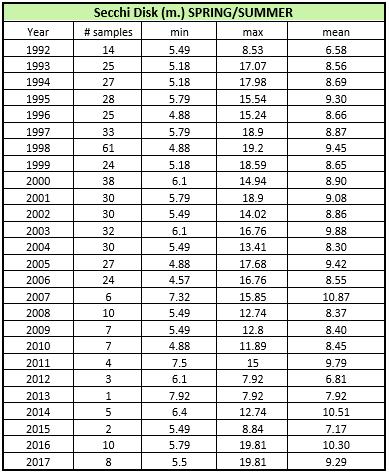
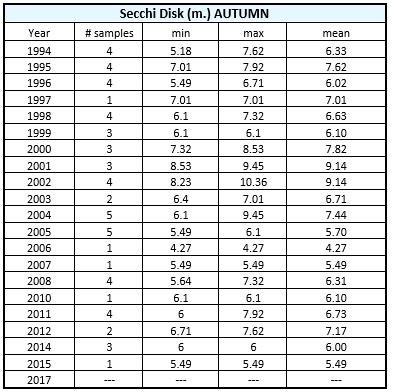
39 Secchi Disk (m.) SPRING/SUMMER Secchi Disk (m.) AUTUMN Calcium (mg/l) SPRING/SUMMER *No Autumn Calcium data has been collected for Mickey Lake. 38
40 Ruth Lake Total Phosphorus (µg/l) SPRING/SUMMER Surface Bottom Surface Bottom Surface Bottom Surface Bottom Total Phosphorus (µg/l) AUTUMN Surface Bottom Surface Bottom Surface Bottom Surface Bottom Sediment Phosphorus (mg/kg) SPRING/SUMMER
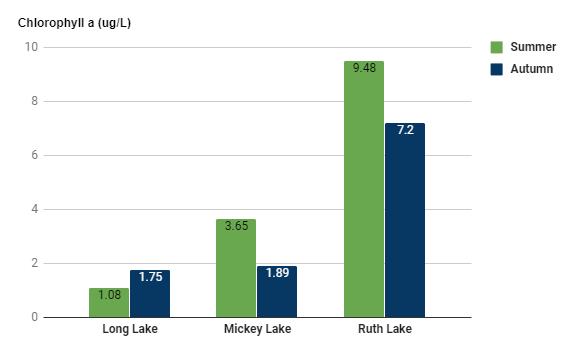
41 Chlorophyll a (µg/l) SPRING/SUMMER Chlorophyll a (µg/l) AUTUMN
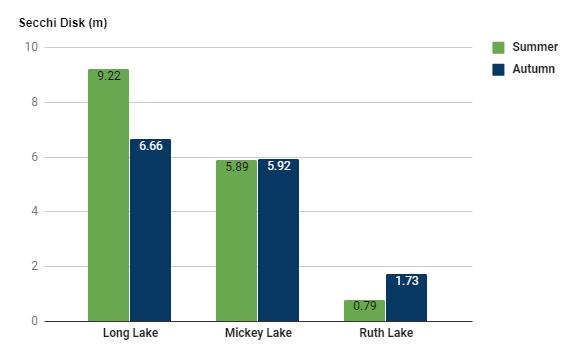
42 Secchi Disk (m.) SPRING/SUMMER Secchi Disk (m.) AUTUMN Calcium (mg/l) SPRING/SUMMER *No Autumn Calcium data has been collected for Ruth Lake. 41
43 Page Lake Total Phosphorus (µg/l) SPRING/SUMMER Surface Bottom Surface Bottom Surface Bottom Surface Bottom * No Autumn Total Phosphorus data has been collected for Page Lake Sediment Phosphorus (mg/kg) SPRING/SUMMER Nitrate-Nitrite Nitrogen (µg/l) SPRING/SUMMER Surface Bottom Surface Bottom Surface Bottom Surface Bottom < < < *No Autumn Nitrate-Nitrite Nitrogen data has been collected for Page Lake Chlorophyll a (µg/l) SPRING/SUMMER * Mean of two samples *No Autumn Chlorophyll a data has been collected for Page Lake. Secchi Disk (m.) SPRING/SUMMER *No Autumn Secchi Disk data has been collected for Page Lake. 42
44 Calcium (mg/l) SPRING/SUMMER *No Autumn Calcium data has been collected for Page Lake. 43
45 Fern Lake Total Phosphorus (µg/l) SPRING/SUMMER Surface Bottom Surface Bottom Surface Bottom Surface Bottom *No Autumn Total Phosphorus data has been collected for Fern Lake. Sediment Phosphorus (mg/kg) SPRING/SUMMER Nitrate-Nitrite Nitrogen (µg/l) SPRING/SUMMER Surface Bottom Surface Bottom Surface Bottom Surface Bottom <1.1 <1.1 < < *No Nitrate-Nitrite Nitrogen data has been collected for Fern Lake. Chlorophyll a (µg/l) SPRING/SUMMER * * Mean of two samples *No Chlorophyll a data has been collected for Fern Lake. Secchi Disk (m.) SPRING/SUMMER *No Secchi depth data has been collected for Fern Lake. 44
46 Calcium (mg/l) SPRING/SUMMER *No Autumn Calcium data has been collected for Fern Lake. 45
47 46
48 47
49 REFERENCES Chapra, S. C., 1997, Surface Water Quality Modeling, McGraw-Hill, New York. GLEC/GLWSI 2016 Long Lake Water Quality Assessment, 2016 Document GLEC 2014 Long Lake Water Quality Assessment, 2014 Document GLEC 2011 Long Lake Water Quality Assessment, 2011 Document GLEC 2008 Long Lake Water Quality Assessment, 2008 Document GLEC 2005 Long Lake Water Quality Assessment, 2005 Document Dr. Wallace E. Fusilier, Bene Fusilier, Water Quality Investigators, Long Lake Water Quality Studies, Document Long Lake Association, Long Lake Quality Management Plan with Appendix, 2008 Document Cooperative Lakes Monitoring Program, Ann Lake, Benzie County Data Report, 2016 Document 48