THE CHALLENGE ACTIONS?
|
|
|
- Douglas Franklin
- 5 years ago
- Views:
Transcription


1 THE CHALLENGE ACTIONS? EMISSIONS Edward Mazria FAIA / FRAIC Architecture 2030

2
3 billion metric tons 30 CO 2 Emitted Worldwide Source: Oak Ridge National laboratory; Graph New York Times

4 CO 2 (ppm) 400 CO 2 Atmospheric Concentration Source: NASA 410 ppm
5 CO 2 (ppm) Urban environments are responsible for 75% of all human-produced global greenhouse gas emissions. CITY New York City 71% Seoul 63% Pittsburgh 81% London 75% Washington DC 76% Mumbai 60% Beijing 53% Copenhagen 76% % emissions from buildings Source: UN Habitat, Paulson Inst., city data, etc. 2000
6 CO 2 (ppm) Global Building Energy Use (site energy use in Quads) IEA Building Energy Outlook to % INCREASE IN BUILDING SECTOR EMISSIONS SINCE
7 CO 2 (ppm) Global Building Energy Use by Fuel Type (source energy in Quads) EIA IEO % 3% RENEWABLES (solar, wind) 15% HYDRO (+ other) 8% NUCLEAR % FOSSIL FUELS (oil, gas, coal)


8 Peak CO 2 emissions by 2020, and reach ZERO emissions by 2050 December 12, 2015
9
10 By 2060, world population is expected to increase by about 2.67 billion people Source: World Bank
11 By 2060, world urban population is expected to increase by about 2.75 billion people absorbing the entire population growth estimate. Source: UN Population Division

12 Or, every week about 1.5 million people are being added to cities worldwide. Source: UN Population Division
13 Today, global building floor area is about 223 billion m 2 Source: Global Status Report, GABC
14 By 2060, global building floor area will increase by 230 billion m 2 or double the current worldwide building stock. About 40%, or 92 billion m 2, will be built in the next 15 years an area greater than all the buildings in the Western Hemisphere and the 28 countries of the European Union combined. Source: Global Status Report, GABC


15 X X EFFORT SCALE 2030 ACT IMPACT SCALE NOW! 2030
16 OPERATIONS
17 Millions of kwh Millions of Therms 5, ,000 Electricity 120 3,000 2,000 Natural Gas California: Record warm years 80 1, SAN FRANCISCO COUNTY ELECTRICITY AND NATURAL GAS CONSUMPTION (Commercial/Institutional Buildings) Source: California Energy Commission
18 Millions of kwh Millions of Therms 2,000 Natural Gas 200 1, , Electricity California: Record warm years SAN FRANCISCO COUNTY ELECTRICITY AND NATURAL GAS CONSUMPTION (Residential Buildings) Source: California Energy Commission
19 Millions of kwh Millions of Therms 90,000 4,000 80,000 Natural Gas 3,500 70,000 3,000 60,000 Electricity 2,500 50,000 2,000 40,000 1, LOS ANGELES COUNTY ENERGY CONSUMPTION (Buildings) Source: California Energy Commission
20 Millions of kwh Millions of Therms 350, ,000 ELECTRICITY 18,000 16, ,000 14, , , , NATURAL GAS CALIFORNIA ENERGY CONSUMPTION (Buildings) Source: California Energy Commission California: Record warm years 12,000 10,000 8,000
21 Trillion Btu Commercial Residential NEW YORK STATE ENERGY CONSUMPTION (Residential and Commercial Buildings) Source: Energy Information Administration
22 Trillion Btu Residential Commercial COLORADO ENERGY CONSUMPTION (Residential and Commercial Buildings) Source: Energy Information Administration
23 Trillion Btu Residential Commercial PENNSYLVANIA ENERGY CONSUMPTION (Residential and Commercial Buildings) Source: Energy Information Administration
24 Trillion Btu Residential Commercial ILLINOIS ENERGY CONSUMPTION (Residential and Commercial Buildings) Source: Energy Information Administration
25 Challenge 2005 QBtu Quadrillion Btu U.S. Building Operations Energy Consumption Source: Architecture 2030, U.S. Energy Information Administration, Annual Energy Outlook
26 Petajoules (Trillion Btu) 1,550 (1,469) 1,350 (1,279) Residential 1,150 (1,090) 950 (900) Commercial 750 (710) CANADA Building Energy Consumption Source: Natural Resources Canada
27 Mtoe (Qbtu) 350 (13.9) 300 (11.9) Residential 250 (9.9) 200 (7.9) 150 (5.9) Commercial EUROPE: 2014 warmest year on record 100 (4.0) EU 28 FINAL ENERGY CONSUMPTION (Buildings) Source: European Commission, Energy Consumption and Efficiency Trends in the EU 28
28 Energy Consumption (Mtce) Public /Commercial Residential Rural Urban Residential Northern Urban Heating CHINA BUILDING ENERGY CONSUMPTION ( ) Source: Building Energy Research Center Tsinghua University
29 Energy Consumption (Mtoe) INDIA BUILDING ENERGY CONSUMPTION ( ) Source: TERI Energy and Environment and Overview 2014/2015
30
31 or codes Building Energy Codes Source: Architecture 2030, Adapted from IEA Tracking Clean Energy Progress 2017
32 BUILDING STOCK North America 38.1 or codes Latin America Caribbean 19.3 Western Europe 29.8 Africa 18.0 Eurasia 9.8 Middle East 8.0 India 15.8 China Southeast Asia Japan Korea 9.8 Australia New Zealand 2.1 Existing Building Floor Area (2015, Billion m 2 ) Source: Architecture 2030; Global ABC, Global Status Report 2016
33 BUILDING GROWTH Eurasia 3.3 North America 9.0 or codes Latin America Caribbean 9.8 Western Europe 4.5 Middle East 4.7 Africa 12.4 India China Southeast Asia 8.2 Japan Korea 1.1 Australia New Zealand 1.1 Building Floor Area Growth 2016 to 2030 (Billion m 2 ) Source: Architecture 2030; Global ABC, Global Status Report 2016
34 BUILDING GROWTH Eurasia 1.8 North America 9.8 or codes Latin America Caribbean 14.0 Western Europe 2.6 Middle East 5.6 Africa 25.6 India 25.5 Southeast China Asia Japan Korea 0.2 Australia New Zealand 0.7 Building Floor Area Growth 2030 to 2050 (Billion m 2 ) Source: Architecture 2030; Global ABC, Global Status Report 2016
35 OPERATIONS S Worldwide zero-net-carbon building energy codes for commercial, institutional, and mid- to high-rise residential buildings and major renovations
36 S Efficiency + OPERATIONS On-site and/or Off-site Renewable Energy
37 S Nearly Zero Energy + On-site/Offsite Renewables Efficiency + OPERATIONS On-site and/or Off-site Renewable Energy 59 International and Chinese Firms Sign Historic Accord to Tackle Climate Change
38 DIRECTIVE 2010/31/EU Nearly Zero Energy + On-site/Offsite Renewables New public buildings NZEB Dec All new buildings NZEB by Dec. 31, 2020 NZEB (Nearly Zero Energy Building) Very high energy performance building with energy produced by renewable sources on-site or nearby. 59 International and Chinese Firms Sign Historic Accord to Tackle Climate Change

")

39 DIRECTIVE 2010/31/EU New public buildings NZEB Dec All new buildings NZEB by Dec. 31, 2020 NZEB (Nearly Zero Energy Building) Very high energy performance building with energy produced by renewable sources on-site or nearby. U.S. & International ZERO Code Standards
40 IGCC; California Energy Code 2019

 Performance Path Modeled energy performance meets or exceeds the minimum")
41 COMcheck Prescriptive PNNL Req. Trade-Off Option Prescriptive Path Requirements for minimum building energy efficiency BUILDING ENVELOPE HVAC LIGHTING MEETING THE CODE ASHRAE (minimum) Performance Path Modeled energy performance meets or exceeds the minimum building energy efficiency requirements Base building MODELING DOE - 2 EnergyPlus OTHER EQUIPMENT
42 Meeting the Prescriptive Path Requirements for minimum building energy efficiency Calculator BUILDING ENVELOPE HVAC LIGHTING OTHER EQUIPMENT ASHRAE (minimum) Estimated Energy Consumption Performance Path Modeled energy performance meets or exceeds the minimum building energy efficiency requirements Creates a predictable and reliable market for renewable energy. On-site and/or Off-site Renewable Energy Required
43 Development supported by the California Governor s Office and California Energy Commission

44 announces strong support for the S AIA has over 90,000 members and 127 Components throughout the U.S. and abroad. Development supported by the California Governor s Office and California Energy Commission
45 POLICIES & REGULATIONS Thousands pledges, incentives, financing plans, programs Annual energy Efficiency upgrade upgrades rate (efficiency, renewables, electrification): of 0.5% - 1% of the existing building stock annually 1.5% - 2% developing countries 2% - 3% developed countries
46 Policies for Existing Buildings
 produce 45%")
47 Seattle, WA 2.8% of Seattle buildings (> 20k sf) produce 45% of building sector GHG emissions
 produce 48% of building sector GHG")
48 Bronx Manhattan Queens Brooklyn New York City Staten Island 2.7% of NYC s buildings (> 50k sf) produce 48% of building sector GHG emissions


49 Los Angeles

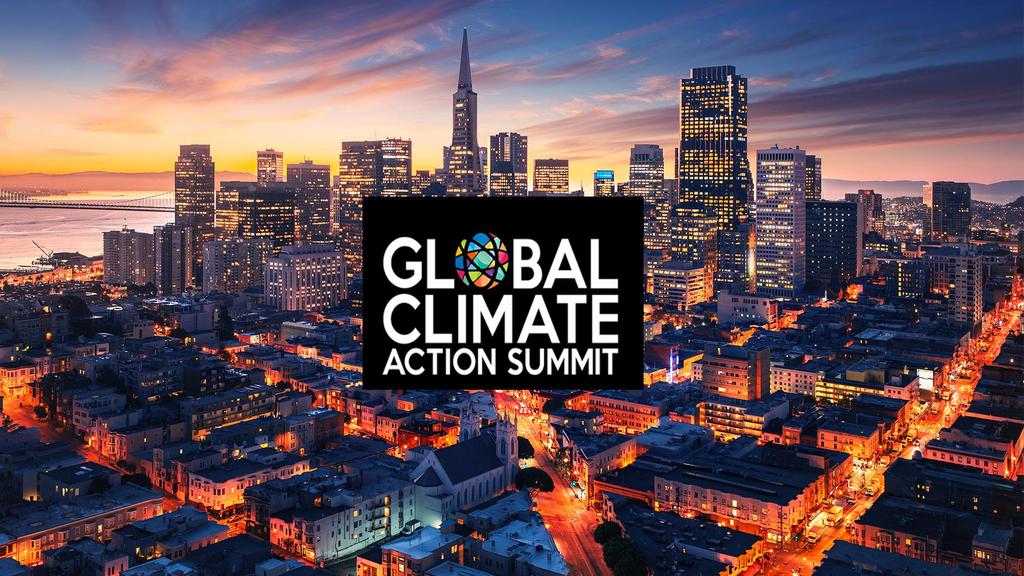
50 San Francisco, CA

51 Boston, MA
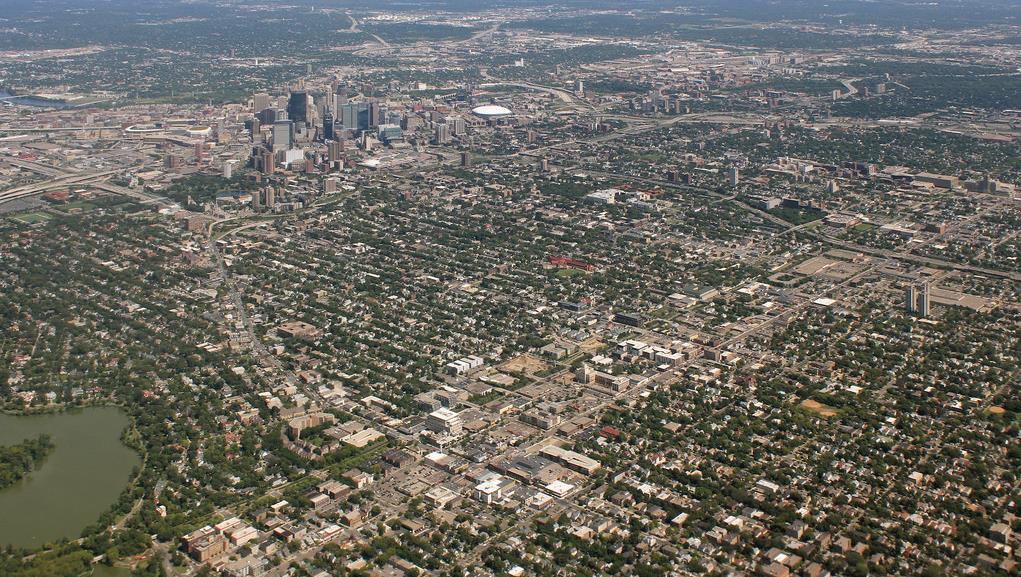
52 Minneapolis, MN

53 Phoenix, AZ
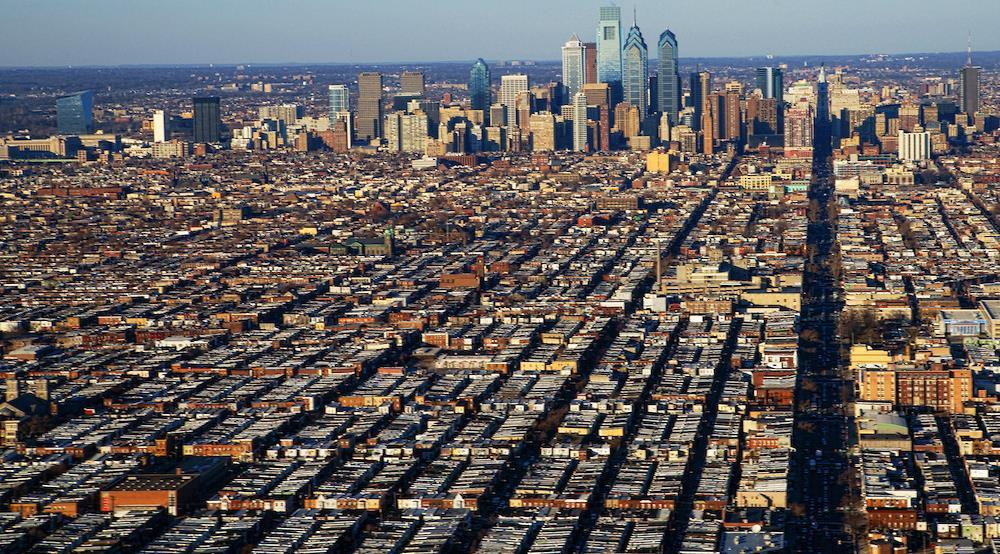
54 Philadelphia, PA

55 Vancouver, BC

56 Chicago, IL
57 Existing Buildings Policies Building energy efficiency improvements cost about 75% less when undertaken during a capital improvement cycle.
58 Existing Buildings Policies Big Buildings Policy Require energy upgrade by 2030 (efficiency, renewables, and/or electrification) Require zero emissions by 2050 Small Buildings Policy Integrate a energy upgrade at building intervention points: seismic or flooding resilience upgrade zoning or use change (within 2 years) point-of-sale (within 2 years) Provide incentives (ZNC & early adopters) fast track permitting low interest loans tax abatements rebates
59 OPERATIONS
 Source: Architecture 2030, Adapted from EIA AEO 2017 and Global ABC, Global Status Report")
60 EMBODIED CARBON OPERATIONAL CARBON MMmt CO YEAR TOTAL EMISSIONS OF GLOBAL NEW CONSTRUCTION 2020 to 2050 (business as usual) Source: Architecture 2030, Adapted from EIA AEO 2017 and Global ABC, Global Status Report 2017
61 140, , ,000 MMmt CO 2 80,000 60,000 48% 52% 40,000 20,000 0 EMBODIED CARBON OPERATIONAL CARBON TOTAL EMISSIONS OF GLOBAL NEW CONSTRUCTION (business as usual) Source: Architecture 2030, Adapted from EIA AEO 2017 and Global ABC, Global Status Report 2017


62 Prescriptive Path Concrete Steel Wood Glass Etc. Material Standards & Specificatio Attribute-Based Embodied Carbon Performance Path Embodied Carbon Modeling Software Attribute-Based Embodied Carbon Life Cycle Assessments Environmental Product Declarations
63 CONCRETE STEEL WOOD INSULATIO


64 EC3 by Skanska, coming in 2019 Partners CLF and C Change Labs Supporter Microsoft CONCRETE STEEL WOOD INSULATIO
65 S Zero-Net-Carbon building energy codes adopted and enforced worldwide by 2020 POLICIES & REGULATIONS at building intervention points. Zero-Net-Carbon by 2050 SPECIFICATIONS & STANDARDS CARBON CALCULATOR
66


67