How much sediment is too much, according to stream macroinvertebrates?
|
|
|
- Jack Little
- 5 years ago
- Views:
Transcription


1 How much sediment is too much, according to stream macroinvertebrates? Valerie Brady & Larissa Herrera* Natural Resources Research Institute University of Minnesota Duluth *Water Resources Science master s graduate and GZA GeoEnvironmental, Inc.

2 Sediment North shore steams have known turbidity issues Land use history: Completely logged 150 years ago Drainage ditches and roads built Only partially reforested Steep slopes and erodible clay loam soils


3 Why use macroinvertebrates? Relatively limited mobility 1-2 year life cycles High taxonomic diversity Food web intermediates Vulnerable traits and needs

4 Research Can we see effects on macroinvertebrates caused by sediment? At what sediment amounts do impacts become detectable?

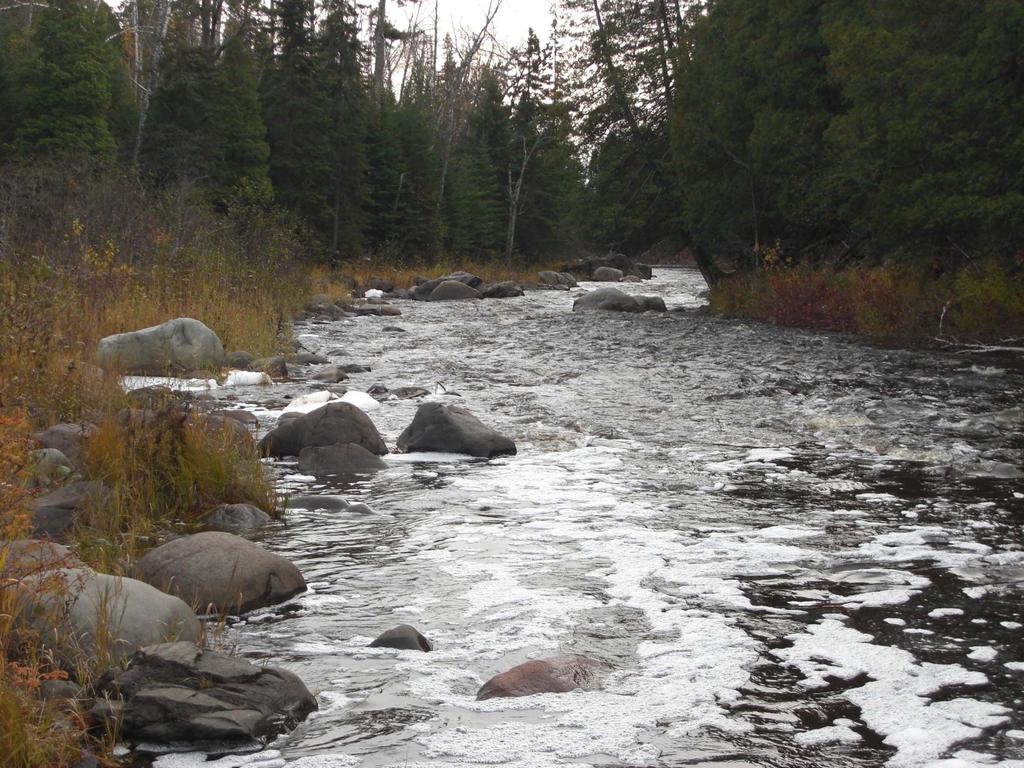
5 Study Sites

6 Methods Summary Substrate, sediment, water quality, and flow data collected during summer Macroinvertebrates and stream habitat sampled at end of summer Samples collected along a permanent cross-sectional transect, with a focus on riffles

7 Methods-Sediment Mid to lower riffle Quadrat (embeddedness) 4-5 across stream Estimated percentages of different particle size classes Estimate % embeddedness Depth of fines


8 Methods-Macroinvertebrates Upper riffle Quantitative samples Sampling device dependent on stream characteristics Shallow streams Boulder/cobble dominant Low flow
9 More current = less fines Data from R. Lindsey Scatterplot of PFines vs Ave velocity (Amity Creek) Percent fine PFines sediment Ave velocity 0.5 Current velocity
10 Amity Creek: % fines and the last 2 inch rainfall Data from R. Lindsey 30 P=0.001 percent fine sediments Days since last 2' rain
11 Embeddedness Sensitive taxa (black) appear to decrease at approximately 15% embeddedness while tolerant (grey) appear to increase at approximately 15% embeddedness Community threshold in 10 to 20 % embeddedness range Credit for graph: Dr. K. Kovalenko
12 Percent Embeddedness N = North shore S = South shore N SS NSNN S NNNSN N S SSN S NNNNNNNNNNNNNNNNNNNNNNNNNNNNNNNNNNNNNNNNNNNNNNNN NNN SN SS S SS N S S
13 Combined Stress Index Arcsin sq rt of % embedded Transformed: % Embedded % Total Fines Depth of Fines Sediment Stress Index
14 Combined Sediment Index Sensitive taxa (black) appear to have a threshold response between 0.5 and 1.0 Credit for graph: Dr. K. Kovalenko
15 Combined Sediment Index N = North shore S = South shore N NNNNSSNNN NS N S SN SS N N NNNNNNNNNNNNNNNNNNNNNNNNNNNNNNSNNNNNN N NS NN N S NNNN NNN S S SS NS S
16 Sand Narrow quantile intervals, consistent change points indicate strong response to low levels of sand Credit for graph: Dr. K. Kovalenko
17 Percent sand N = North shore S = South shore SSS NNN NNNSNNNNNNNSNNS N NNN N S S S NN NNNNNNNNNNNNNNNNNNNNNNNNNNNNNNNSNNNNNNN N N S NS SS S
18 Discharge-Knife River 600 Knife River Discharge Knife River Discharge Discharge (cfs) Discharge (cfs) /13 5/2 6/21 8/10 9/29 11/18 Date (2010) 0 3/28 5/17 7/6 8/25 10/14 12/3 Date (2009)
19 Conclusions Macroinvertebrate assemblages change at about 15-20% embeddedness, or < 5% of stream substrate dominated by sand. Many N shore stream sites are below these amounts. Invertebrates may be adapted to sediments moving through. Caveats Based on data collected over 20 yrs Can t prove cause and effect Tracking exposure to sediment is timeconsuming & expensive


20 Sponsors This project was funded in part under the Coastal Zone Management Act, by NOAA s Office of Ocean and Coastal Resource Management, in cooperation with Minnesota s Lake Superior Coastal Program.


21 Acknowledgements LH committee: Dr. Karen Gran, Dr. Ronald Regal, Dr. Yang Li Dr. Thomas Nalepa, NOAA GLERL, fellowship mentor Dr. Katya Kovalenko, NRRI, statistical assistance NRRI field and lab assistance: Robert Hell, Noah Kroening, Keely Axler, Cory Peterson, Dan Breneman Paul Meysembourg, NRRI, GIS assistance Historical dataset collection sponsored by:
22


23 Study Sites 22 sites 19 separate streams Non-urban Non-agricultural 2 nd to 4 th order Watershed >1000 ha Reasonably accessible Several have previous data indicating low or high sediments
24 Land Use Delineated watersheds above sample points Dominated by wetland and forest No urban land or gravel pits Lack of development observed in field Dirt roads used to access sites and very few houses/businesses

25 Discussion: Gills Negative Response Had a negative response to at least one of the four sediment stressor variables External gill richness Filamentous gill richness Of the sensitive TITAN taxa, 14 had filamentous gills while only 4 had lamellae gills Positive response Had a positive response to at least one of the four sediment stressor variables Proportion operculate gills Operculate gills relatively uncommon Lamellar gill richness Gills subject to physical damage by abrasion and subject to clogging Various gills may have different levels of fragility
26 Discussion: EPT Mayflies, stoneflies, and caddisflies (EPT) taxa are known sensitive taxa for a variety of stressors In this study, EPT richness was significantly negatively correlated with increasing depth of fines, embeddedness, and combined sediment Proportional abundance of EPT was not significantly correlated with any of the sediment stressor variables indicating a decrease in species richness under increasing sediment conditions but potentially an increase in tolerant EPT species TITAN: 34 EPT were sensitive and 14 were tolerant
27 Discussion: EPT Biggest question What specific characteristics are driving the response of the EPT taxa EPT have been identified in numerous studies as sensitive to sediment Gill type may be a driving factor in vulnerability to excess fine sediment Predation was also significant correlation and many EPT are predators Refine characteristics Separate out EPT taxa in predator or other behavioral groups Look at genera within families with different gill types Macroinvertebrate data is already collected by many watersheds and agencies Teasing out specific characteristics could provide more information without additional sampling cost


28 Chosen Metrics 1. Proportion Coleoptera 2. Proportion Acari umn.edu/vsmivp/c oleoptera/coleopte ralarvae/elmidae/ 2/09/Corydalidae_big.jpg 3. Proportion Predator 4. Predator Richness 5. Filamentous Gill Richness

29 Chosen Metrics 6. Sprawler Richness 7. Plecoptera Richness 8. Ephemeroptera Richness 9. EPT Richness dex.asp?p= /09/Ephemeridae_big.jpg 10. Taxa Richness 012/09/Helicopsychidae_big.jpg