Water Loss Control for Military Installations
|
|
|
- Juliana Bishop
- 5 years ago
- Views:
Transcription


1 Water Loss Control for Military Installations Richard J. Scholze US Army ERDC-CERL, Champaign, IL Environment, Energy & Sustainability Symposium, New Orleans, LA 12 May US Army Corps of Engineers
2 Report Documentation Page Form Approved OMB No Public reporting burden for the collection of information is estimated to average 1 hour per response, including the time for reviewing instructions, searching existing data sources, gathering and maintaining the data needed, and completing and reviewing the collection of information. Send comments regarding this burden estimate or any other aspect of this collection of information, including suggestions for reducing this burden, to Washington Headquarters Services, Directorate for Information Operations and Reports, 1215 Jefferson Davis Highway, Suite 1204, Arlington VA Respondents should be aware that notwithstanding any other provision of law, no person shall be subject to a penalty for failing to comply with a collection of information if it does not display a currently valid OMB control number. 1. REPORT DATE 12 MAY REPORT TYPE 3. DATES COVERED to TITLE AND SUBTITLE Water Loss Control for Military Installations 5a. CONTRACT NUMBER 5b. GRANT NUMBER 5c. PROGRAM ELEMENT NUMBER 6. AUTHOR(S) 5d. PROJECT NUMBER 5e. TASK NUMBER 5f. WORK UNIT NUMBER 7. PERFORMING ORGANIZATION NAME(S) AND ADDRESS(ES) Army Engineer Research and Development Center,Construction Engineering Research Laboratory,PO Box 9005,Champaign,IL, PERFORMING ORGANIZATION REPORT NUMBER 9. SPONSORING/MONITORING AGENCY NAME(S) AND ADDRESS(ES) 10. SPONSOR/MONITOR S ACRONYM(S) 12. DISTRIBUTION/AVAILABILITY STATEMENT Approved for public release; distribution unlimited 11. SPONSOR/MONITOR S REPORT NUMBER(S) 13. SUPPLEMENTARY NOTES Presented at the NDIA Environment, Energy Security & Sustainability (E2S2) Symposium & Exhibition held 9-12 May 2011 in New Orleans, LA. 14. ABSTRACT 15. SUBJECT TERMS 16. SECURITY CLASSIFICATION OF: 17. LIMITATION OF ABSTRACT a. REPORT unclassified b. ABSTRACT unclassified c. THIS PAGE unclassified Same as Report (SAR) 18. NUMBER OF PAGES 40 19a. NAME OF RESPONSIBLE PERSON Standard Form 298 (Rev. 8-98) Prescribed by ANSI Std Z39-18


3 BUILDING STRONG


4 BUILDING STRONG

5 Water - Historically, Low Rates Background Department of the Army installations used over 41 billion gallons of potable water at a cost of $67.4M in FY10. By 2013, 36 states will face shortages ASCE Scorecard for Infrastructure Drinking Water D- North America 12.3 percent non-revenue water Leaks 7 billion gallons per day in U.S. Costs, value increasing Military costs much cheaper than private sector Shortages Competition for water Drivers Executive Order requires reductions in water use Incorporate water efficiency/conservation measures In U.S. leakage management is mainly reactive, based on visuals and water loss analysis No regulatory pressure Drought, limited resource response to political, economic and environmental concerns Preventive maintenance Water systems underground, out of sight, out of mind

6 True Cost of Water Applicability to consumers leak considerations Water itself Wastewater disposal Energy for heating, pumping, treating Pretreatment for some wastewater
7 Leak Detection Extremely Cost-effective, Payback Usually Few Months Why? Early Leak Detection Can Save Money Prevent Loss of Potable Water Help Prevent Major Breakages Useful to Minimize Expenses
8 Financial Incentives Less water used = less energy required to pump, treat and distribute Less chemicals required Production of less wastewater Leaks can create voids, sinkholes Often leaking water goes into sewers, lowering capacity Extended life of pumping and treatment facilities Improved operational efficiency Less disruption for highways and businesses, residents Lowered water system operational costs Reduced potential for contamination Reduced potential property damage and water system liability Reduced water outage events USEPA Reduce the 650 main breaks every day by 0.5%, save 270 million gallons of water a day!
9 Water Loss Water is lost through LEAKS and BREAKS Leaks - result from loose joints or service connections Breaks occur when a water main fractures Different types service line, valves, but largest source of NRW is leaks in supply lines Leak cause factors: Material, composition, age, joining methods, quality of initial installation External factors: stray electric current, contact with other structures, stress from traffic vibrations, frost loads and freezing Underground leaks: rusting, stray current, heavy traffic, freeze thaw, transient high pressure events (valve opening and closing, pump operation)
10 Water Loss Non-revenue water Includes: public use, firefighting demands, unauthorized connections, etc. along with water physically lost from the distribution system Difference between water produced and metered use Water loss all water that is not identified as authorized metered use or authorized un-metered use Goal - 10 percent maximum
11 Signs of Underground Leaks Unusually wet spots, water pooling on surface Green, wet, or soft area surrounded by drier conditions Notable drop in water pressure/flow volume Sudden problem with supply quality (rust, dirt, air) Irrigated area no longer receives proper pressure Heaving or cracking of paved areas Sink holes or potholes Uneven floor grade or leaning of a structure Unexplained sudden increase in water use, consistently high water use, or unexplained climbing use
12 Why Do Proactive Leak Detection? Because a large proportion of leaks go unnoticed due to: Highly permeable ground conditions Proximity of sewers or other trenches Low flow volume
13 Water Loss and Leak Control Technologies Automatic meter reading advances in water meter technology can automatically record and report leakage within customer-owned plumbing by detecting a constant flow of water. Continuous acoustic monitoring of water mains via valves sensors that record sound vibrations overnight. Downloaded and analyzed by software for leaks. GIS analysis reviewing historical leak information by GIS mapping helps identify leak-prone areas in small diameter old pipes. Improved pressure control reducing and modulating water pressure in water systems lowers the amount leaking out of pipes and reduces stress. Large transmission main testing complex methods and insertion of sensors Leakage control zones subdivide systems into zones monitored by master meters that periodically measure water use. Main replacement program identify main break and other data to identify and replace aging mains.
14 Leak Detection Technologies Acoustic most widely used Acoustic with correlation Infrared thermography Detect leaks in pipelines and voids around them good for aircraft overflights, fast and instant feedback shows measurable temperature change Chemical (tracer gas) Ground penetrating radar adapted for leak detection, electromagnetic wave propagation, can do rapid reconaissance over long lines Combined acoustic logger and leak noise correlator Digital correlation Radio-frequency interferometer UHF radio waves transmit, reflect from leaking water In-line detection systems Sahara Smartball

15 In-line Leak Detection Pass hydrophone through the pipeline Very sensitive Smartball- free swimming foam ball contains core with instrumentation SmartBall Inspection Method Insertion, Travelling, and Removal
 (Audio & vid e ~o Q1utput)")
16 Sahara in Action Cable Drum Processing Unfit (With Chloros B~ath) (Audio & vid e ~o Q1utput) ~ ~
17 External Leak Detection Acoustic Directly locate leak Contact water main Hydrophone Correlators Based on velocity of sound as it travels most widely used Two hydrophones or sensors bracket leak Monitoring units Permanent installations over time connect to valves and water service lines Monitor acoustics Download to or transmit to base station or website


18 Use of Data Loggers ff.iiirnl ~


19 Results from loggers Input pipe information to pinpoint leak

20 BUILDING STRONG


21 &'1.1:.'. la.\(jj_\'f fyi/ij.'i:j._ IlrJII CJ m

22 Principle of Noise Correlation for Pinpointing Leaks

23 m


24 m.

25 BUILDING STRONG
26 What Should be Done Record review and analysis Pump records, energy costs, etc. Determine non-revenue water Update maps Test master meters, major consumer meters Inventory of defects Recommendations for future
27 Standard Water Audit Quantify water consumption and water production via measurement or estimate Undertake water balance calculation

28 BUILDING STRONG
29 Leak Detection Survey Distribution system Contact every hydrant Contact at least 50 percent of valves Contact every feet Contractor will usually do listening first, Then use correlation equipment for locating leaks
30 Special Consideration PVC Piping Sound at curb stops Sound every 50 feet Difficult, but can be done Consider impact when expanding system Requires special treatment by contractor
31 District Metering Areas Some countries water utilities subject to government regulation pro-active leak management Intensive use of District Metering Areas (DMAs) common in some other countries DMAs approx connections Catching on in U.S. Constant feedback, ability to monitor

32 Water System m.
33 1989 Installation Example 26 Leaks; 309,000 gpd total 227,000 gpd in maintenance area valves Hydrants - 59,000 gpd Leakage cost = $126,000/year Leaks; 344,000 gpd 25 Leaks in maint. Areas - 200,000 gpd 15 Leaks in hydrants - 138,000
34 Example Miles 242,000,000 gallons per year Source Number GPM % Total % Total GPM Main Services Valves Hydrants Total
35 Example 3 Leak Type Number Mgal Cost $0.90/kgal Main ,810 Hydrant ,120 Valve ,500 Service ,230
 cu/ft cu ft cu ft cu ft hr 1m3 Hour 1/2-Turn Minor from closed 27.01 36.86 9.85 73.68 $0.52 $0.15 2-Turns from Moderate closed 1.15 27.01 25.86 193.48 $0.52 $0.38 7.")
36 I I Example from Vancouver O{J@J~9 ~fl\'7 ~lid & ~~ [~ 1? Leak Hole 7.48 US GAL= $1m 3 Size 1-cu ft (GVRD Rate) HYDRANT volume- Start Stop Total us gals/per 35.3cu ft = 1 (Slide Gate) cu/ft cu ft cu ft cu ft hr 1m3 Hour 1/2-Turn Minor from closed $0.52 $ Turns from Moderate closed $0.52 $ us Leak Hole GAL= $1m3 Size 1-cu ft (GVRD ate) volume- Start Stop Total us gals/per 35.3cu ft = SERVICE cu/ft cu ft cu ft cu ft hr 1m3 1 Hour 1/4 inch cut through Minor copper $0.52 $0.96 1/2 inch cut through Moderate copper $0.52 $ hours days $3.48 $24.38 $9.14 $ hours days $22.98 $ $46.67 $ days $1, $3, days $8, $17, I 3/4 inch cut through r Major copper $0.52 $3.54 $84.85 $ $30, ff.iiirnl ~
37 Recommendations Conduct comprehensive LDS every 2 years; may vary Initiate valve exercising program Install meters at critical points Update maps Disconnect lines no longer in use
38 Benefits Reduction in O & M costs Deferment of new facilities construction/expansion Conservation of resources Continuity of utility services Improved distribution system control Improved work force productivity Up-to-date records Improved knowledge of water system Minimize future breaks


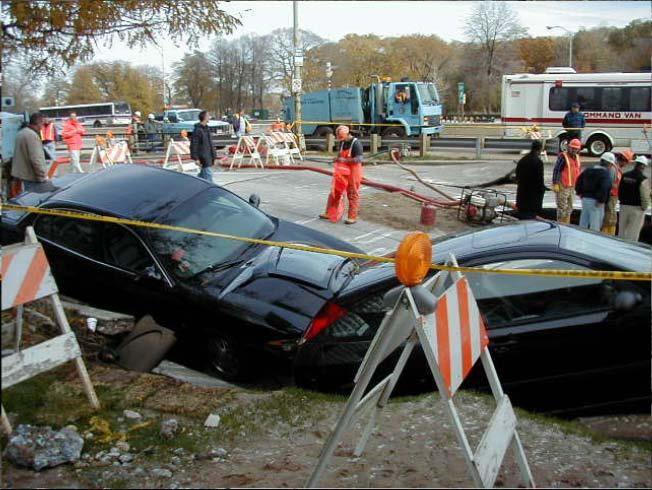
39 Leak Liabilities

40 Summary Leak detection saves Water Money Energy Payback- few mos. to year Variety of methods Other options also contribute to water loss control Pressure management DMAs AMI, AMR
41 Questions, Comments? Contact information or for additional information or resources