Accelerating Energy Efficiency in Texas
|
|
|
- Arlene Rosaline McCoy
- 5 years ago
- Views:
Transcription

1 Accelerating Energy Efficiency in Texas Southwest Partnership for Energy Efficiency As a Resource Houston, Texas August 5, 2014 Jim Lazar RAP Senior Advisor The Regulatory Assistance Project 50 State Street, Suite 3 Montpelier, VT Phone:
2 Brief History of Utility Energy Efficiency 1977: First programs (Washington, Oregon) 1980: Residential Conservation Service 1980: Northwest Power Act 1999: Texas % of peak demand 2006: Minnesota 1.5% per year 2006: California All Cost-effective 2007: Washington All Cost-Effective 2

3 The Texas EERS is Classified as a Goal 3
4 Texas EERS: % of Growth 20% reduction in annual growth in demand 2010 and 2011; 25% reduction in annual growth in demand 2012; 30% reduction in annual growth in demand 2013 and beyond 4
5 Texas was the FIRST state with an energy-efficiency mandate. BUT, Texas lags the leading states Narrow view of EE benefits applied Air quality requirements looming Billions of dollars of potential benefits 5

6 ACEEE November, 2013

7 ACEEE 11/2013
8 Average Residential Electric Bill $250 $200 $150 $100 $50 $0 New Mexico Maine Utah Colorado Montana Wyoming Rhode Island Illinois Idaho California Washington District of Columbia Minnesota Wisconsin Massachusetts Oregon Iowa Michigan Vermont South Dakota New Hampshire North Dakota Nebraska Arkansas Indiana Louisiana Ohio New York West Virginia Kansas Kentucky Pennsylvania U.S. Total Oklahoma Missouri New Jersey Nevada Alaska North Carolina Arizona Mississippi Georgia Tennessee Florida Virginia Connecticut Delaware Texas Maryland South Carolina Alabama Hawaii

9 Average Electric Bills: Texas vs. Top 6 States in EE Investment
10 Valuing EE Costs and Benefits PACT: Utility costs vs. utility savings; TRC: All costs vs. all quantifiable savings. RVF: Public Interest Perspective 10
11 PACT Cost of Saved Energy

12 Reserves 12
13 Vermont vs. USA Average Cost of Saved Energy
14 14

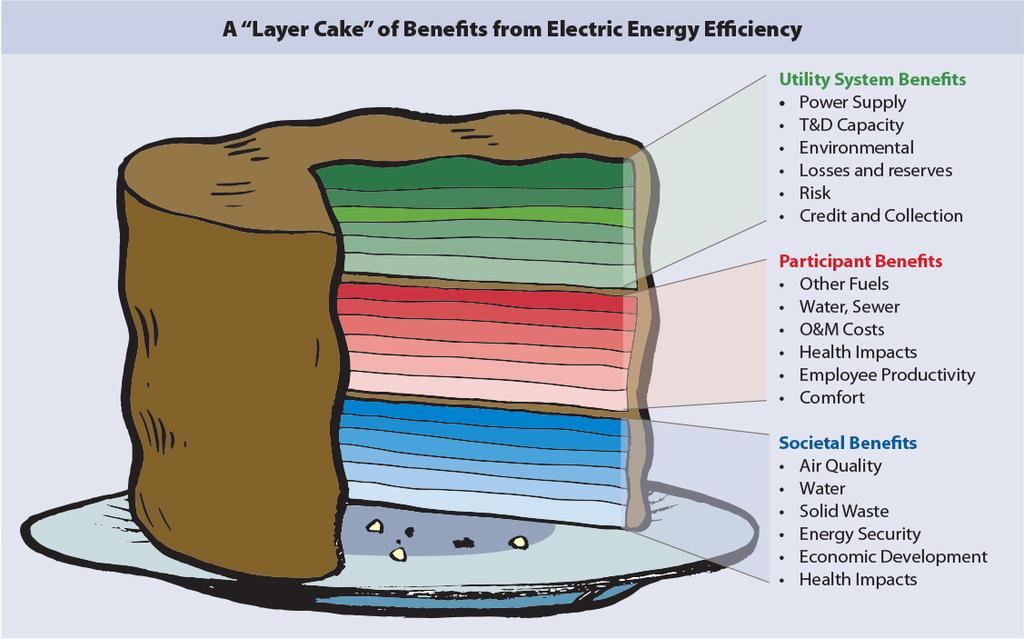
15 These are most commonly considered by utilities. Utility System Benefits BUT: - Most undervalue emission costs; - Many exclude or undervalue T&D benefits; - Most undervalue line losses and reserves; - Most exclude or undervalue risk benefits. 15

16 Peak Demand Soars on Hot Days 16


17 Targeting EE at Peak Loads 17

18 Utilities seldom consider nonelectricity participant benefits; these can be very significant. Participant Benefits - Affects consumer willingness to pay; - If ignored, many cost-effective measures may be omitted from utility programs. 18


19 Comfort is Hard to Quantify But Easy to Recognize 19
20 Societal Benefits 20


21 Anything that saves water OR electricity saves both water and electricity. Societal Benefits: Water 21

")
22 Societal Benefits: Air CSAPR (NOx) MATS (toxics) 111(d) (GHG) 22
23 23
24 The Third-Party Providers Have Been VERY Successful 2012 Program Savings As % of Sales 24
25 Annual Economic Benefits at Current Level of Effort $ x $1 million / year 25
26 Economic Savings Could Triple $ x $1 million / year 26

27 10-Year Cumulative Savings $ x 1 million over 10 Years 27
28 Challenges Texas is a light-regulation state; No third-party administrator; Throughput incentive continues; Impacts on generators, as market price impacts are achieved; BILLIONS of dollars of net economic benefits on the table. 28
29 About RAP The Regulatory Assistance Project (RAP) is a global, non-profit team of experts that focuses on the long-term economic and environmental sustainability of the power and natural gas sectors. RAP has deep expertise in regulatory and market policies that: Promote economic efficiency Protect the environment Ensure system reliability Allocate system benefits fairly among all consumers Learn more about RAP at Recognizing the Full Value of Energy Efficiency Available at: