3/25/2019. Urbanization of the Hydrologic Cycle. Codicil to Ben Franklin s Will Advances in Raingarden Design An Engineered Approach
|
|
|
- Bernard Gibson
- 5 years ago
- Views:
Transcription

Stormwater Management Guidance Manual 2 2 Codicil to Ben Franklin s Will -")


1 Advances in Raingarden Design An Engineered Approach With John Komlos Kristin Sample-Lord Virginia Smith Bridget Wadzuk AndreaWelker Moving to Resilient Stormwater Systems 1 Urbanization of the Hydrologic Cycle Philadelphia Water (PWD)Stormwater Management Guidance Manual 2 2 Codicil to Ben Franklin s Will And, having considered that the covering a ground plot with buildings and pavements, which carry off most of the rain and prevent its soaking into the Earth and renewing and purifying the Springs,whence the water of wells must gradually grow worse,and in time be unfit for use, as I find has happened in all oldcities 3 3 1


2 Villanova s Resilient Stormwaterge City Research and Demonstration Park Sponge City Green Stormwater Infrastructure Green City, Clean Waters Philadelphia WaterDept. To meet these goals requires a resilient engineered system, based upon the interactions of the soil, water, and vegetation, related to the climate, and supported through design, construction, maintenance, and monitoring. 5 5 Philadelphia Water Department Targets Key: 90% PWD GCCW = 1.5 Inches = 38 mm Image adapted from: Hoban and Wong, WSUD(2006) 6 6 2


3 China Sponge City Key: Image adapted from: Hoban and Wong, WSUD(2006) 90% PWD GCCW = 1.5 Inches = 38 mm 7 7 VUSP 8 The Evolution of Infiltration Recognized as the mechanism to remove stored volume Focus on surface storage and soil void space Infiltration rates consideredconstant Concerns over interference from back to back storms No expectations for extreme events From The Bioretention Manual, Prince George's County, Maryland 1990 s 9 9 3

 (<0.5 in) Medium (1.27-2.54 cm) (0.5 1.0 in) Large (>2.54 cm) (> 1.")
.")
4 Current Knowledge - Soil Physics Based Saturated HydraulicConductivity Vadose (unsaturated zone) Understanding of soil suction, and temperature effects Importance of Vegetation plant available moisture macropores Expectation for performance for extreme events Role of infiltration supported by science Infiltration Design Elements Soil Composition /Compaction Soil WaterMoisture Temperature UnderlyingSoil Climate patterns Footprint TIME! The Evolution of Infiltration Storm Size Small (<1.27 cm) (<0.5 in) Medium ( cm) ( in) Large (>2.54 cm) (> 1.0 in) Sample Size Average Volume Reduction % % % Source, L. Lord Thesis The Evolution of Evapotranspiration Recognized as important 11 Zaremba, G. J., Traver, R. G., & Wadzuk, B. M. (2016). Impact of drainage on greenroof evapotranspiration. Journal of Irrigation and Drainage Engineering, 142(7), Regional Evapotranspiration (ET) Sanford and Selnick (2013) 4
 68% 88% 74% 77% 75% 80% Zaremba, G. J., Traver, R. G., & Wadzuk, B. M. (2016).")

.")
5 Observed Data Villanova Green Roof Lysimeter Historical Rainfall (mm) ET (mm ) ~ ET (% rainfall) 68% 88% 74% 77% 75% 80% Zaremba, G. J., Traver, R. G., & Wadzuk, B. M. (2016). Impact of drainage on greenroof evapotranspiration. Journal of Irrigation and Drainage Engineering, 142(7), The Evolution of Evapotranspiration Recognized as a contributing part of a GI system s water balance Instrumental in GI functioning ofgi Removes stored water volume Restores soil storage capacity Observed ET for Bioinfiltration Maintains healthy plantlife Role of ET supported by science ET Design Elements Penman Monteith Hargraves Eq. MeteorologicalConditions Vegetation Soil WaterAvailability TIME! Hess, A. (2017). Rain Garden Evapotranspiration Accounting. Dissertation. Villanova University TreatmentTrain
 Journal of Hydrologic Engineering 0.0 Infiltration Trench Depth (m) 1.4 1.2 1.")

 Journal of Hydrologic Engineering 11/6/2018 18 18 Zoo Rain Gardens Design: 4.9 cm 1.")
6 Rainfall: 11cm VillanovaTreatmentTrain Superstorm Sandy Volume of runoff: 101 m 3 Total system capture: 98 to 100 m 3 Overflow: 1 to 3 m 3 Average rainfall intensity: cm/hr 1.6 Lewellyn, C., Lyons, C., Traver, R., Wadzuk,B. (2015) Journal of Hydrologic Engineering 0.0 Infiltration Trench Depth (m) PT Depth 1.3 m Rainfall Rainfall (cm) Elapsed 5T0ime (hrs) /6/ Villanova Treatment Train Large Event Performance 100% 90% Percentage of System Volume Capture 80% 70% 60% 50% 40% 30% 20% 10% Percentage of System Capture Volume (Vsys/Vrunoff) Expected % Volume Capture 0% Rainfall (cm) Lewellyn, C., Lyons, C., Traver, R., Wadzuk,B. (2015) Journal of Hydrologic Engineering 11/6/ Zoo Rain Gardens Design: 4.9 cm 1.9 in impervious StaticVolume 2 CaraAlbright
 top of stone infiltration trench (22.93 m) Lower RG Pond Stone Trench 0.2 0.4 0.6 0.8 1.0 1.2 Rainfall, cm 20 22.0 0 50 100 150 200 Elapsed Time, minutes 250 300 1.4 21 SRT Day 1-7.6 cm 3.")
 24.5 24.0 23.5 23.0 22.5 Meas Rain Synth Rain point of GI SCM overflow (23.8 m) el.")

7 25.0 Lower Rain Garden 2.5 cm 1.0 in ~ 90 Minute 0.0 Ponded Depth, m (from datum) Meas Rain el. of domed riser - transfer to stone bed storage (23.5 m) top of stone infiltration trench (22.93 m) Lower RG Pond Stone Trench Rainfall, cm Elapsed Time, minutes SRT Day cm 3.0 in Night cm in Day cm 2.0 in Upper RG Overflowed to Lower Lower RG Transfer pipe to rock bed extensively used. Did NOT overflow CaraAlbright Back to Back Extreme Event Ponded Depth, m (from datum) Meas Rain Synth Rain point of GI SCM overflow (23.8 m) el. of domed riser - transfer to stone bed storage (23.5 m) base of engineered soil (22.5 m) 22.0 Lower RG Bowl Stone Trench Time Elapsed, min Lessons Learned From a Decade of Research To meet these goals requires a resilient engineered system, based upon the interactions of the soil, water, and vegetation, related to the climate, and supported through design, construction, maintenance, and monitoring. Traver, R.G. & Ebrahimian, A. Front. Environ. Sci. Eng. (2017) 11:


8 Lesson # 1 Water flows downhill and doesn t turn left. 26 Lesson # 2 Understand your drainage area LiDAR / GIS Dr Smith 27 Lesson # 3 Build it RIGHT! 28 8


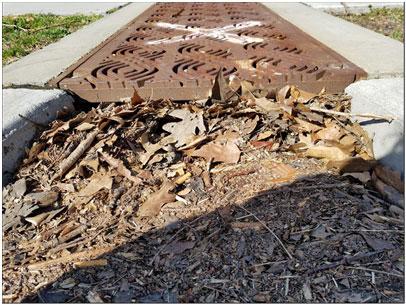


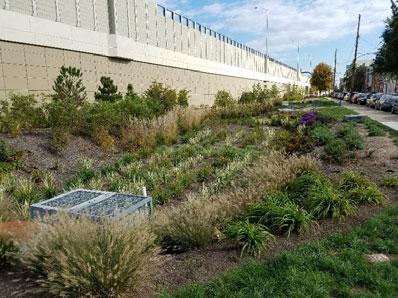
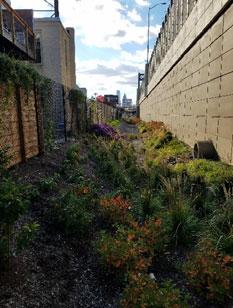
9 Lesson # 4 Vegetation is a Design Element Thanks to AllenDavis 29 Lesson # 5 - Deal with Trash and Leaves - Maintenance 30 Lesson # 6 Make it a CommunityAssett! A C D G 31 9


10 Lesson # 7 Monitoring Is Needed. 32 Acknowledgements PADEP Growing Greener / 319 Non Point Source USEPA Disclaimer: This presentation was developed under Assistance Agreement No awarded to Villanova University and has not been formally reviewed by EPA. The views expressed are solely those of Villanova University and do not necessarily reflect those ofthe Agency. VUSP Partners Dr. Cara Albright Dr. Amanda Hess Gerald Zaremba Conor Lewellyn Bureau of Clean Water Managed Release Concept 34 10


 undesirable (e.g.")

11 What is MRC? The MRC BMP has been created to provide a volume and water quality benefit for areas where infiltration is not feasible. It is designed to provide volume management and filtration through slow flow release from a restricted BMP underdrain Where can it be used? MRC is limited to project areas or subareas where infiltration: is extremely limited* not feasible (i.e., groundwater and/or regularly occurring seasonally high water tables within one foot of the bottom of the BMP s soil media) undesirable (e.g., sinkhole prone areas or contaminated soils) What does it look like? MRC can be incorporated within specific BMPs Ex: Bioretention, pervious pavements with storage bed, underground detention, and others if they meet MRC design standards

 IWS have been shown to")

 per acre of")
")
12 What does it look like? Placed so that it captures the runoff from a hour storm MRC BMP are highly recommended to have an internal water storage (IWS) IWS have been shown to provide improved water quality and ET benefits What are the main design parameters? Release rate should not exceed 0.01 cfs (rounded to the nearest hundredth) per acre of equivalent impervious area What are the main design parameters? IWS 1 foot deep (assume ½ available during storms for vegetated systems) Soil media depth of a facility (including the IWS) 4 feet and 2 feet


13 What are the main design parameters? Maximum ponding time: Defined as the time after end of storm event for stored surface water to recede to the soil surface Limited to 72 hours Maximum ponding depth: 2 feet (2 yr/24 hr) What are the main design parameters? Post construction 2 year/24 hour storm peak flow pre construction 1 year/24 hour storm level Max depth 2 feet 2 yr/24 hr post construction peak 1 yr/24 hr pre construction peak level 2 yr/24 hr post construction peak with MRC BMP What are the main design parameters? Bypass the 10, 50 and 100 year/24 hour storm events If you really really can t four feet maximum ponded depth


14 What are the main design parameters? MRC BMP provides water quality demonstration if it is a: Vegetated MRC BMP Porous pavement MRC BMP with adequate vacuum street sweeping maintenance regime Underground storage chamber pre / post treatment 85% of TSS + P IWS Primary N Design Example Rainfall NOAA 24 hour type C curve distribution NOAA 14 depths for Philadelphia 2.8, 3.4, 4.8, 6.8, 7.8 for 1, 2, 10, 50, 100 year/24 hour events Post construction: CN of 98: impervious surface Tc: 5 minutes Pre construction: CN of 74: meadow in good condition over HSG C soil Tc: 15 minutes Cumulative rainfall fraction Time (hours) Design Example Rain garden 30% soil media void space to mimic soil storage recovery through ET and infiltration Parameter Value BMP footprint area 0.07 ac Contributing area (all impervious) 0.8 ac Ponding depth 1.1 ft Media depth 2.5 ft IWS depth (included within soil media depth) 1 ft Infiltration rate 0.1 in/hr Void space 30%


15 Design Example Results 1-inch Runoff Event Maximum: 0.01 cfs No overflow Design Example Results 2-year/24-hour Storm Event