Rockland County s Water Resources -Selected Findings from the USGS Study- Paul M. Heisig, Hydrologist New York USGS Water Science Center Troy, NY
|
|
|
- Eileen Skinner
- 5 years ago
- Views:
Transcription


1 Rockland County s Water Resources -Selected Findings from the USGS Study- Paul M. Heisig, Hydrologist New York USGS Water Science Center Troy, NY
 Streamflow gage site Subject to Permits Lake")
2 Subject to Permits Water Sources Rockland County, NY -Lake DeForest Reservoir -Alluvial Aquifers Ramapo and Mahwah Valleys -Bedrock Aquifer Newark Basin Sedimentary rock -Letchworth Reservoirs (since 2006) Streamflow gage site Subject to Permits Lake DeForest
3 Industrial cooling water 5.6 percent Golf courses 3.1 percent Nurseries, orchards, farms 0.3 percent Summertime increase in residential, and commercial, industrial, governmental, and institutional use 18 percent 2005 Water Use Rockland County 12.9 Billion Gallons Commercial, industrial, governmental, and institutional 10.2 percent Residential 62.8 percent Water Use
4 Water-Resource Concerns in Rockland County (2004) Is Pumpage from the Bedrock Aquifer Sustainable? What are the shape and size of Wellfield Capture zones? How much Recharge does the Aquifer Receive? What are effects of: Impervious Surfaces Sanitary Sewering Additional Sources of Water?
5 Precipitation Evapotranspiration (ET) Recharge Storm Runoff Lake, Stream, or Wetland Aquifer Stream Baseflow (GW Discharge)
6 Precipitation Evapotranspiration (ET) Well Recharge Storm Runoff Aquifer Stream Baseflow (GW Discharge)
7 The Bedrock Aquifer 1. Physical Framework / Water-bearing properties 2. Hydrology use groundwater-level data and framework to delineate: Groundwater flow-system Production Well Capture Zones


8 Sedimentary Bedrock of the Newark Basin Aquifer West East
 Water-Bearing Fractures Regional GW Flow")
9 Fracture Surface (unsaturated) Recharge Surface of Water-Bearing Fracture (saturated) Water-Bearing Fractures Regional GW Flow Direction

10 Spring 2007 Ground Water Levels, Bedrock Framework, GW Divides, GW Flow

11 Production Well Capture Zones (250 ft below bedrock surface) From Numerical GW Flow Model Groundwater flow model results from R. Yager, USGS
12 Aspects of Aquifer Health Aquifer Responses to Groundwater Withdrawals Streamflow Recharge Natural Variability Effects of Impervious Surfaces Sanitary Sewering Water Loss from Aquifer
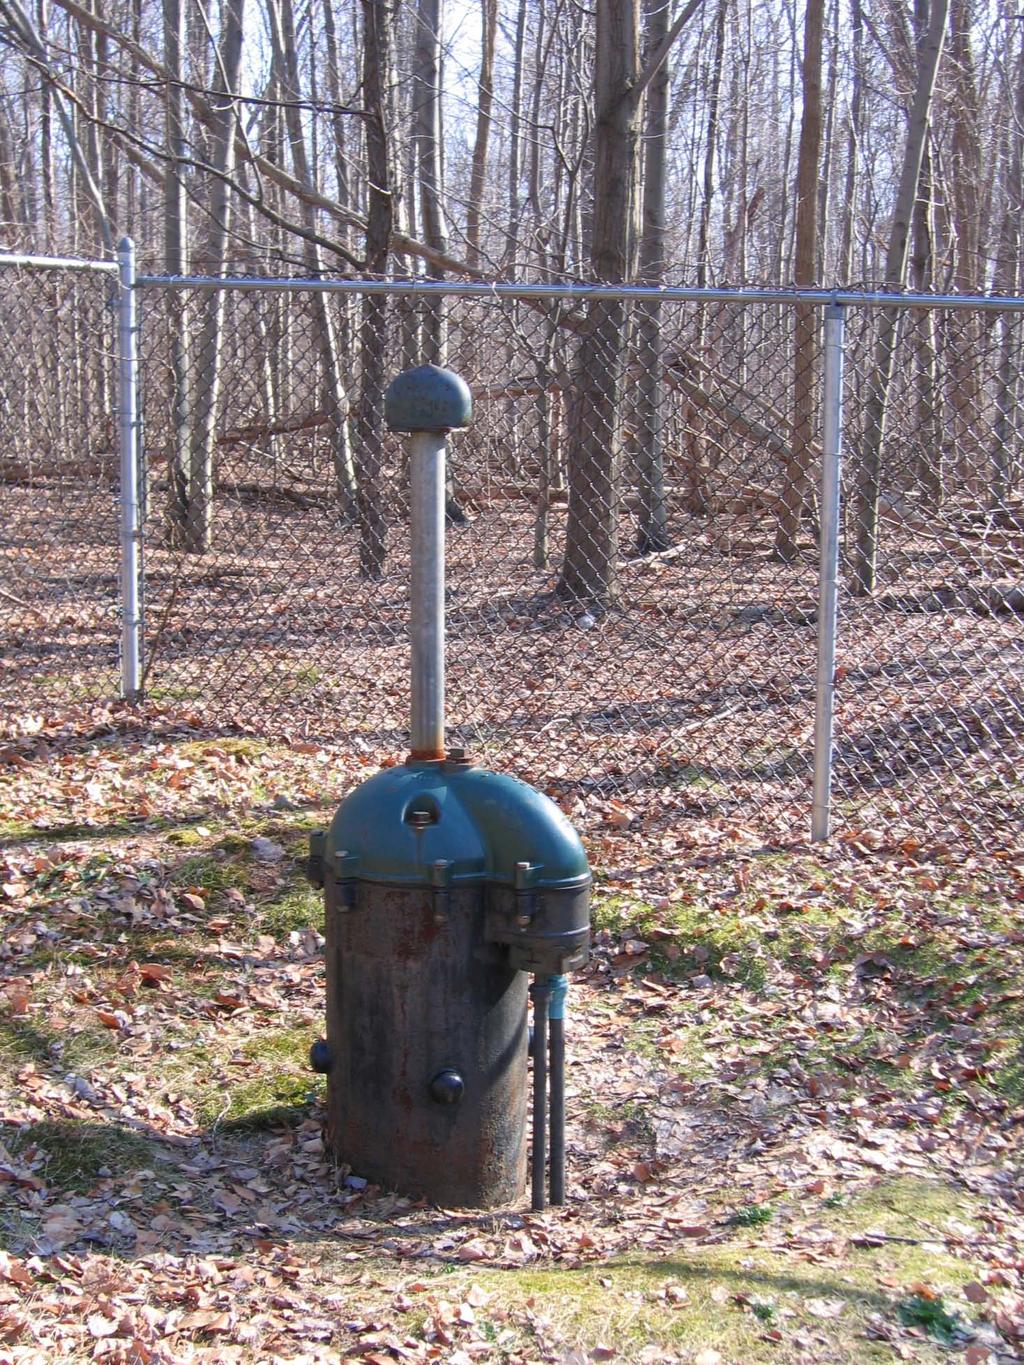
13 UWNY Well

14 Seasonality of Bedrock Aquifer Withdrawals Withdrawal Rate Jan Mar Jun Sep Dec 2005

15 Seasonal Groundwater-Level Changes Observation Well and Pumping Wellfield are 0.7 miles apart.


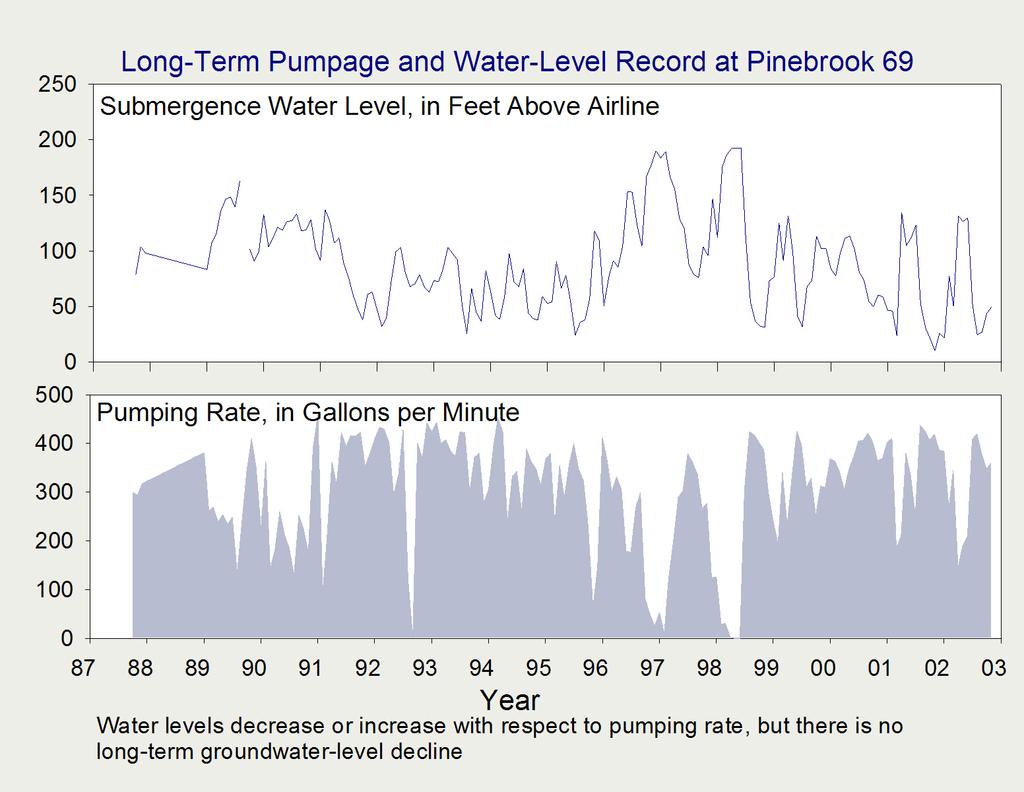
16 Example Annual Pumping Rate and Groundwater-Level Data from Production Well UWNY Well 69 Growing Season

17 If pumped continuously, about 1/3 of UWNY Supply wells would reach the bottom of airline prior to the end of the growing season. Most wells are not pumped continuously, so this is a worst-case assumption. However, it also assumes constant drawdown rates, which is a bestcase assumption: Drawdown rates can increase as water-bearing fractures become dewatered. Air entrainment may reduce pumping rates prior to water levels nearing the pump.

18 Areas of Dry Streams over the Aquifer, Sept (brown shaded areas)

19 Factors that Affect Recharge Totals: Precipitation Amount Overburden Thickness Wetland / Surface Water Area Impervious Surface Area 24.8 in. 58 in. 52 in. 48 in in.
20 How much of recharge to the bedrock aquifer is pumped out for water supply? (2006 data) Estimates from watersheds with streamflow gages: Mahwah River 12% Saddle River 24% Pascack Brook 21%

21 Impervious Surface Effects

22 Stormflow Hydrographs and Impervious Surfaces 17% Est. Annual incr. in Storm Runoff with % impervious surface: Pascack Br. ~400 Mgal. 12% Saddle R. ~150 Mgal. Mahwah R. ~ 20 Mgal. 3 % Effects --Loss of Recharge (less base flow), Streambed Erosion, Turbidity, and Temperature Fluctuations

23 Sanitary Sewer System Sewer Mains are a Subsurface Drainage Network, Much Like Streams Total Outflow to Hudson River was 14.1 Billion Gallons in 2005
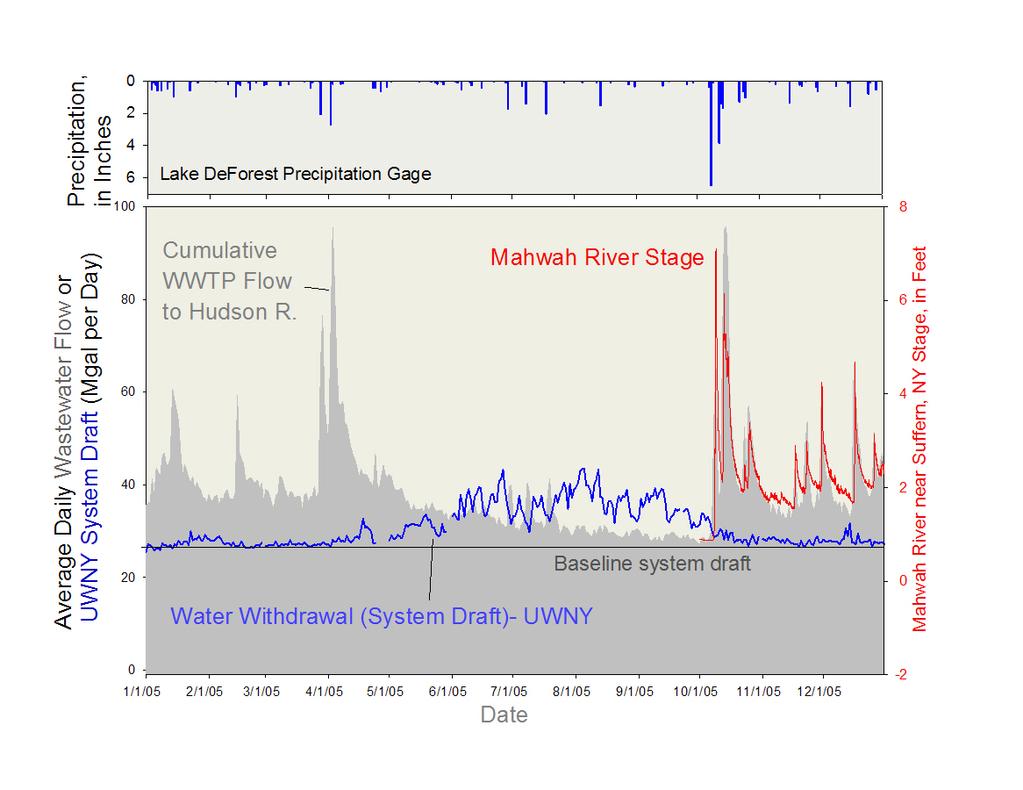
24 2005
25 Potential Sources of Water- Summer season sources Sedimentary Bedrock Aquifer Ambrey Pond Reservoir A purely hydrologic perspective Each with it s own set of issues and caveats Stormwater Retention / Use Stony Brook Watershed (Ramapo River) High volume, year-round sources Desalinization of Hudson River Water Indirect Use of Recycled Water (Example, with possible increased use of Lake Deforest)

26 Recycled water indirect re-use (hypothetical example) 3 4 Potentially more water available for Rockland water-use needs Augmentation of Flow in Hackensack R. 2 Discharge of Water to wetland area for additional biological treatment prior to joining Hackensack River 1 Higher Level of Treatment at WWTP and transfer water to Hackensack River Valley 14 Billion Gallons Lost to Hudson R. in 2005
27 Conclusions Long-term, progressive declines in groundwater levels across the aquifer are not indicated by available data or by computer modeling with historic pumpage data. Of Greatest Concern are Seasonal Groundwater- Level Declines at Supply Wells caused by increased Water Use During Prolonged Dry, Hot Spring and Summer Periods.
28 Summary and Conclusions (continued) Sustainability of Current Water Resources in Rockland County is Largely Dependent on: (1) the ability to curtail water-use during during summer peak-demand periods, and (2) to avoid loss of supply from groundwater contamination Recharge in Rockland County is Significantly Higher than Previous Estimates, but is Highly Variable in Space and Time.
29 Summary and Conclusions (continued) Impervious Surfaces Increase Storm Runoff in Pascack Br. by nearly 400 Mgal./yr and Probably Decrease Recharge by about 200 Mgal./yr. The Sanitary Sewer System behaves like a River - it transports wastewater, but also receives Stormwater Inflows and Infiltration of Groundwater. Potential Additional Water Sources: 1. Additional pumpage from Bedrock Aquifer 2. Ambrey Pond 3. Retention/Use of Stormwater 4. Augmentation of Ramapo River flow from the Stony Brook Watershed. 5. Desalinization of Hudson River Water 6. Indirect Reuse of Recycled Water
30 End