PEAK GOLD MINES MONTHLY ENVIRONMENTAL SUMMARIES APRIL 2012
|
|
|
- Samantha Madlyn Dixon
- 5 years ago
- Views:
Transcription
1 PEAK GOLD MINES MONTHLY ENVIRONMENTAL SUMMARIES APRIL 2012 Prepared By Peak Gold Mines Signature Sophie Thompson 8/05/2012 Distribution New Gold Internet Peak Gold Mines Intranet HSE Public Environmental Reports 1
2 Table of Contents INTENT:... 3 SCOPE:... 3 DEFINITIONS:... 3 MONITORING RESULTS:... 3 Vibration Monitoring Results:... 4 Air Quality Monitoring Results:... 5 Attended Noise Monitoring Results:... 5 Water Monitoring Results:... 7 Weather Data Results:
3 1. INTENT This monthly environmental summary report is a new requirement under section 66(6) of the Protection of the Environment Operations Act 1997 (POEO Act), in which holders of an environment protection licence make their pollution monitoring data publicly available. This report is intended to keep the community, stakeholders, and regulators informed of PGM s environmental performance and to maintain a transparent and accountable reporting system. 2. SCOPE This report covers all of PGMs environmental monitoring conditions covered for April These conditions, where applicable, are measured against PGM Environmental Protection Licence (EPL), development consent conditions and Australian Standard to determine PGMs compliance. The conditions include; Blasting monitoring results Air Quality Monitoring results; Noise Monitoring results; Surface Water Monitoring results; Groundwater Monitoring results; Weather Conditions. 3. DEFINITIONS PM 10 Particulate Matter less than 10 microns in diameter SWL Standing Water Level, the groundwater level measured from the top of the bore hole casing db (L) decibel (linear maximum) db LAeq(15 minute) Decibel (linear weighted average over 15 minutes) g/m 2.month grams per square meter per month CN Free Free Cyanide (hydrogen cyanide and cyanide ions in solution) CN WAD Weak Acid Dissociable Cyanide (includes cyanide species liberated at moderate ph of 4.5) TSS Total Suspended Solids 3
4 4. MONITORING RESULTS 4.1 Vibration Monitoring Results The vibration monitoring results displayed in Table 4.1(a) & 4.1(b) represents all of PGMs blasting events that incurred a vibration result at the New Occidental and Fort Bourke monitors. Appendix 1 contains a list of all blast that were detonated on PGM holdings for April 2012 and their corresponding vibration result. As seen in Table 4.1(a) and Table 4.1(b), all blasting events were below PGMs EPL limits. PGMs vibration limits set by the EPL can be viewed in Table 4.1(c). The compliance against the overall 12 month period will be reported in the EPL Annual Return and Annual Environmental Management Report. The PGM website contains the full monitoring dataset for EPL required monitoring locations. Table 4.1(a) New Occidental Vibration Result Location Sampled & Recieved Blast ID Development / Production Fort Bourke (mm/s) New Occidental (mm/s) Complies Peak 4/04/ StpMainS540 Production No Trigger 1.15 Y New Cobar 7/04/ StpMainN320 Production Y New Cobar 9/04/ StpMainN320 Production Y New Cobar 11/04/ StpMainN450 Production Y New Cobar 14/04/ StpMainN320 Production Y Table 4.1(b) PGMs EPL Limits for Vibration Peak Particle Velocity (mm/s) Allowable Exceedence % of the total number of blasts in a 12 month period NIL 4
5 4.2 Air Quality Monitoring Results Table 4.2 contains the air quality monitoring summaries for the month of April Dust Deposition Bottles are currently used to monitor PGMs air quality. The bottles are position in the field for a period of 30 ± 2 days. PGM monitors air quality every second month. The bottles are then sent to Australian Laboratory Services (ALS) for external analysis. PGM currently has no set limits for air quality monitoring levels. However, PGM takes on board the Australian Standard limit of 4 g/m 2 /time for best practice. If a monitoring record is over the Australian Standard of 4g/m 2 /time, PGM is not required to report the result to the EPA, however the result will be reported and addressed in PGMs AEMR. Monitoring was not conducted during April The PGM website contains the full monitoring dataset for EPL required monitoring locations. 4.3 Attended Noise Monitoring Results A hand held monitor is used by PGM employees to regularly monitor noise limits at times set out by the EPL and Development Consent Conditions. This enables the clear identification of the source of any recorded noise. Noise monitoring is regularly conducted at PGM closest resident and sporadically depending on operations. Table 4.4 below outlines PGM noise limits set by the EPL and Development Consent Conditions and Table 4.3 outlines the monitoring results. The PGM website contains the full monitoring dataset for EPL required monitoring locations. 5
6 Table 4.3 Attended Noise Monitoring Results Location Sampled Obtained Published Time Limit Noise Level (LAeq 15 ) Key Noise Source Complies Passing trucks (non-mine) Dellavale 12/04/ /04/ /06/ Mine vehicles on ROM pad Mine vehicle driving up decline Y Dellavale 20/04/ /04/ /06/ Birds Y Dellavale 26/4/ /04/ /06/ Birds Passing car (non-mine) Y Table 4.4 Attended Noise Monitoring Limits Time Band Day Noise Level (db) 8:00am 4:00pm Mon Fri 45 6:00pm 10:00pm Mon Fri 40 10:00pm 8:00am Mon Fri 35 8:00am 1:00pm Sat pm 8:00am Sat 35 12am 12pm Sun 35 6
7 4.4 Water Monitoring Results Surface water monitoring involves collecting water samples from a number of locations around site and analysing for physical and chemical parameters including ph and electrical conductivity. Table 4.5 demonstrates all physical and chemical parameters. The PGM website contains the full monitoring dataset for EPL required monitoring locations. Table 4.5 Surface Water Monitoring Results Monitoring Point Limit CN Total CN WAD CN Free Oil & Grease Sampled Received Published mg/l mg/l mg/l mg/l Complies RWD Feed 13/04/ /04/ /06/2012 N/A <10 Y RWD Feed 26/04/2012 8/05/ /06/2012 N/A <0.004 <0.004 Y 7
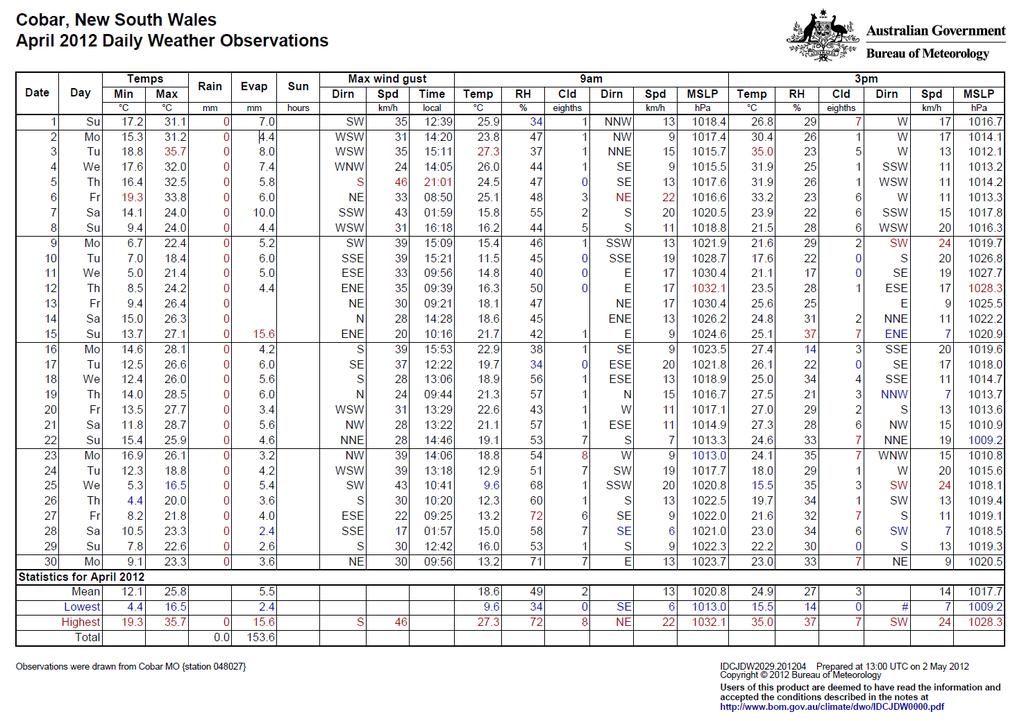
8 km/h C 4.5 Weather Data Results PGM meteorology monitoring data for April 2012 has been acquired through the Bureau of Meteorology (BOM) weather station located 2km North West of Cobar. PGM onsite weather station was undergoing maintenance and updating works throughout April Once the weather station returns to PGM, the metrological data will be obtained from site rather than the BOM weather station. The PGM website contains the full monitoring dataset for EPL required monitoring locations. The BOM can be used as an alternate source for this monitoring data Temperature April 2012 Temperature (min) Temperature (max) Temperature (ave) Windspeed April Windspeed (max) Windspeed (9am) Windspeed (3pm) 8
9 9