UPGRADING ethekwini S RURAL ACCESS ROAD NETWORK A MUNICIPAL PERSPECTIVE
|
|
|
- Arron Riley
- 5 years ago
- Views:
Transcription
1 UPGRADING ethekwini S RURAL ACCESS ROAD NETWORK A MUNICIPAL PERSPECTIVE Shaun Moodley Pr Tech Eng


2 ethekwini Metropolitan Municipality iteku means bay of the sea Largest city in KZN & 3 rd largest in SA Area 2 291km 2 Population Hilly topography Sub-tropical climate Africa s busiest port


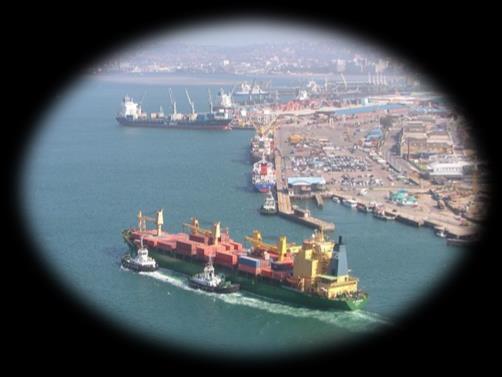


3 ethekwini what are we famous for?


4 but can we build roads? WMA trials - Mpumalanga Fully functioning PMS GB5 trials Solomon Mahlangu Drive Embracing Greenroads HiMA trials South Coast Road Reclaimed asphalt in BSM


5 ethekwini s Road Network An Overview 6762 km 1440 km 777 km 8979 km 1004 km 1200 km 2204 km 365 km 1052 km


6 ethekwini s Road Network An Overview Roads Provision Dept. Road & Stormwater Maintenance Dept km


7 FIELD VALUE ROAD_ID LINE_ID R12825 LINK_ID L12532 ROAD_LABEL LESLEY DR LENGTH_M 78 WIDTH_M 4.9 FROM_DESC KINGSBROOK/ LESLEY TO_DESC BEVERLEY/ LESLEY WARD 16 SUBURB Hatton Estate DISTRICT Pinetown OWNER ETHEKWINI PAVE_TYPE F CATEGORY C RISFSA Class 4 VCI 78 AGG_LOSS D/E 2/2 BINDER D/E 4/5 PATCHING D/E 3/1 SURF_CRACK D/E 2/5 VCI 78 IRI 2.5 MTEF_COST_R MTEF_TRT Reseal MTEF_YR 2014 GIS Integration Road centre-line dataset roads & links Attributes relevant to the PMS Maintained Roads Surfaced & gravel Basis of road asset register Linked to accounting system Proposed Roads Proposed town planning layouts Tracks Access paths in informal areas
8 Defining The Maintained Gravel Network Urban Core Urban Periphery Peri-urban Rural 1 km 276 km 310 km 853 km Graded twice a year Re-gravelled once every five years R /km

9 Land Ownership Issues Peri-urban Rural 310 km 853 km Corporate entity to administer land traditionally owned by the King The trust does not pay taxes to the ethekwini Municipality. The Trust owns approximately 32% of land in KZN.


10 To Pave Or Not To Pave Inferior LOS?? Inclement weather Steep terrain

11 To Pave Or Not To Pave Large cost component is haulage. Sensitive to fuel price increases.


12 To Pave Or Not To Pave Non-compliance by operators Borrow pits situated on Tribal land Geology does not produce good gravel Mineral & Petroleum Resources Development Act (No. 28 of 2002) Mining permit from Dept. of Minerals & Energy Fluctuating Supply Data from Dept. of Mineral Resources ( Scarce Resource
 Eliminate Backlog (years) Cost (Rm/km) Peri-urban & rural (public")
 Single 1103 stabilised 6 8 layer + WC 60 18.")
13 Gravel to Surface Upgrade Programme Zone Length (km) LOS Lifecycle (years) Annual Upgrade (km) Eliminate Backlog (years) Cost (Rm/km) Peri-urban & rural (public transport) 60 TRH Urban & urban periphery 277 TRH Peri-urban & rural (low volume) Single 1103 stabilised 6 8 layer + WC Ok so which do we upgrade first?
14 Taking up the Challenge Select roads for upgrading in an objective manner based on engineering principles while satisfying nonengineering demands Network Level Prioritisation Model
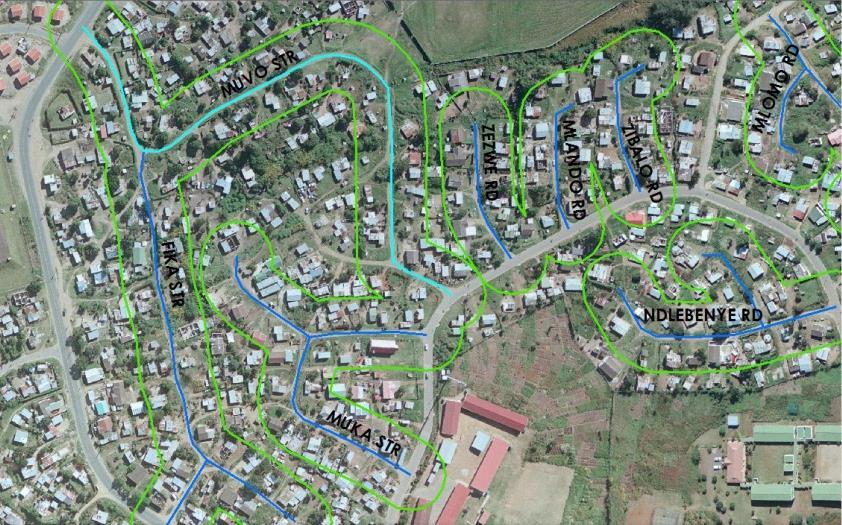
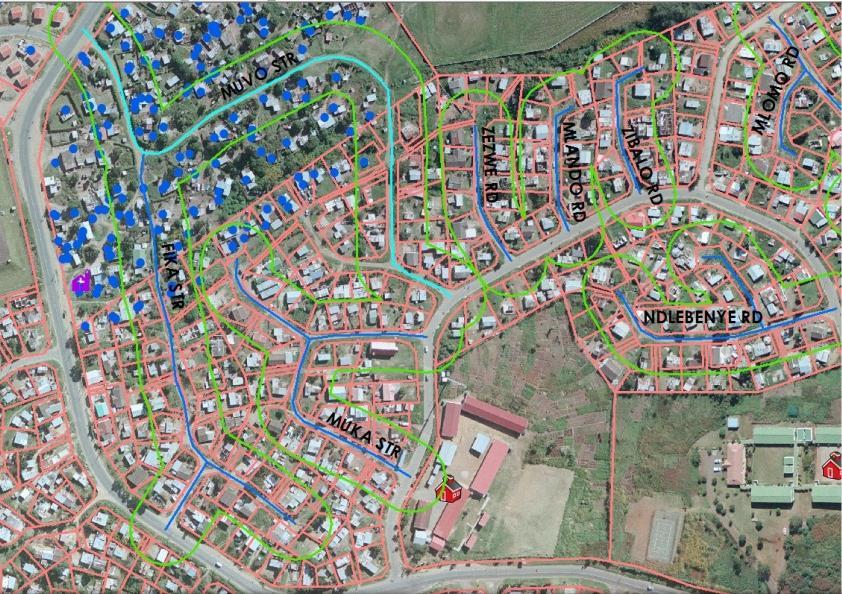
15 Prioritising Upgrades Using A Buffer
16 Network Level Prioritisation Model CRITERIA DESCRIPTION ATTRIBUTE/VALUE WEIGHT Public transport route Gravel roads that form part of the public transport network are strategically important to the city and were thus considered high priority for upgrading. Public transport route: YES 1 Public transport route: NO 0 40 Linked to an existing paved road Upgrading a gravel road that links to an existing paved road is a logical first step to extending the paved network. Linked to a paved road: YES 1 Linked to a paved road: NO 0 30 Development location The location of a gravel road was considered in the context of various development policies. Urban core 1 Urban periphery 0.7 Peri urban Rural 0.3 Gradient Affects drainage. Both the steepest gradient* and average gradient** of each road was calculated. 0 to to to to * 20**
17 Network Level Prioritisation Model CRITERIA DESCRIPTION ATTRIBUTE/VALUE WEIGHT Dwelling density Significant when assessing the dust nuisance factor. Number of dwelling units per unit length of road. total number of dwellings total length of road 15 Access to services or amenities Existing paved ratio The number of social services in the proximity of the road was enumerated. Where roads have both paved and gravel portions, paving the latter improves continuity on the paved network. Schools 10 Fire stations 10 Clinics 10 Police stations 10 Community halls 10 Libraries 5 Cemeteries 5 length of paved portion total length of road 5


18 Design Philosophy DCP Method Integration with other Municipal projects Existing pavement structure & alignment
19 Design Process ACTION Preliminary road evaluation PROCESS Horizontal & vertical alignment In-situ pavement strength & material properties Drainage conditions Traffic Peri-urban & rural: 200 vpd Established townships: volumes from ETA Geometrics & road safety Evaluate cross sectional elements Assess signage & pedestrian crossings Pavement design Use DCP method Suitable pavement structure Materials Establish material requirements Material selection Surfacing Consider all alternative options Select most suitable Drainage Evaluate existing drainage Improve where necessary Asphalt haunching
20 Road Name Gravel to Surface DCP Pavement Design Report 123 STR Traffic Analysis Design Life (Years) 10 Road Width (m) (Average) 0 Growth Rate (%) 3 E80 s per Heavy Vehicle 0 Heavy vehicles per day (both directions) 0 Lane Width Adjustment 2 Cumm. Growth Factor 4309 Cumm. Design Loading (both directions) 0.00 Traffic Class LE 0.01 DCP Analysis Month of Testing Insitu Soil Moisture Condition Jan Normal DCP DN Percentile Utilised 50 Required DN (max.) Insitu DN 50 th Percentile (mm/blow) Design DN 50 th Percentile (mm/blow) Estimated Material Class (TRH 14) DCP CBR Average DN (mm/blow) Std. Dev DN (mm/blow) CoV G G G G DSN 800 (min.) DSN th Percentile (normal) BN th Percentile (normal) Average DSN
21 Gravel to Surface As Built Sheet Required DN (max.) As Built DN 50 th Percentile (mm/blow) Estimated Material Class (TRH 14) DCP CBR Average DN (mm/blow) Std. Dev DN (mm/blow) G G G G G DSN 800 (min.) BN th Percentile (normal) Inverted Pavement Structure Average DSN CoV

22 Implementation Use of Bitumen RECLAIMED Stabilised ASPHALT Materials RECLAIMED ASPHALT Environmentally sustainable Cost effective Enhanced performance Trafficked immediately Water resistant Labour intensive methods
 Wearing course 30mm 85 BSM base 150mm 100 COSTS Rip & re-compact sub-grade 150mm 30 Pavement structure")
23 Pavement Structures Structure Cost (R/m 2 ) Wearing course 30mm 85 BSM base 150mm 100 G4 granular sub-base 200mm 120 Rip & re-compact sub-grade 150mm 30 service life LCC maintenance costs Pavement structure with sub-grade improvement 5m wide = R per km Structure Cost (R/m 2 ) Wearing course 30mm 85 BSM base 150mm 100 COSTS Rip & re-compact sub-grade 150mm 30 Pavement structure without sub-grade improvement 5m wide = R per km


24 Reclaimed asphalt spread with a grader

25 Cement bags placed in readiness for spreading

26 Spreading cement for in-situ recycling

27 In-situ recycling in progress KMA recycler Bitumen tanker Water tanker

28 Electrifying low volume roads?

29 Construction of the asphalt surface

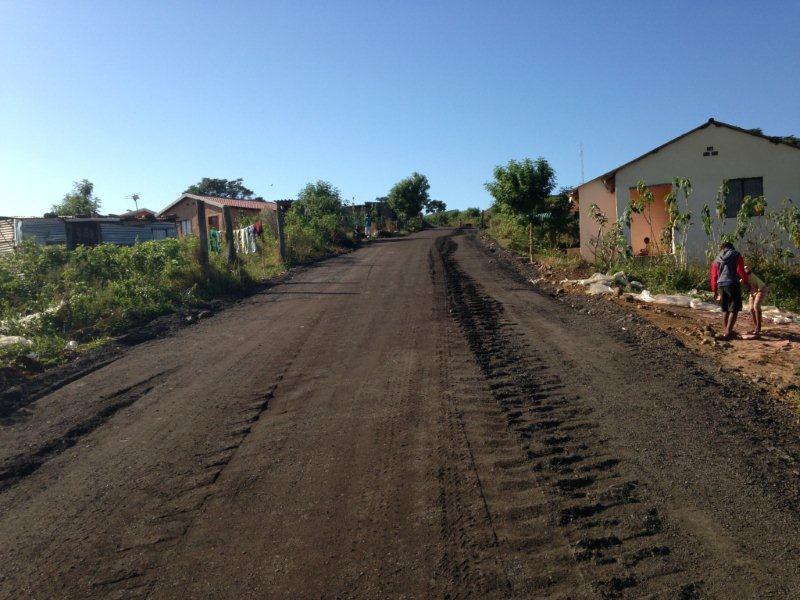
30 The completed product


31 CONCLUSION NETWORK LEVEL PRIORITISATION MODEL

32 THANK YOU