Developments and achievements of Feed-In. evaluation conducted for the IFIC. Cooperation (IFIC) 18th/19th November 2010, Berlin
|
|
|
- Kerry Lloyd
- 5 years ago
- Views:
Transcription


 18th/19th November 2010,")
1 Developments and achievements of Feed-In Systems - Key findings from an evaluation conducted for the IFIC Mario Ragwitz Fraunhofer Institute Systems and Innovation Research 8th Workshop of the International Feed-In Cooperation (IFIC) 18th/19th November 2010, Berlin 1
2 Main policy development on EU level EU Renewable Energy Directive 2009/28/EC New Directive was passed in December 2008 Targets for 2020: 20% renewable energy in final energy consumption Binding targets for Member States National support schemes will remain the cornerstones for the deployment of renewables in Europe Flexibility mechanisms between Member States Statistical transfer Joint projects Joint support schemes Physical imports from third countries Measures to reduce non-economic barriers (particularly reduce administrative, regulative, grid related barriers)
3 Main policy developments on MS level Countries start to adapt ambition level of their policies to target level, e.g. banding of quota system in RO, IT and UK, new tariff levels l for RES-E E in DE, NL and SI, UK feed-in system for RES-E and RES-H MSs start to analyse the impact of specific flexibility measures on their renewable energy sector, first talks between different MSs and between MSs and third countries Little progress on the reduction of non-economic barriers Financing constraints have been significant during last years National Renewable Energy Action Plans currently under evaluation
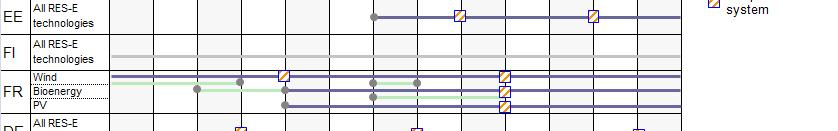
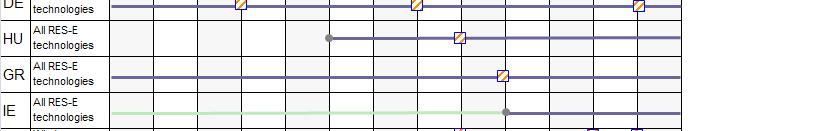
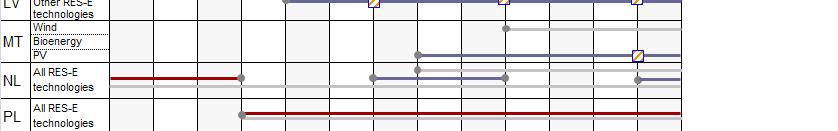
4 Currently implemented policies in the EU
5 Historical development of new RES-E E in the EU-27 New Renewables in the EU-27 Dominating: Wind energy (in the EU-15) & Biomass (in the new member states) 250 Elect tricity gene eration [TW Wh/a] Wind off-shore Photovoltaics Geothermal electricity Biowaste Biogas Solid biomass Wind on-shore


6 Dominating support schemes for RES-E E in the EU M ain RES-E E support instruments t in the EU-2 Quo ta obligatio n Fee d -i n tar iff Fee d -i n premium Oth er instrumen ts t han th e above Notes: 1 ) The patt ern ed colours represent a combin ation of instru ments 2 ) Inves tm ent s grants, tax exem pt ions and fis cal incen tives are not inc luded in th is pictu re. 20 EU countries use feed-in tariffs as main instrument 6 countries have implemented a quota obligation with TGCs with 3 of them partially using feed-in tariffs


7
8 Measuring the effectiveness of RES-E E support 1. Relative or absolute growth rates are typically used to demonstrate the achievements of countries, however both measures are biased 2. Better measure to judge the performance is the absolute growth as ratio of the additional potential E i n = G i n ADD G i n 1 POT i n i E n i G n Effectiveness indicator for RES technology i for the year n Existing electricity generation potential by RES technology i in year n i ADD POT n Additional generation potential of RES technology i in year n until
9 Effectiveness for wind on-shore in the period in EU
10 Current level of support and costs per Member State Example of wind onshore Dec System services cost Minimum i to average generation cost [ /MWh] Average to maximum support level [ /MWh] AT BE BG CY CZ DE DK EE ES FI FR GR HU IE IT LV LT LU MT NL PL PT RO SE SI SK UK
11 Performance of Feed-in Systems in the EU
12 Share of feed-in systems in EU RES capacity until 2009 ES Technolog gies [GW] Installed Capacity of R Comparison of capacity in feed in countries and EU 27 EU 27 Biomass Capacity EU 27 Feed In Biomass Capacity EU 27 Wind Onshore Capacity EU 27 Feed In Wind Onshore Capacity EU 27 PV Capacity EU 27 Feed In PV Capacity
13 Some feed-in tariff success stories By % of all new RES-E generation installed after 1997 in the EU was achieved by countries using feed-in tariffs, which are responsible for 61% of the EU electricity it consumption 85% of all new wind capacity (after 1997) was installed in countries using feed-in tariffs By the end of 2009, wind energy accounted for 6.7% of German electricity production; in Spain 12.7%, in Denmark even 19.5% 100% of the new PV capacity was installed in countries using feed-in tariffs 68% of all new biomass capacity (after 1997) was installed in countries using feed-in tariffs
14 When renewable energy technologies become mainstream the compatibility with electricity markets becomes crucial
15 Design elements to improve system and market integration Implementation of a feed-in premium (higher compatibility with liberalised markets e.g. through an improved demand orientation) But: potentially higher risks for RES-E producers in case of fixed premium Sliding premium (e.g. NL) may reduce these risks Cap and floor system for the overall remuneration (e.g. ES) Premium tariffs are applied in Spain, the Czech Republic, Slovenia, Estonia the Netherlands, Denmark (for onshore wind energy) and Italy (for PV) Requirement of RES-E producers to contribute to grid stability. Germany: Onshore wind turbines connected between 2009 and 2014 have to fulfil technical standards regarding reactive and real power receive an increased FIT (by 0.5 ct/kwh - Systemdienstleistungs-Bonus) Incentive for older turbines on a voluntary basis (0.7 ct/kwh during 15 years).
16 100% 90% 80% 70% 60% 50% 40% 30% 20% 10% 0% Premium tariff design Case study Spain Share of RES-E E sold with the premium option Jun 06 Aug 06 Oct 06 Dec 06 Feb 07 Apr 07 Jun 07 Aug 07 Oct 07 Dec 07 Feb 08 Apr 08 Jun 08 Aug 08 Oct 08 Dec 08 Feb 09 Apr 09 Jun 09 Aug 09 Oct 09 Dec 09 Feb 10 Apr 10 Jun 10 PV Wind Hydro Biomass Residues
17 Support levels for new plants are continuously decreasing in many countries
18 Tariff degression Case study Germany Experience curve for onshore wind energy 100 Turbin ne price per elec ctricity yield [ Ce ents/(kwh/a)] ,000 10, ,000 Cumulative installed capacity [MW] Reduction of 53% from High decrease in costs between 1991 and 1996, lower decrease since 1997 Technology learning overestimated due to decreasing raw material prices Cents/kWh] Remuneration [ Support for onshore wind energy StrEG EEG EEG Year Reduction of 36% from Tariff degression of 1-2% per year
19 Tariff degression in feed-in countries (1) Germany Annual tariff reduction Technology-specific (1% for wind power plants and, once in July 2010 up to 13% and in October 2010 another 3% for PV Consideration of cost reductions induced by learning curve effects Continous incentive for efficiency and cost improvements Greece Tariff degression for small photovoltaic systems (<10 kwp) 5% is foreseen for new entrants between 2012 and 2019 France Tariff degression of 2% annually is for wind since 2008 Italy Tariff degression for Solar PV FIT since % annually Plants commissioned in 2010 receive a premium reduced by another 2%
20 Tariff degression in feed-in countries (2) Czech Republic Annual adjustment of 2-4 % depending on inflation. Exception: Biogas and biomass plants Reduction in the following year limited to 5% of the tariff in force at the time of the calculation of the new tariff Slovenia Recent adjustment of support scheme: RES-E plants <= 5MW supported through a feed-in tariff Larger plants (> 5MW) support from a feed-in premium No degression for fixed feed-in tariff (except PV: 7%) Adjustment of FIT-premium based on energy market prices
21 Technology specific and plant specific ec o ogy spec c a d p a spec c tariffs reduce policy costs
22 Stepped tariff design Electricity generation costs may vary due to: Local conditions (wind & solar yield) Power plant size Fuel type (biomass and biogas) A stepped tariff design takes the different costs into account
23 Stepped tariffs Level depending on local conditions: case study France 10 8 ation or remunera Cents/kWh] Costs [ Flat tariff Producer profit Stepped tariff Generation costs Profit [ Cents/kWh] Producer profit flat Producer profit stepped Full-load hours [h/a] Full-load hours [h/a] Support for onshore wind energy in FR: 8.2 Cents/kWh for 10 years Between and Cents/kWh for the remaining i 5 years (depending on the electricity yield during the first 10 years)
24 For achieving an ambitious target a portfolio of RES technologies being in a different stage of development (cost) - is required. Therefore technology specific support is key to reduce policy costs and to incentivise deployment of less advanced technologies.
25 Technology neutrality leads to high producer surplus Genera ation Cost [ /M MWh ele ] Marginal cost for RES-E Producer Surplus Cost-resource curve (RES-E in the EU27) Power price Required RES-E deployment >> Source: Green-X database << Additional (up to 2020) realisable potential for RES-E [TWh] A technology-neutral neutral support leads to high policy costs technology banding has been introduced in UK, Italy and Romania 25 Source: schematic depiction of aggregated cost curve for RES-E technologies at EU level
26 Impact on Europe ean Power Sector [billion / year] Common EU quota based on TGCs compared to technology specific support Comparison of captured producer rents via auctioning in EU ETS with increased producer rents due to technology neutral certificate trade Captured producer rents via auctioning under the EU ETS Additional producer rents arising from technology-neutral RES-E support as compared to technology specific support High public transfer cost may arise (high h consumer expenditures)
27 Conclusions on EU trade In order to tap potential efficiency gains of optimal resource allocation but avoid large windfall profits the EU Commission, Parliament and Member States have implemented flexibility between Member States and with third countries based on the cooperation mechanisms. Therefore: Currently functioning national support systems will not be undermined Excessive policy costs can be avoided National governments have the information to deliver necessary regime for planning, grid access, balancing and congestion management
28 Conclusions on RES policy design Renewable energy technologies need a long term oriented and risk mitigating deployment policy. Instruments t should be technology specific to reduce policy costs and to promote less mature technologies. Feed-in tariffs have shown the major contribution to the EU RES development until now Compatibility with general energy markets should be ensured, when higher market shares of RES are reached. Innovations need long term, stable and degressive support Effective instruments for RES-E support are frequently Effective instruments for RES E support are frequently economically efficient as well!
29 Thank you very much Kontakt: Mario Ragwitz