Vattenfall Capital Markets Day 2007
|
|
|
- Richard Jefferson
- 5 years ago
- Views:
Transcription

1 Vattenfall Capital Markets Day 2007 Presentation by Arne Mogren Head of Climate Policy at Vattenfall Stockholm, 24 September 2007 Vattenfall AB
2 Currently we are diverging CO2 Emissions from fuel combustion Early peak vs BAU World (cap) B-a-u Mt CO Actual Actual Model Model Model Model Model Model Model Model Model Model Model Model Model Model Model Model Model Model Vattenfall AB 1
 Vattenfall AB 2")
3 Global warming millions at risk in 2080s The EU has decided on 2ºC as the maximum prudent global warming level Source: Parry (2001) Vattenfall AB 2
; European Environment Agency Vattenfall AB")
4 The 2ºC warming target - risks at different CO2e concentration levels Source: Meinshausen (2004); European Environment Agency Vattenfall AB 3

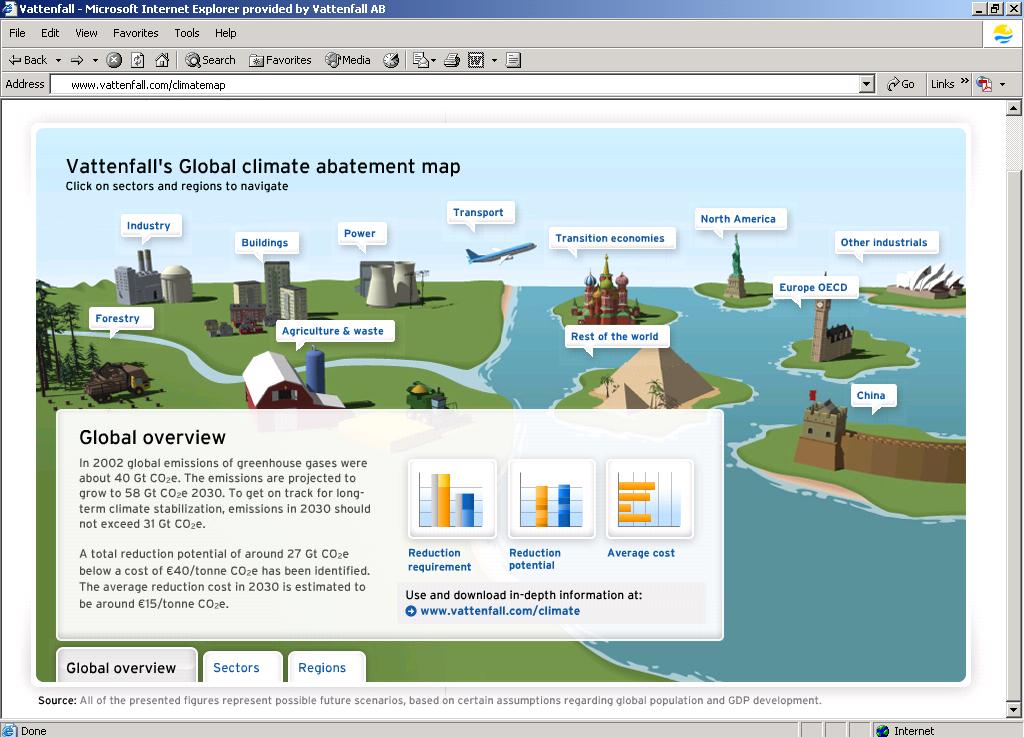
5 Vattenfall s Global Climate Impact Abatement Map Abatement cost = additional cost of a low emission technology/ opportunity compared to business-as-usual (operational cost + depreciation) 6 sectors: power, industry, transportation, buildings, forestry, agriculture 6 regions: North America, Western Europe, Eastern Europe incl. Russia, other industrialized countries, China, Rest of World 3 time frames: 2010, 2020, 2030 The report shows realistic abatement potentials, not forecasts! Vattenfall AB 4
6 What s needed by 2030 to contain global warming below 2 C? CO 2 e emissions per year, Gton Abatement required by 2030 compared to the BAU Emissions growth through 2030 in the business as usual forecast emissions Fixed carbon intensity growth Business as usual decarbonization 2030 BAU emissions according to IEA, EPA 400 ppm 450 ppm 550 ppm Alternative risk levels to keep global warming below 2 C required CO 2 e concentration Vattenfall AB 5

7 Examples of negative cost abatement opportunities Improved insulation Opportunity 25% less energy for heating versus BAU 60% lower lifecycle heating cost* Average abatement cost: -130 EUR/t CO 2 e Total abatement opportunity: 1.6 GtCO 2 e Barriers Misaligned incentives: Builders minimize upfront building costs not life-cycle cost Buyers typically not involved in specifying insulation levels Compact Fluorescent Lamp 80% reduced energy consumption 41% lower lifecycle cost for consumer Average abatement cost: -90 EUR/t CO 2 e Total abatement opportunity: 0.2 GtCO 2 e End-user behavior: Lacking awareness of opportunities Savings low compared to total household budget Require very short payback times * Example for typical house in mild region with electrical heating Vattenfall AB 6


8 Examples of abatement cost calculations power sector Wind power Opportunity Average abatement cost: 21 EUR / tco2e Of which 5 EUR / tco2e is cost induced by the high penetration Total abatement opportunity: 0.5 GtCO 2 e Barriers Environmental impact: Wind mill sites are often perceived as obstacles At higher penetration rates, intermittency becomes a costly issue Carbon capture & storage Potentially installed on 55% of all coal plants by 2030 Abatement cost: EUR/tCO 2 e in 2030 Total abatement opportunity: 3.1 GtCO 2 e Storage: Storage alternatives still need to be tested and approved Technological development: Technology currently existing but needs to be proven at scale in integrated solutions Vattenfall AB 7
9 Marginal abatement cost in the different demand scenarios 2030 Cost of abatement EUR/tCO 2 e 550 ppm 450 ppm 400 ppm Abatement potential GtCO 2 e/year Marginal cost: (EUR/tCO 2 e) Vattenfall AB 8
10 Global cost curve of GHG abatement opportunities beyond business as usual Cost of abatement EUR/tCO 2 e Smart transit Small hydro Industrial non-co 2 Airplane efficiency Stand-by losses Cellulose Industrial Avoided Industrial -30 ethanol deforestation Sugarcane non-co 2 Co-firing CCS; CCS America -40 biofuel biomass new coal -50 Fuel efficient vehicles Industrial motor -60 Water heating systems Air Conditioning -90 Lighting systems Fuel efficient commercial vehicles Insulation improvements Industrial feedstock substitution Livestock/ CCS EOR; soils New coal Nuclear Forestation Wind; low pen. Forestation Solar Soil CCS; coal retrofit Coal-togas shift Asia Waste 2030 Avoid deforestation Abatement GtCO 2 e/year ~27 Gton CO 2 e below 40 EUR/ton (-46% vs. BAU) ~7 Gton of negative and zero cost opportunities Fragmentation of opportunities Vattenfall AB 9
11 All sectors and regions will have to contribute to emissions reductions global cooperation is key to the low carbon economy tco 2 e, 2030 Sectors Regions US + Canada OECD Europe Eastern Europe (incl. Russia) Other Industrial* China Rest of world** Total Power Industrial Transportation Buildings Forestry Agriculture Total * Australia, New Zealand, Japan, Singapore, South Korea, Taiwan, UAE, Saudi Arabia, Qatar, Oman, Kuwait, Israel, Bahrain, Mexico ** Africa, South and Central America excl. Mexico, Asia excl. China and countries included in Other industrialized (see previous note) Vattenfall AB 10
12 Split of opportunities according to abatement cost GtCO 2 e, 2030 Abatement cost EUR/t CO 2 e Regions US + Canada OECD Europe Other Industrial* Eastern Europe (incl. Russia) China Rest of World** Total Total ~50% of negative cost opportunities are in industrialized world (buildings, transportation) ~40 % of EUR/ton opportunities are in Rest of the World, largely driven by forestry opportunities * Australia, New Zealand, Japan, Singapore, South Korea, Taiwan, UAE, Saudi Arabia, Qatar, Oman, Kuwait, Israel, Bahrain, Mexico ** Africa, South and Central America excl. Mexico, Asia excl. China and countries included in Other industrialized (see previous note) Vattenfall AB 11
13 Estimates of total global cost for society Estimates of total abatement cost for the global society* % of global GDP 2030 Comparables % of global GDP ppm 450 ppm 400 ppm Defense spending Insurance spending Oil price increase (USD +30/bbl) Global foreign aid (ODA**) * Lower boundary: Opportunities addressed in order of increasing cost and negative costs are set to zero; upper boundary: Average cost EUR 40/ton ** Official Development Assistance from OECD countries; does not include humanitarian aid or private donations Vattenfall AB 12
14 Possible long-term development of emissions per sector illustrative trends GtCO 2 e per year Mapping analysis Illustrative trends Emissions to maintain 450 ppm CO 2, Gt CO 2 e Potential long term trends Power: Zero; long term if all fossil fuel plants are equipped with CCS Industry: stable; reduction at large emitters (e.g., via CCS) balanced by new, small emitters Transport: stable/decreasing; more bio fuels, hybrids and plug-ins balance increased transportation need Buildings: stable; efficiency improvements balance population growth, further reduction through electrification Agriculture/Waste: stable; improvements in carbon efficiency balance population increase Forestry: zero; deforestation and forestation reaches equilibrium Vattenfall AB 13
15 Three different types of sectors 2030 abatement potential GtCO 2 e EUR/tCO 2 e Key characteristics Power and industry Transportation and buildings <5 (often negative) Mainly industrialized countries Small number of large, rational emitters High cost Minor consumer implications Competitive distortion issues Mainly industrialized countries Billions of small emitters Low/negative cost High consumer implications Forestry, agriculture, waste % developing countries Billions of small emitters Medium/high cost Big social implications Hard to measure & monitor TOTAL 26.7 Vattenfall AB 14
16 Key regulatory mechanisms identified in the abatement investigation Cost of abatement EUR/tCO 2 e Abatement GtCO 2 e/year in 2030 A Policies/ standards for buildings B Long-term stable international system for power and industry C Mechanism to drive selected key and transportation, or a certificate D International system for agriculture and deforestation, linked to the overall developing world agenda technologies down the learning curve system Vattenfall AB 15

17 The core of any solution is convergence market demand can be created Vattenfall AB 16

18 Supply and demand lead to market incentives Vattenfall AB 17
19 Vattenfall AB 18