Southern Watersheds Responses to Sea Level Rise. Back Bay-North Landing-Currituck-Albemarle Sound
|
|
|
- Gregory Shields
- 5 years ago
- Views:
Transcription


1 Southern Watersheds Responses to Sea Level Rise Back Bay-North Landing-Currituck-Albemarle Sound
?")
2 About Extremes: Climate Change and Storms More storm intensity Increasing rainfall Extratropical cyclones (nor easters)? Need to understand the mechanisms and predict Droughts and heat waves Tropicalization and biogeographic shifts

 Additional potential increases in drought, pathogens, and")
3 Coastal Agriculture and Forestry Hurricane intensity increases agricultural damage Careful water level and flow management Timber damage will increase ~ $1B damage per storm event intensity (Cat 1>2>3) Additional potential increases in drought, pathogens, and wildfire
 Moran et al. (2015).")

4 The Southern Watersheds include estuaries that have been closely connected to the ocean. White-deBry map (1590) Moran et al. (2015). Late Holocene Evolution of Currituck Sound, North Carolina, USA: Environmental Change Driven by Sea-Level Rise, Storms, and Barrier Island Morphology. J. Coastal Research.
5 Historic Maps and Charts Exist & Can Inform Long-term Rates of Change Office of Coast Survey (1862)


6 The False Cape barrier spit complex includes high- and low-profile barrier islands Inlets in barrier is. play a large role in their retreat and supply of sand to sounds and estuaries Flood tide delta Morton et al. (2005) USGS Rpt 1401


7 Areas of Peat and Cedar Stumps Under the Beach Attest to Barrier Island Retreat and Erosion Offshore ridges evidence of submerged inlet Having almost welded to the mainland, False Cape depends on onshore and N/S sources of sand

8 Back Bay, Currituck Sound, and Adjoining Tributaries are Coastal Lagoons Kjerfve (1996) classified coastal lagoons by the degree of exchange with the ocean Coastal lagoons are common but ephemeral coastal landscape features. Forcing factors: Freshwater input Wind stress (mixing and sediment redistribution) Tides Flushing, water quality, salinity and sediment supply are intertwined processes Ecosystems will respond to these dynamics
9
 Spatial Characterization of")


 Mapping Coastal Morphodynamics")
10 Allen et al. (2006) Spatial Characterization of Environmental Gradients in a Coastal Lagoon, Chincoteague Bay, USA. Estuaries and Coasts. Other Regional Coastal Features are also Dynamic! Allen et al. (2011) Mapping Coastal Morphodynamics with Geospatial Techniques, Cape Henry, Virginia, USA. Geomorphology.


11 Scenario-based Planning
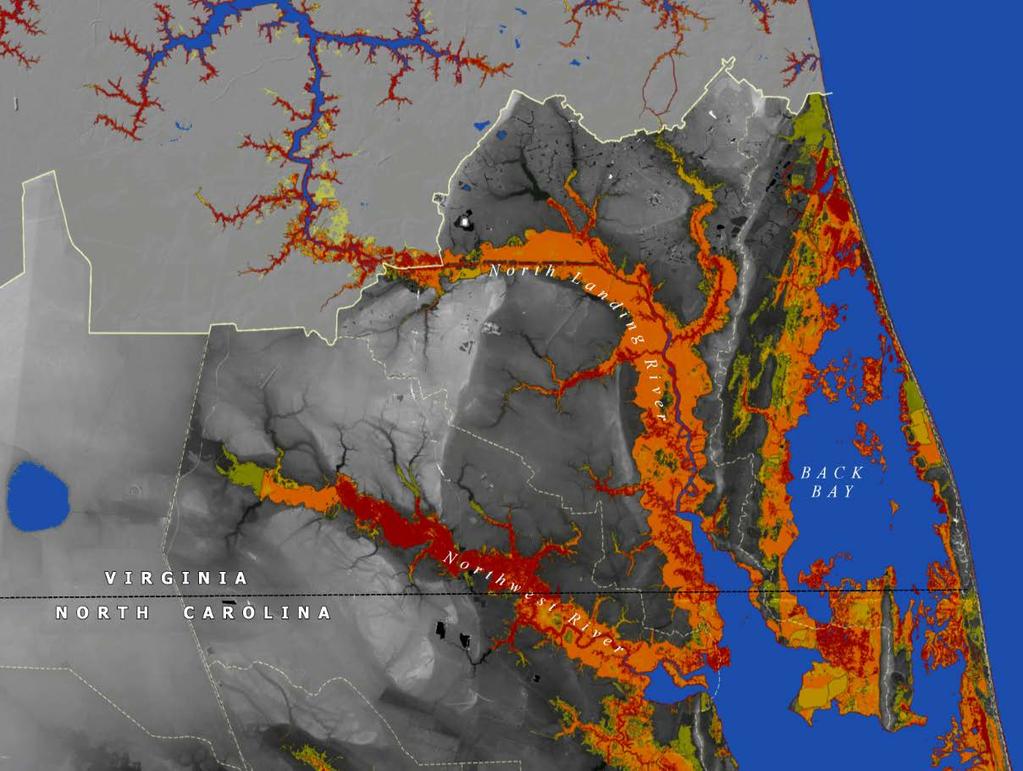

12 Lands Vulnerable to Sea Level Rise
13 TODAY NOAA 2018
14 +1ft
15 +2ft
16 +3ft
17 +4ft


18 Predicting Marsh Migration Potential Ecological models Input measurements and parameters Assumptions Human protective actions
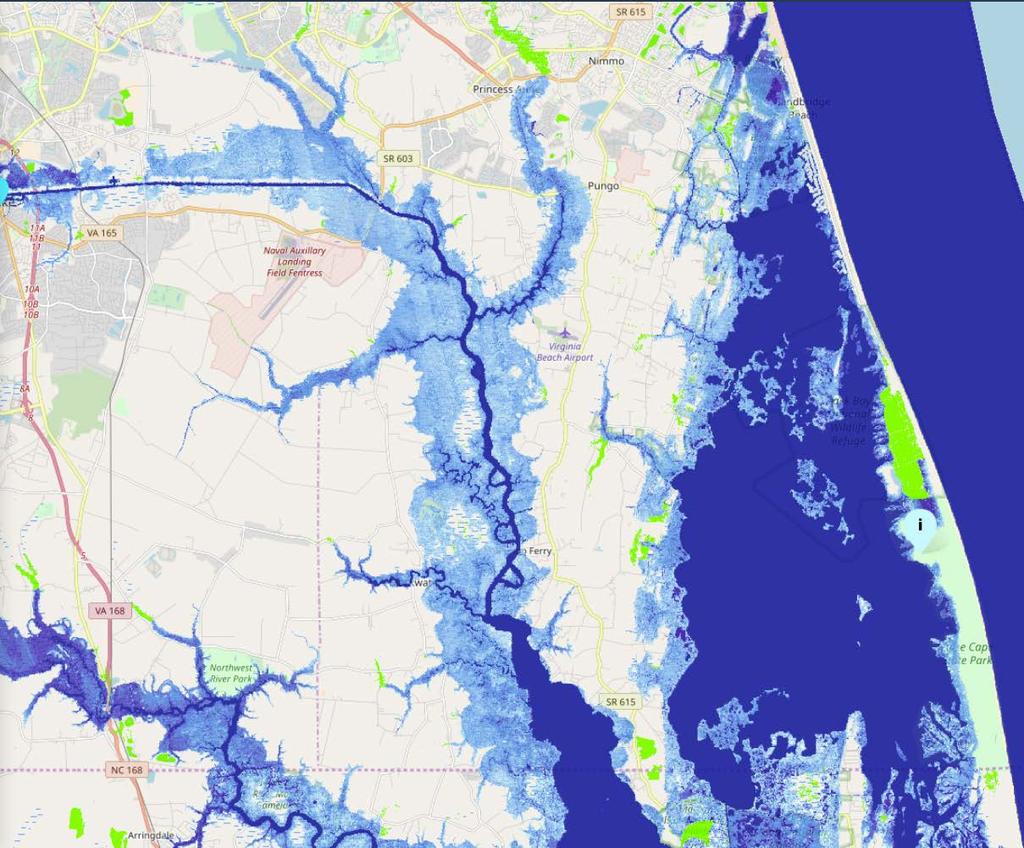
19 NOAA SEA LEVEL RISE VIEWER Today
20 +0.5ft
21 +1ft
22 +1.5ft
23 +2ft
24 +2.5ft
25 +3ft
26 +3.5ft
27 +4ft
28 +4.5ft
29 Today

30 Onsite Wastewater Treatment Systems (OWTS) Inventory for Sea Level Rise Diminished volume of aerobic soil in vadose zone Lower O2 solubility and decrease in the vadose/freeboard zone Overall pathogen removal functions of OWTS decline..the effects of climate change in humid regions receiving more precipitation and warmer temperatures are expected to result in complete loss of the infiltrative and water quality functions of OWTS. Amador et al. (2014) Amador, J., Loomis, G., Kalen, K Soil-Based Onsite Wastewater Treatment and the Challenges of Climate Change. Proceedings, Innovation in Soil-Based Onsite Wastewater Treatment, Albuquerque, NM, April 7-8, (


31 From NC: Salt Intrusion via Extensive Ditch Networks Never let the salt of your tears be tasteless in grief. - Munia Khan Salt-poisoning of interior wetland vegetation. Rapid decomposition of peat soils by sulfate-reducing bacteria. Locally: subsidence and increased inundation Globally: release of previously sequestered carbon as carbon dioxide and methane. *Hackney, C. T., and G. F. Yelverton Effects of human activities and sea level rise on wetland ecosystems in the Cape Fear River Estuary, North Carolina, U.S.A. Pgs in WETLAND ECOLOGY AND MANAGEMENT: Case Studies, D. F. Whigham, R. F. Good and Y. Kvet, eds. Kluwer Academic Publishers, Amsterdam, The Netherlands. Photos courtesy TNC


32 Adaptation of Natural Hydrologic Regimes Adaptation/Management Strategy Water control structures with flashboard risers and tide gates at strategic locations. Preserving carbon reservoir to forestall additional climate change and marsh loss. Courtesy TNC, NC NERR

33 Shoreline Mapping for Change Rates and Erosion Analysis

34

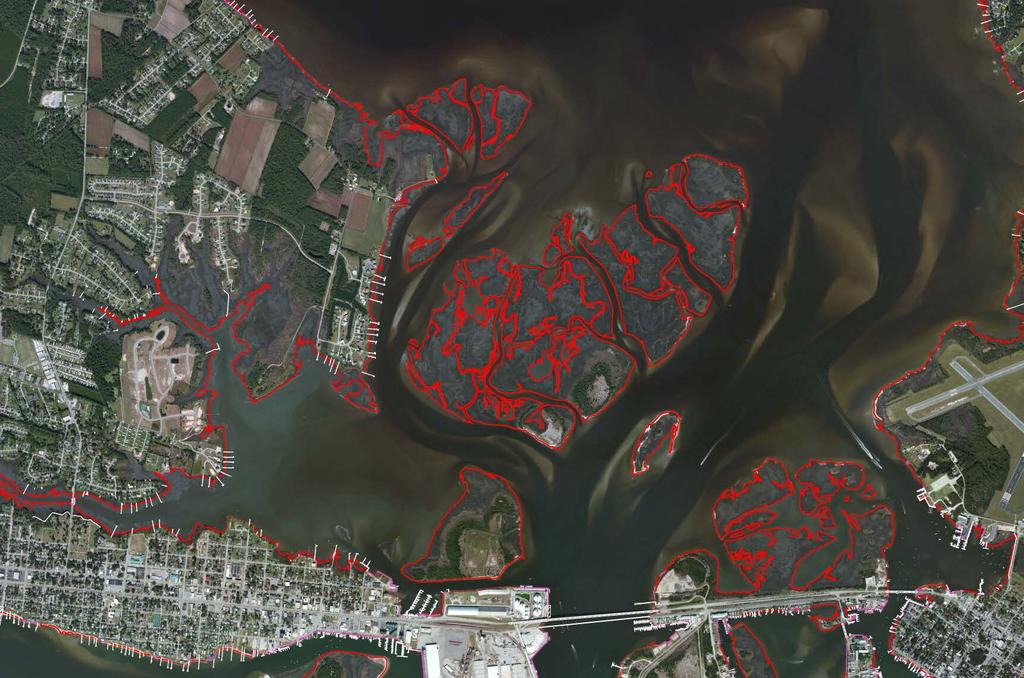
35

36 Shoreline Structures Database NC DCM

37 Research Evolving Vulnerabilities Manteo


38 Research Finer and finer detail Impervious runoff Water retention Surge buffering by wetlands Groundwater Subsidence Policy and planning options Improved hydrologic modeling with better data mapping ditches in Moyock Impervious cover in New Hanover County the watershed size matters!


39 High-Resolution Mapping with Drones
40 Policy Responses Structural Adaptation and Mitigation Protect shorelines from waves and currents Groins, seawalls, bulkheads, breakwaters, revetments Natural or Nature-based Adaptations Marsh and forested wetland restoration Horizontal relocation Maintain or increase sediment supply Groins, river diversions, perched beaches Beach replenishment, sand bypassing, beach scraping, dune restoration Promote or restore SAV Allow overwash, breaching, and inlet opening Nullify sea-level rise Seawalls, dikes and levees Vertical relocation Land reclamation

41 Conclusion and Discussion Scientiae cedit Mare... The Sea Yields only to Knowledge Sea level rise, storms, and climate are huge challenges Technology is also rapidly changing Solutions can be found through better prediction, adaptation, education, and collaboration
42
43 Policy and Planning Comprehensive and hazard mitigation plans Regulate floodplain boundaries Upfit/floodproof/targeted redevelopment Estuarine or sea-level setbacks Rolling conservation easement Transfer development rights Restrict rebuilding and promote resilient cluster development Other conditional zoning, impact and excise fees