CHESAPEAKE BAY PROGRAM BAY BAROMETER HEALTH & RESTORATION IN THE CHESAPEAKE BAY WATERSHED
|
|
|
- Howard Harrington
- 5 years ago
- Views:
Transcription
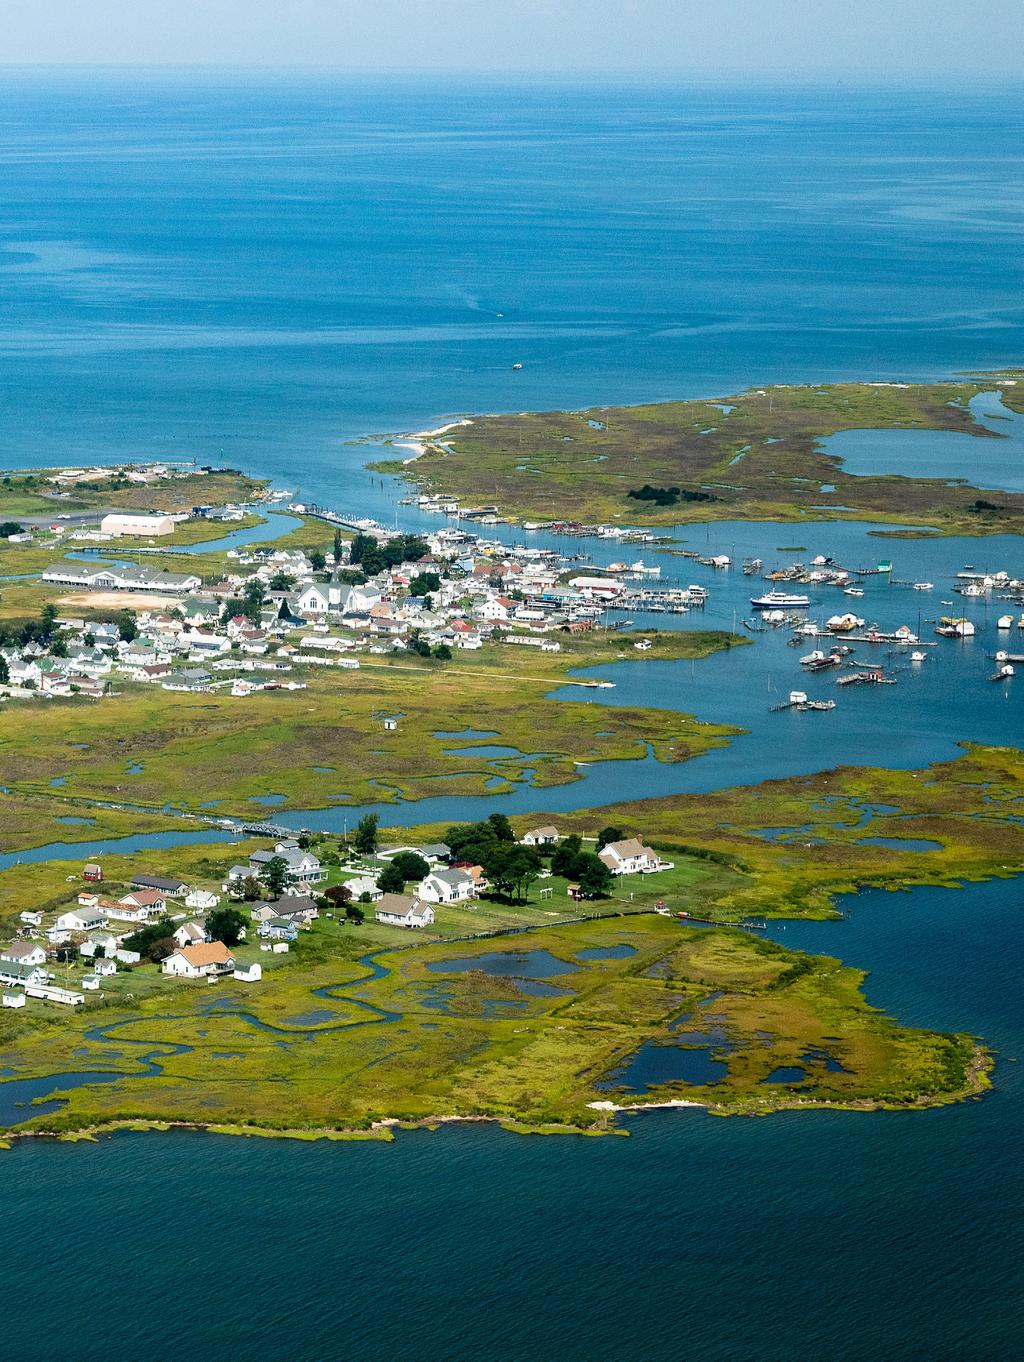


1 CHESAPEAKE BAY PROGRAM BAY BAROMETER HEALTH & RESTORATION IN THE CHESAPEAKE BAY WATERSHED

2 BAY BAROMETER The Chesapeake Bay watershed is a dynamic ecosystem. Tracking changes in its health over time allows scientists to understand the effects of our management actions and our progress toward meeting health and restoration goals. The data in this report reflect the goals and outcomes our partnership agreed to work toward in the 2014 Chesapeake Bay Watershed Agreement. THE CHESAPEAKE BAY WATERSHED AGREEMENT The Chesapeake Bay Program is guided by the goals and outcomes of the Chesapeake Bay Watershed Agreement. Signed on June 16, 2014, this agreement commits our partners to protecting and restoring the Bay, its tributaries and the lands that surround them. Our environment is an interconnected system and achieving the goals and outcomes of this agreement will support improvements in the health of the watershed and the people who live here. Track our progress toward the Chesapeake Bay Watershed Agreement at
 TREE CANOPY WETLANDS 10 CLEAN WATER WATER QUALITY 2017 AND 2025 WATERSHED IMPLEMENTATION PLANS WATER QUALITY STANDARDS ATTAINMENT AND MONITORING TOXIC")
3 CONTENTS 01 ABUNDANT LIFE SUSTAINABLE FISHERIES BLUE CRAB ABUNDANCE BLUE CRAB MANAGEMENT FISH HABITAT FORAGE FISH OYSTERS VITAL HABITATS BLACK DUCK BROOK TROUT FISH PASSAGE FOREST BUFFERS STREAM HEALTH SUBMERGED AQUATIC VEGETATION (SAV) TREE CANOPY WETLANDS 10 CLEAN WATER WATER QUALITY 2017 AND 2025 WATERSHED IMPLEMENTATION PLANS WATER QUALITY STANDARDS ATTAINMENT AND MONITORING TOXIC CONTAMINANTS TOXIC CONTAMINANTS POLICY AND PREVENTION TOXIC CONTAMINANTS RESEARCH HEALTHY WATERSHEDS HEALTHY WATERSHEDS CONSERVED LANDS LAND CONSERVATION PROTECTED LANDS LAND USE METHODS AND METRICS DEVELOPMENT LAND USE OPTIONS EVALUATION ENGAGED COMMUNITIES PUBLIC ACCESS PUBLIC ACCESS SITE DEVELOPMENT ENVIRONMENTAL LITERACY ENVIRONMENTAL LITERACY PLANNING STUDENT MEANINGFUL WATERSHED EDUCATIONAL EXPERIENCES SUSTAINABLE SCHOOLS STEWARDSHIP CITIZEN STEWARDSHIP DIVERSITY LOCAL LEADERSHIP CLIMATE CHANGE CLIMATE RESILIENCY CLIMATE ADAPTATION CLIMATE MONITORING AND ASSESSMENT

4 ABUNDANT LIFE 1
 SUSTAINABLE FISHERIES Adult Female Blue Crab Population (Millions) 300 250 200 150 100 50 0 89 91 2007 2008 162 2009 246 2010 191 2011 95 2012 Between")
5 BLUE CRAB ABUNDANCE Maintain a sustainable blue crab population based on a target of 215 million adult females. Abundance is above the threshold but below the target. ADULT FEMALE BLUE CRAB ABUNDANCE ( ) SUSTAINABLE FISHERIES Adult Female Blue Crab Population (Millions) Between 2017 and 2018, the abundance of adult female blue crabs in the Chesapeake Bay fell 42 percent from 254 million to 147 million. This number is above the 70 million threshold but below the 215 million target. Because of natural variability in annual blue crab populations, blue crab abundance is expected to fluctuate from year to year Target Threshold Blue crabs support commercial and recreational fisheries across the region. Since female-specific regulations were implemented in 2008, the average adult female blue crab population has doubled its number from the previous decade. 2
6 BLUE CRAB MANAGEMENT Manage for a stable and productive blue crab fishery. Percentage of Population Harvested The blue crab stock is not depleted and is not being overfished. FEMALE BLUE CRAB HARVEST ( ) 40% 30% 20% 10% 0% 38% % % % % 2011 Threshold Target In 2017, an estimated 21 percent of female blue crabs were harvested from the Chesapeake Bay. For the tenth consecutive year, this number is below the 25.5 percent target and the 34 percent overfishing threshold. Experts have determined the blue crab stock is not depleted and is not being overfished. 10% % % % 16% % 2017 FISH HABITAT Identify and characterize critical fish and shellfish spawning, nursery and forage areas within the Chesapeake Bay and its tributaries. Integrate information and conduct assessments to inform restoration and conservation efforts. MONITORING PROGRESS This outcome targets the habitats that fish and shellfish use at critical life stages. Due to the range of habitat types throughout the watershed and the gap in our understanding of the quality of habitat for fish reproduction, feeding, growth or refuge, there is currently no established baseline for this outcome. A recent workshop prioritized the suite of environmental and biological data that would be needed for a watershed-wide assessment of fish habitat. In 2018, the Scientific and Technical Advisory Committee funded a workshop to develop a Fish Habitat Assessment Framework for the Chesapeake Bay watershed. The framework helps identify the condition and primary drivers of fish habitat change and evaluate the effectiveness of fish habitat conservation and restoration efforts. It also guides conservation and restoration planning and investments, and helps managers develop specific habitat objectives to support fish stock productivity. A strategy document is being finalized. Since female-specific management measures which include daily bushel limits and a shortened female harvest season were implemented in 2008, the percentage of female crabs removed from the Chesapeake Bay by fishing has declined. In fact, this number was lower between 2008 and 2017 than it was between 1990 and The percentage of male crabs removed from the Bay by fishing has not shown the same pattern. This suggests that this management approach is effective for female crabs but has not produced the same results for males. 3
7 FORAGE FISH Improve our capacity to understand the role of forage fish in the Chesapeake Bay. By 2016, develop a strategy for assessing the forage base available as food for predatory species. MONITORING PROGRESS Research is underway to understand the effects of shoreline development on the Chesapeake Bay forage base. OYSTERS Increase finfish and shellfish habitat and the water quality benefits of restored oyster populations. Restore native oyster habitat and populations in 10 tributaries by 2025 and ensure their protection. The Chesapeake Bay Program has funded the evaluation of the levels of shoreline development that impact the Bay s forage fish and invertebrate species. Research is underway at the Virginia Institute of Marine Science to quantify species-specific thresholds for the amount of hardened shoreline an environment can support before populations of blue crab, Atlantic croaker, menhaden and other forage species become stressed and decline in abundance. The results of this research will ensure planners and natural resource managers understand the tipping point for forage species when it comes to hardened shoreline conditions, and will support informed decisions about coastal development. Tributary Tributary Restoration Plan Reef Construction & Seeding Monitoring & Evaluation Harris Creek (Md.) Complete Complete In Progress 351/351 Tred Avon (Md.) Complete In Progress 81/147 Little Choptank (Md.) Restoration is underway in eight tributaries. Oyster Reef Restoration Progress Dashboard (2017) Complete In Progress Completed/Target Acreage 284/440 Piankatank (Va.) In Progress In Progress 253/TBD Lynnhaven (Va.) In Progress In Progress 91/152 Lafayette (Va.) Complete In Progress 75/80 Great Wicomico (Va.) In Progress In Progress 61/TBD Lower York (Va.) In Progress In Progress TBD Each of the eight tributaries that have been selected for oyster restoration is at a different level of progress in a process that involves collecting data, developing a restoration plan, constructing and seeding reefs, and monitoring and evaluating restored reefs. In Maryland, 716 acres of oyster reefs have been restored. In Virginia, 480 acres of oyster reefs have been restored. Harris Creek is the first of 10 tributaries selected for restoration to reach its restoration target. (In September 2018, the Lafayette River became the second. These restored acres will be reflected in next year s oyster restoration update.) Post-restoration monitoring is now underway to ensure Harris Creek reefs are successful. According to collaborative research from the University of Maryland Center for Environmental Science and Virginia Institute of Marine Science, oysters from restored reefs in Harris Creek have the potential to remove one million pounds of nitrogen pollution from the Chesapeake Bay over the course of a decade. During summer months, these oysters are also capable of filtering the entire volume of Harris Creek in just 10 days. 4

8 BLACK DUCK By 2025, restore, enhance and preserve wetland habitat to support a wintering population of 100,000 black ducks. The Black Duck Action Team is developing a habitat-based indicator to track progress toward this outcome. VITAL HABITATS A recent U.S. Geological Survey assessment of black duck habitat vulnerability showed that during the fall, underwater grasses provide a higher quality food source for wintering black ducks than marshes, mudflats and other habitats. This suggests that underwater grass recovery will benefit wintering black duck populations. 5
9 BROOK TROUT Restore and sustain naturally reproducing brook trout in the Chesapeake Bay s headwater streams, with an eight percent increase in occupied habitat by MONITORING PROGRESS According to an analysis by the Eastern Brook Trout Joint Venture, wild brook trout occupy 33,200 square kilometers of habitat (including streams shared with brown and/or rainbow trout) in the Chesapeake Bay watershed. Of that habitat, 13,500 square kilometers of the watershed is allopatric or wild brook trout only streams. The Chesapeake Bay Program is working to incorporate this brook trout occupancy census as an indicator of progress toward this outcome. The U.S. Geological Survey is working with the National Park Service and the Maryland Department of Natural Resources to support a declining brook trout population by removing introduced brown trout from the headwaters of Maryland s Big Hunting Creek. This on-the-ground management work stemmed from previous research that revealed increased competition between brook trout and brown trout as stream temperatures increased. The removal of brown trout will increase the amount of wild brook trout habitat. FISH PASSAGE Increase habitat to support sustainable migratory fish populations in the Chesapeake Bay watershed s freshwater rivers and streams. By 2025, restore historical fish migration routes by opening 1,000 additional stream miles to fish passage. Over 100 percent of outcome achieved. STREAM MILES OPENED TO FISH PASSAGE ( ) Stream Miles 1,400 1,200 1, ,126 1,236 Progress to restore historical fish migration routes is measured against a 2011 baseline of 2,510 stream miles open to the migration of fish. Between 2012 and 2017, 1,236 additional miles were opened, marking a 124 percent achievement of our 1,000-mile goal Goal The demolition and removal of Bloede Dam began in September Efforts to remove dams from Maryland s Patapsco River began with the 2010 removal of Union Dam, followed by the 2011 removal of Simkins Dam. Located downstream of Union and Simkins, Bloede has been out of commission for most of the last century and had deteriorated beyond reasonable repair. Although a fish ladder was installed at Bloede in the 1990s, removing the dam itself will help realize the full benefits of restored fish migration, habitat and spawning area. 6
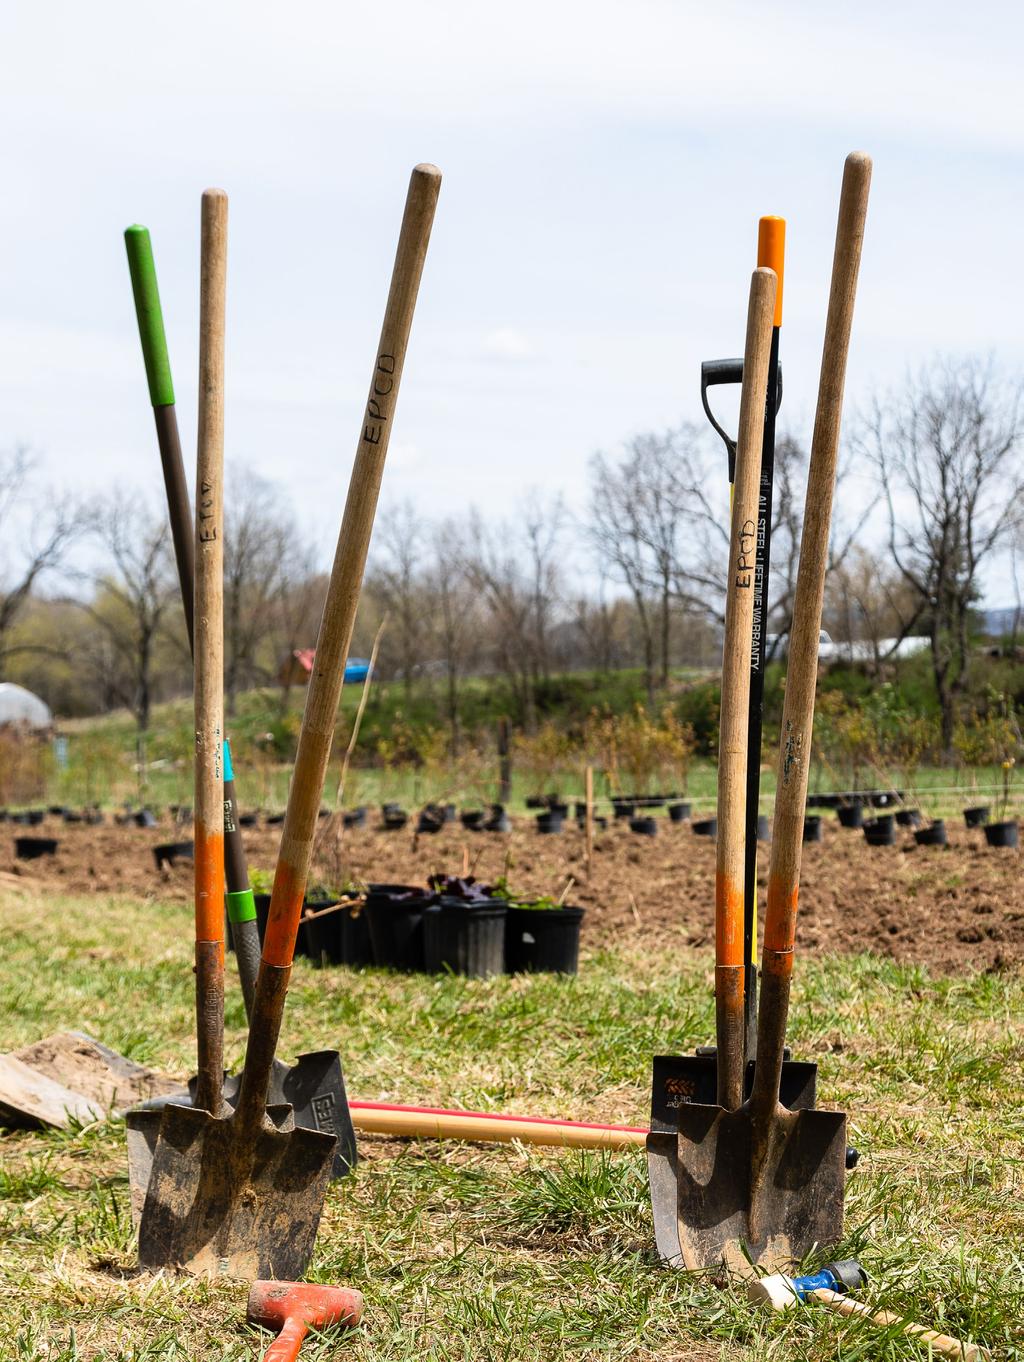
10 FOREST BUFFERS Increase the capacity of forest buffers to provide water quality and habitat benefits throughout the Chesapeake Bay watershed. Restore 900 miles of riparian forest buffers per year and conserve existing buffers until at least 70 percent of the watershed s riparian areas are forested. STREAM HEALTH Improve the health and function of 10 percent of stream miles above the 2008 baseline. Buffer Miles (Annual) Six percent of annual target achieved. FOREST BUFFERS PLANTED ( ) 1, (Baseline) According to jurisdiction-reported data, about 56 miles of forest buffers were planted along the Chesapeake Bay watershed s rivers and streams in While this marks some progress toward the outcome, it is 844 miles below the 900-mile-peryear target and the lowest restoration total of the last 22 years. High-resolution land cover data indicate that approximately 70 percent of the watershed s 288,000 miles of stream banks and shorelines currently have forest buffers in place. An aerial assessment of riparian land across the watershed revealed 1.4 million acres that could be converted from crops, pasture or turf to streamside trees and shrubs. Forest buffers are important in both agricultural and urban areas to slow the flow of runoff, absorb nutrients and prevent pollution from entering rivers and streams. The New York State Department of Environmental Conservation and the New York Natural Heritage Program launched an online tool to guide local and regional riparian forest buffer restoration. The Statewide Riparian Opportunity Assessment features a suite of products to help conservation practitioners, watershed stakeholders and others identify and prioritize streamside sites for restoration and protection Target Twenty-five percent of streams in fair, good or excellent condition. 11.9% 18% Stream Health ( ): Chessie BIBI Subwatershed Ratings 8.4% 9.1% 12% 7.5% 8.7% 54.4% Excellent Good Fair Poor Very Poor Insufficient In 2018, researchers and resource managers established the six years between 2006 and 2011 as the baseline period for our indicator of stream health. Known as the Chesapeake Basin-wide Index of Biotic Integrity (Chessie BIBI), this indicator describes the quality of assessed streams in relation to all of the streams in the watershed. During this baseline period, the Chessie BIBI ranked 25 percent of the Bay watershed with fair, good or excellent stream conditions and 21 percent with poor or very poor conditions. Fifty-four percent of streams in the watershed were not included in this assessment, due to insufficient or absent data. Experts are working to fill this data gap with a model that will use landscape variables to predict Chessie BIBI ratings in areas with few or no sampling sites. The Stream Health Workgroup convened a workshop of scientists and managers to establish a practical baseline for the indicator used to measure stream health. These experts determined that a six-year sampling period between 2006 and 2011 would be the best baseline for the Chesapeake Basin-wide Index of Biotic Integrity. However, the challenge of insufficient data remains. To fill these data gaps, participants have suggested establishing additional sampling sites and using statistical analysis to determine where state resources should be directed and citizen monitoring should occur. 7
11 SUBMERGED AQUATIC VEGETATION (SAV) Sustain and increase the habitat benefits of submerged aquatic vegetation (SAV) in the Chesapeake Bay. Achieve and sustain 185,000 acres of SAV Bay-wide, with a target of 90,000 acres by 2017 and 130,000 acres by Acres Fifty-seven percent of outcome achieved. SUBMERGED AQUATIC VEGETATION (SAV) ABUNDANCE ( ) 200, , ,000 50, , , , , Submerged Aquatic Vegetation Observed 75,438 92,315 99, , Target According to preliminary data from the Virginia Institute of Marine Science (VIMS), an estimated 104,843 acres of underwater grasses were observed in the Chesapeake Bay in 2017: 14,843 acres greater than the Chesapeake Bay Program s 2017 restoration target and 57 percent of the partnership s 185,000-acre goal. For the third year in a row, underwater grass abundance in the Bay has reached the highest amount ever recorded by VIMS. For the first time in our decades-long history of monitoring submerged aquatic vegetation, total abundance has surpassed 100,000 acres. In 2011 and 2016, severe weather conditions and flight restrictions over military air space prohibited mapping of some areas of the Bay. Estimates for these areas were included based on previous years acreage Estimated Additional Acreage 2017 Goal TREE CANOPY Expand urban tree canopy by 2,400 acres by 2025 to provide air quality, water quality and habitat benefits throughout the Chesapeake Bay watershed. MONITORING PROGRESS The Chesapeake Bay Program defines tree canopy as tree plantings in communities of any size including urban, suburban and rural that are not on agricultural lands. A two-pronged indicator that will track the extent of tree canopy in the Chesapeake Bay watershed is currently under development. This indicator will include remotely sensed changes in tree canopy, to be updated every five years, and annual tree plantings reported as best management practices by watershed jurisdictions under the Chesapeake Bay Total Maximum Daily Load. This year, the Cacapon Institute of West Virginia received the Arbor Day Foundation s first-ever Headwaters Award. The award recognizes the Cacapon Institute for their work using trees and forests to protect the water quality of rivers, streams and ultimately the Chesapeake Bay. One way they do that is through the Carla Hardy West Virginia Project CommuniTree program, the largest tree steward program in the state. The purely volunteer program promotes tree planting and education on the public lands that surround the headwaters of the Potomac River. During the spring of 2018, they planted more than 550 trees. A study has found that on-land nutrient reductions along with conservation initiatives have resulted in rebounding underwater grasses and a healthier Chesapeake Bay. Published in the Proceedings of the National Academy of Sciences, the study analyzes the positive impact of nutrient reductions resulting from management actions taken throughout the watershed. Researchers determined that a 23 percent reduction of the Bay s average nitrogen levels and an eight percent reduction of the Bay s average phosphorus levels have resulted in more than three times the amount of underwater grasses than were found in the 1980s. This represents the largest modern resurgence of underwater grasses ever recorded, not only in the Bay, but in the entire world. 8
12 WETLANDS Increase the capacity of wetlands to provide water quality and habitat benefits throughout the Chesapeake Bay watershed. Create or reestablish 85,000 acres of tidal and non-tidal wetlands and enhance the function of an additional 150,000 acres of degraded wetlands by 2025, primarily on agricultural or natural landscapes. Eleven percent of outcome achieved. WETLANDS RESTORED ON AGRICULTURAL LANDS ( ) Acres (Cumulative) 83,000 62,500 42,000 21,500 1,000 1,921 3,531 6,258 6,705 6,925 7, (Baseline) ,876 9,103 In 2017, 9,103 acres of wetlands were created or re-established on agricultural lands. While this outcome includes a target to restore 85,000 acres of tidal and non-tidal wetlands in the watershed, 83,000 of these restored acres should take place on agricultural lands. The wetlands restored on agricultural lands between 2010 and 2017 mark an 11 percent of achievement of the 83,000-acre goal. In November 2018, the Chesapeake Bay Program launched a website to accelerate wetland restoration on private lands in the watershed. Wetlands Work features educational information about the benefits of wetlands and the incentives of wetland restoration, as well as a collection of restoration success stories and a search function that connects landowners with funding programs and wetland planners in their area. Learn more by visiting Goal States in the Chesapeake Bay watershed have made significant progress in planning, adapting and increasing the resilience of the watershed to climate change, but impacts continue to be felt from the headwaters of New York on the Susquehanna to the low-lying, near-shore wetlands in Virginia. - Zoe Johnson Former Coordinator, Climate Resiliency Workgroup 9

13 CLEAN WATER 10

14 2017 AND 2025 WATERSHED IMPLEMENTATION PLANS By 2017, have practices and controls in place that are expected to achieve 60 percent of the nutrient and sediment load reductions necessary to achieve applicable water quality standards compared to 2009 levels. By 2025, have all practices and controls in place to achieve applicable water quality standards as articulated in the Chesapeake Bay Total Maximum Daily Load. Practices are in place to achieve 40 percent of the nitrogen reductions, 87 percent of the phosphorus reductions and 67 percent of the sediment reductions necessary to attain water quality standards. WATER QUALITY MODELED POLLUTION LOADS Millions of Pounds Nitrogen Phosphorus Sediment Millions of Pounds Billions of Pounds Target: Target: Target: According to the Chesapeake Bay Program s Watershed Model, pollution controls put in place between 2009 and 2017 lowered nitrogen loads 11 percent, phosphorus loads 21 percent and sediment loads 10 percent. While the partnership has exceeded its 2017 pollution reducing targets for phosphorus and sediment, it fell short of its pollution reducing target for nitrogen by 15 million pounds. Progress toward the 2025 targets will be assessed through the Phase 6 Watershed Model. Watershed jurisdictions have been encouraged to consider the co-benefits of best management practices (BMPs) in the development of their Phase III Watershed Implementation Plans (WIPs). The Chesapeake Bay Program has identified 12 outcomes most likely to receive co-benefits from these BMPs, and developed a presentation and series of fact sheets to inform WIP developers, local governments and other stakeholders. 11
15 WATER QUALITY STANDARDS ATTAINMENT AND MONITORING Improve our capacity to monitor and assess the effects of the management actions being taken to implement the Chesapeake Bay Total Maximum Daily Load and improve water quality. Report annual progress being made in attaining water quality standards and trends in reducing nutrients and sediment in the watershed. An estimated 42 percent of the Chesapeake Bay and its tidal tributaries met water quality standards between 2015 and NITROGEN LOADS AND RIVER FLOW ( ) Millions of Pounds PHOSPHORUS LOADS AND RIVER FLOW ( ) Millions of Pounds '00 '01 '02 '03 '04 '05 '06 '07 '08 '09 '10 '11 '12 '13 '14 '15 '16 '17 20 River Flow '00 '01 '02 '03 '04 '05 '06 '07 '08 '09 '10 '11 '12 '13 '14 '15 '16 '17 20 River Flow SEDIMENT LOADS AND RIVER FLOW ( ) Billions of Gallons Billions of Gallons Approximately 240 million pounds of nitrogen, 12.7 million pounds of phosphorus and 4.3 billion pounds of sediment reached the Chesapeake Bay in ESTIMATED WATER QUALITY STANDARDS ATTAINMENT ( ) Billions of Pounds '00 '01 '02 '03 '04 '05 '06 '07 '08 '09 '10 '11 '12 '13 '14 '15 '16 '17 River Flow Between October 2016 and September 2017, approximately 240 million pounds of nitrogen, 12.7 million pounds of phosphorus and 4.3 billion pounds of sediment reached the Chesapeake Bay, a 0.4 percent, seven percent and 14 percent decrease from the previous year, respectively. While the amount of nitrogen, phosphorus and sediment entering the Bay from its watershed can change dramatically from year to year complicating efforts to analyze trends over time the fact that nutrient and sediment loads decreased between 2016 and 2017 even as river flow increased could be a positive sign of progress toward controlling pollution Billions of Gallons 100% Goal Percentage of Tidal Chesapeake in Attainment 80% 60% 40% 20% 0% 37% 40% '07-'09 '08-'10 33% 31% 28% '09-'11 34% '10-'12 '11-'13 '12-'14 Assessment Periods 37% 40% 42% '13-'15 '14-'16 According to preliminary data, more than 42 percent of the Chesapeake Bay and its tidal tributaries met water quality standards during the 2015 to 2017 assessment period. This marks the highest level of water quality standards attainment since 1985 and shows aquatic conditions have improved following the damaging impacts of Hurricane Irene and Tropical Storm Lee. While estimated water quality standards attainment is improving, water quality remains far below the 100 percent attainment needed for clean water and a stable aquatic habitat, and an estimated 58 percent of tidal waters are considered impaired. '15-'17 The Chesapeake Monitoring Cooperative (CMC) is developing a clearinghouse of water quality data collected by citizen scientists and nontraditional monitoring partners around the watershed. Once available, this data may be integrated into local monitoring networks to support education, management, restoration targeting and regulatory assessment. To further this effort, the Chesapeake Bay Program Principals Staff Committee signed a memorandum of understanding in October 2018 to support the CMC and its work. 12

16 TOXIC CONTAMINANTS POLICY AND PREVENTION Improve practices and controls that prevent or reduce the effects of toxic contaminants on aquatic systems and humans. Build on existing programs to reduce the amount and effects of PCBs in the Chesapeake Bay watershed. Evaluate the implementation of additional policies, programs and practices for other contaminants that need to be further reduced or eliminated. Eighty-three percent of the Chesapeake Bay and its tidal tributaries were partially or fully impaired by toxic contaminants in TOXIC CONTAMINANTS TOXIC IMPAIRMENTS IN THE TIDAL CHESAPEAKE BAY ( ) Percentage of Tidal Segments 100% 80% 60% 40% 20% 0% 80.4% 82.6% 72.2% 73.9% According to data submitted by jurisdictions in 2016, 83 percent of the Chesapeake Bay s tidal segments are partially or fully impaired by toxic contaminants. This marks a continued increase in the observation of toxic contaminant impairments since While chemical contamination is often characterized as a localized problem occurring in hot spots or regions of concern, metals, PCBs and priority organics exceed water quality criteria in at least part of all the tidal tributaries that deliver water to the main stem of the Bay. Toxic contaminants in the Chesapeake Bay and its tidal tributaries impact fish, and contaminants like PCBs concentrate in a fish s fat and skin. The Chesapeake Bay Program developed an infographic that illustrates the importance of following fish consumption advisories, and has worked with the Anacostia Riverkeeper and the Anacostia Watershed Society to provide fishing and cooking demonstrations to underserved communities. Learning how to prepare properly trimmed fillets allows people to more safely consume locally caught fish. 13
17 TOXIC CONTAMINANTS RESEARCH Increase our understanding of the impacts and mitigation options for toxic contaminants. Develop a research agenda and further characterize the occurrence, concentrations, sources and effects of mercury, PCBs and other contaminants of emerging and widespread concern. In addition, identify which best management practices might provide multiple benefits of reducing nutrient and sediment pollution as well as toxic contaminants in waterways. MONITORING PROGRESS The research agenda of the Toxic Contaminants Workgroup has improved our understanding of several issues related to toxic contaminants. Studies in the Susquehanna River basin have identified disease as an important factor leading to fish health problems and mortality. Studies by the U.S. Geological Survey suggest that toxic contaminants are compromising the immune systems of fish, making them more susceptible to disease and other factors degrading their health. While research from the U.S. Fish and Wildlife Service indicates the presence of tumors in brown bullhead catfish in the Anacostia and Potomac rivers has decreased, the presence of tumors in these fish is still significantly higher than in fish collected from rural areas in the Chesapeake Bay. Several tributaries in the Chesapeake Bay watershed are impaired by PAHs, or polycyclic aromatic hydrocarbons, which are present in materials like pavement sealant. While some consumer products that contain PAHs have been banned, there is no program that identifies PAH levels in new pavement sealant. In 2018, the Toxic Contaminants Workgroup received funding to work with the District Department of Energy and Environment to create a method for determining the levels of PAHs in pavement sealant to help contractors and residents make safe and informed consumer choices. Having monitoring and assessment data readily available allows the partnership to better understand the impacts of a changing climate on the Chesapeake Bay ecosystem and use this information to build resilience into our resources, habitats and communities. - Jennifer Dopkowski Acting Coordinator, Climate Resiliency Workgroup 14

18 HEALTHY WATERSHEDS Ensure 100 percent of state-identified currently healthy waters and watersheds remain healthy. MONITORING PROGRESS Each jurisdiction in the Chesapeake Bay region has its own definition of healthy waters and watersheds, and its own programs to support watershed protection. Honoring state preferences, the Chesapeake Bay Program will not seek a single definition for healthy waters and watersheds but will strategically track and support the preservation of stateidentified healthy waters and watersheds. These waters and watersheds, as identified in 2017, will serve as the baseline from which we assess watershed health and measure progress toward this outcome. The Chesapeake Bay Program is working to determine the feasibility of using a framework like the Environmental Protection Agency s Preliminary Healthy Watersheds Assessments to track change from this baseline. HEALTHY WATERSHEDS Healthy, intact ecosystems provide multiple co-benefits to communities. When healthy watersheds are present, they can increase property values, create recreational and economic opportunities, and prevent costly restoration and ecosystem service replacements following intense weather. A 2017 study in Scientific Reports, for example, found that intact wetlands in the northeastern United States helped avoid $625 million in direct flood damages during Hurricane Sandy. 15

19 CONSERVED LANDS 16

20 PROTECTED LANDS By 2025, protect an additional two million acres of lands throughout the watershed currently identified as highconservation priorities at the federal, state or local level including 225,000 acres of wetlands and 695,000 acres of forestland of highest value for maintaining water quality. Sixty-eight percent of outcome achieved. PROTECTED LANDS ( ) 10,000,000 Goal LAND CONSERVATION Acres (Cumulative) 8,000,000 6,000,000 4,000,000 2,000, ,013,132 8,409,076 8,804,577 9,164, (Baseline) (Preliminary) Preliminary data collected in 2018 show that, since 2010, approximately 1,364,000 acres of land in the Chesapeake Bay watershed have been permanently protected from development. This marks an achievement of 68 percent of the goal to protect an additional two million acres and brings the total amount of protected land in the watershed to over nine million acres. State agencies are the largest entities contributing to land protection: they hold approximately 44 percent of the protected acres in the watershed. The data supporting this indicator will be finalized when Version 2.0 of the Protected Areas Database is released. An effort will also be made at this time to collect and include more recent data from the District of Columbia and West Virginia. The Chesapeake Bay Program is working to improve the data standards and best practices associated with the Protected Lands indicator. While the Bay Program is currently able to update this indicator only every two years, a new project to improve the accuracy of this data could allow us to generate real-time status updates of protected land in the watershed. These data improvements will help our partners incorporate land conservation into their Phase III Watershed Implementation Plans and accurately evaluate their conservation progress. 17
21 LAND USE METHODS AND METRICS DEVELOPMENT By 2016, develop a watershed-wide methodology and locallevel metrics for characterizing the rate of farmland, forest and wetland conversion, measuring the extent and rate of change in impervious surface coverage and quantifying the potential impacts of land conversion to water quality, healthy watersheds and communities. Share this information with local governments, elected officials and stakeholders. MONITORING PROGRESS Work is underway to develop a methodology and metrics for characterizing the rate of farmland, forest and wetland conversion; measuring the extent and rate of change in impervious surface coverage; and quantifying the potential impacts of land conversion on water quality, healthy watersheds and communities. This work will be based on changes to the landscape observed between 1985 and 2015, and is expected to be updated every two to five years. The U.S. Geological Survey has used the Chesapeake Bay Land Change Model to demonstrate how five future land use scenarios could reduce nutrient and sediment pollution in the mid-atlantic. State and local governments can use the model to create custom scenarios that reflect their own land use policies, allowing land use planning and conservation practices to receive credit against future increases in development-related pollution. These scenarios will be considered during the development of Phase III Watershed Implementation Plans, which highlights the importance of understanding how actions on land impact water quality. LAND USE OPTIONS EVALUATION By the end of 2017, with the direct involvement of local governments or their representatives, evaluate policy options, incentives and planning tools that could assist them in continually improving their capacity to reduce the rate of conversion of agricultural lands, forests and wetlands as well as the rate of changing landscapes from natural lands to those that are impervious. Strategies should be developed for supporting local governments and others efforts in reducing these rates by 2025 and beyond. MONITORING PROGRESS In June of 2017, two projects were completed to support the evaluation of existing land use policy options, incentives and planning tools that can reduce the rate of farm, forest and wetland conversion to developed lands. The Conservation Land-Use Policy Toolkit describes and evaluates seven policy tools that local governments can use to slow the conversion of farms, forests and wetlands. The Healthy Watersheds Forest Retention Project explains how local governments can save resources by using forest conservation as a method of managing stormwater and includes toolkits of policies and practices that can support forest conservation in Pennsylvania and Virginia. The next phase of this project will train local leaders in policy and practice implementation and produce a financial model to incentivize private investment in land conservation. The Conservation Land-Use Policy Toolkit highlights several policy tools that local governments can use to monitor green spaces and impervious surfaces. In Delaware, for example, the Brownfields Development Program allows developers and other parties to work with the Department of Natural Resources and Environmental Control s Site Investigation and Restoration Section to purchase, remediate and develop brownfield sites. To support community revitalization and growth, Delaware s Downtown Development District initiative offers grants to attract local investment and redevelopment. 18
22 19 ENGAGED COMMUNITIES

23 PUBLIC ACCESS By 2025, add 300 new public access sites to the Chesapeake Bay watershed, with a strong emphasis on providing opportunities for boating, swimming and fishing, where feasible. Fifty-one percent of outcome achieved. PUBLIC ACCESS SITES ( ) 1,500 Goal PUBLIC ACCESS Sites (Cumulative) 1, ,139 1,154 1,172 1,208 1,225 1,247 1,271 1, (Baseline) Between 2010 and 2017, 153 boat ramps, fishing piers and other public access sites were opened on and around the Chesapeake Bay. This marks a 51 percent achievement of the goal to add 300 new access sites to the watershed by 2025 and brings the total number of access sites in the region to 1, Thanks to funding from the National Park Service and its partners, more than 650 students across the Chesapeake Bay watershed participated in the Kids in Kayaks and Wilderness Inquiry Canoemobile programs. They learned how to safely paddle on a local waterway and explored the Bay s cultural, ecological and historical heritage. 20

24 ENVIRONMENTAL LITERACY PLANNING Each participating Chesapeake Bay jurisdiction should develop a comprehensive and systemic approach to environmental literacy for all students in the region that includes policies, practices and voluntary metrics that support the environmental literacy goals and outcomes of the Chesapeake Bay Watershed Agreement. Twenty-two percent of respondents to a Chesapeake Bay Program survey self-identified as well-prepared to put a comprehensive and systemic approach to environmental literacy in place. ENVIRONMENTAL LITERACY LOCAL EDUCATION AGENCIES ENV. LITERACY PREPAREDNESS (2017) Percentage of Local Education Agencies 100% 80% 60% 40% 20% 0% DE (8 LEA) DC (1 LEA) MD (24 LEAs) PA (193 LEAs) VA (94 LEAs) WV (8 LEAs) Well-Prepared Somewhat Prepared Not Prepared Non-Reporting In 2017, 22 percent of the 132 local education agencies that responded to a Chesapeake Bay Program survey self-identified as well-prepared to deliver high-quality environmental literacy programming to their students. Fifty-eight percent of responding school districts identified as somewhat prepared and 20 percent identified as not prepared. This marks an increase in environmental literacy preparedness since the pilot Environmental Literacy Indicator Tool survey was distributed in At its 2018 meeting, the Chesapeake Executive Council recommended that the superintendents of state departments of education and the secretaries of state natural resource agencies convene a biennial Environmental Literacy Leadership Summit to coordinate efforts, share best practices and discuss progress toward achieving the environmental literacy goals in the Chesapeake Bay Watershed Agreement. 21
25 STUDENT MWEE Increase students age-appropriate understanding of the watershed through participation in teacher-supported Meaningful Watershed Educational Experiences (MWEEs) and rigorous, inquiry-based instruction, with a target of at least one MWEE in elementary, middle and high school depending on available resources. HIGH SCHOOL MWEE AVAILABILITY (2017) Percentage of Local Education Agencies 100% 80% 60% 40% 20% 0% DE (8 LEA) DC (1 LEA) MD (24 LEAs) PA (193 LEAs) VA (94 LEAs) WV (8 LEAs) System-Wide Availability Some Availability No Availability Non-Reporting Thirty-nine percent of responding local education agencies reported providing system-wide MWEEs in at least one grade level in elementary school, 43 percent reported providing systemwide MWEEs in at least one grade level in middle school and 31 percent reported providing system-wide MWEEs in at least one course in high school. During a Meaningful Watershed Educational Experience (MWEE), students must investigate an environmental issue, participate in an outdoor field experience, take action to address an environmental issue and analyze, evaluate and communicate their conclusions. In 2017, 72 percent of the 132 local education agencies that responded to a Chesapeake Bay Program survey reported providing MWEEs to at least some of their elementary school students. At the middle school level, this number rose to 77 percent, and at the high school level, it rose to 82 percent. The extent of system-wide MWEEs has remained relatively constant since the pilot Environmental Literacy Indicator Tool survey was distributed in The Education Workgroup has developed a suite of free videos and online courses to help teachers prepare to lead Meaningful Watershed Educational Experiences. These materials are available on Bay Backpack: the Chesapeake Bay Program s online resource for environmental learning. Learn more at ELEMENTARY SCHOOL MWEE AVAILABILITY (2017) Percentage of Local Education Agencies 100% 80% 60% 40% 20% 0% DE (8 LEA) DC (1 LEA) MD (24 LEAs) PA (193 LEAs) VA (94 LEAs) WV (8 LEAs) System-Wide Availability Some Availability No Availability Non-Reporting MIDDLE SCHOOL MWEE AVAILABILITY (2017) Percentage of Local Education Agencies 100% 80% 60% 40% 20% 0% DE (8 LEA) DC (1 LEA) MD (24 LEAs) PA (193 LEAs) VA (94 LEAs) WV (8 LEAs) System-Wide Availability Some Availability No Availability Non-Reporting 22
26 SUSTAINABLE SCHOOLS Increase the number of schools in the region that reduce the impact of their buildings and grounds on their local watershed, environment and human health through best practices, including student-led protection and restoration projects. Certified Sustainable Schools Fourteen percent of public and charter schools in the Chesapeake Bay watershed are certified sustainable. CERTIFIED SUSTAINABLE SCHOOLS ( ) % 11.62% 14.15% 2015 Sustainable Public & Charter Schools Other Public & Charter Schools In 2017, 14 percent of public and charter schools in the Chesapeake Bay watershed 610 schools in all were certified sustainable. This marks a 22 percent increase since In 2018, Lanier Middle School in Fairfax, Va., was recognized as a U.S. Department of Education Green Ribbon School for their sustainability initiatives. The school has established nine water bottle filling stations, a recycling program and a student pledge to reduce waste and recycle in their classrooms. Students also complete stewardship projects that explore environmental topics and learn about food waste during food sharing drives The greater Hampton Roads region has seen increased nuisance flooding as a result of sea level rise, subsidence and more intense and frequent weather events. Flooding complicates our efforts to improve local water quality as the runoff carries increased levels of pollutants back into the watershed, creating a financial, as well as an environmental burden on our communities. - Andria McClellan Norfolk City Council and Local Government Advisory Committee member 23

27 CITIZEN STEWARDSHIP Increase the number and diversity of trained and mobilized citizen volunteers who have the knowledge and skills needed to enhance the health of their local watersheds. Residents of the region scored a 24 out of 100 on the Citizen Stewardship Index. Citizen Stewardship Index (2017) 24 Citizen Stewardship Index Score STEWARDSHIP 76 Citizen Stewardship Potential In 2017, residents of the Chesapeake Bay watershed scored a 24 out of 100 on the Citizen Stewardship Index. There are three components to this baseline score. The Personal Action score which is currently 38 measures the adoption of 19 actions that individuals can take to improve water quality and environmental health. The Volunteering score which is currently 23 measures the portion of the public participating in community efforts to improve water quality and environmental health. And the Advocating score which is currently 19 measures the portion of the public engaging in local and regional activities on behalf of water quality and environmental health. To score a 100 on the Citizen Stewardship Index, everyone in the region would need to do everything they could in their daily lives to improve water quality and environmental health. The first-ever comprehensive survey of stewardship actions and attitudes in the Chesapeake Bay watershed found that 71 percent of residents want to do more to make their local waterways healthy, but only 35 percent agree that their actions contribute to water pollution where they live. Organizations advancing environmental stewardship should emphasize the power of personal action and community engagement to capitalize on the individual motivation the data show exists: 71 percent of residents want to act to support clean water, and 68 percent are aware of actions they can take to reduce water pollution at the local level. 24
28 DIVERSITY Identify minority stakeholder groups not currently represented in the leadership, decision-making or implementation of current conservation and restoration activities. Create meaningful opportunities and programs to recruit and engage these groups in the Chesapeake Bay Program s work. Percentage of Profile Respondents About 13 percent of respondents to a Chesapeake Bay Program diversity profile self-identified as non-white. CHESAPEAKE BAY PROGRAM DIVERSITY PROFILE (2016) 100% 75% 50% 25% 0% 84% Self-identified White Profile Respondents 13% Self-identified Non-white Profile Respondents Leadership Non-Leadership 35% of Watershed Residents are Non-white 25% 2025 Targets for Self-identified Non-white Profile Respondents LOCAL LEADERSHIP Increase the knowledge and capacity of local officials on issues related to water resources and in the implementation of economic and policy incentives that will support local conservation actions. MONITORING PROGRESS Before the Chesapeake Bay Program can increase the knowledge and capacity of local elected officials to protect the Chesapeake Bay, the partnership must determine how many local governments are participating in restoration activities and what their local elected officials know about the watershed. To this end, a survey of local elected officials will be administered in The Local Leadership Workgroup is working to identify trusted sources who can share vital information with local elected officials that will help them become leaders in watershed restoration. The workgroup is exploring the development of a peer-to-peer information-sharing network, and is considering conducting tours that will teach local elected officials about watershed restoration and coordinating the development of a local elected official watershed education program. While age, gender, sexual orientation, religious faith, income level and other characteristics are important aspects of diversity, the Chesapeake Bay Program has chosen to focus first on expanding racial and ethnic diversity among the partnership. In 2016, 13 percent of respondents to a Chesapeake Bay Program diversity profile self-identified as non-white. Of the people who reported holding a position in leadership, 89 percent identified themselves as white and 11 percent identified themselves as non-white. The partnership has set a target to increase the percentage of people of color in its program to 25 percent and increase the percentage of people of color in its leadership to 15 percent by The Diversity Workgroup and the Chesapeake Research Consortium have launched the Chesapeake Student Recruitment, Early Advisement and Mentoring Program (C-StREAM) to help underserved students enter the environmental career pipeline. C-StREAM welcomed its first four interns through a pilot program at the Chesapeake Bay Program in the summer of

29 CLIMATE CHANGE 26

30 CLIMATE RESILIENCY CLIMATE ADAPTATION Pursue, design and construct restoration and protection projects to enhance the resiliency of the Chesapeake Bay and its aquatic ecosystems against the impacts of coastal erosion, coastal flooding, more intense and more frequent storms, and sea level rise. MONITORING PROGRESS The Chesapeake Bay Program is exploring the adoption of up to nine indicators that will track our progress toward climate resiliency. These indicators include hardened shorelines, restored habitat, protected lands, urban tree canopy, land use and land cover, the availability of wetland migration corridors, the spatial distribution of climate-sensitive fish species, the community composition of underwater grasses, and the extent of local policies that support climate resiliency and local practices designed to manage stormwater. The development of these indicators will depend on the quality of supporting data, the added value of the indicators for helping to understand and explain management successes, and the priorities and resources of the Climate Resiliency Workgroup. The Climate Resiliency Workgroup helped create a Chesapeake Bay-specific process and tool to incorporate climate change into all levels of decision-making for management strategies and actions. This Climate-Smart Decision Tool presents a comprehensive review of principles for ecosystem management and adaptation to climate change vulnerabilities. It s a general framework for integrating climate change information into each step of the management planning cycle, and will help managers understand what changes are needed for any level of management action or decision to remain effective in the face of climate change. This guide is available on the Chesapeake Bay Program s website. 27

31 CLIMATE MONITORING AND ASSESSMENT Monitor and assess the trends and likely impacts of changing climatic and sea level conditions on the Chesapeake Bay ecosystem, including the effectiveness of restoration and protection policies, programs and projects. AVERAGE AIR TEMPERATURE CHANGE ( ) LEGEND 0-1 F Increase 1-2 F Increase 2-3 F Increase NY PA WV MD DC DE VA Climate divisions are used by the National Oceanic and Atmospheric Administration to understand regional trends, changes and anomalies in temperature, precipitation, and other climate and weather conditions around the country. Between , of the 33 climate divisions in the Chesapeake Bay watershed, 32 have experienced statistically significant long-term increases in air temperature. Average increases in air temperature have ranged from 0.4 degrees Fahrenheit in southern West Virginia to more than 2.5 degrees Fahrenheit in Delaware. Regions closer to the mainstem of the Bay have warmed more than regions farther upstream. As average air temperatures continue to rise, rivers and streams will absorb more heat. 28

32 STREAM TEMPERATURE CHANGE ( ) LEGEND Stream Monitoring Station with Statistically Significant Temperature Increase Between 1960 and 2014, 27 of the 72 stream sites across the Chesapeake Bay watershed experienced a statistically significant increase in water temperature. At these sites, temperatures increased by an average of 2.1 degrees Fahrenheit. Increasing stream temperature can impact the habitat available to brook trout. As the temperature of the region s streams has increased, scientists have documented the disappearance of the only native trout in our watershed, which need cold, clean water to survive. In fact, high water temperature has been named the greatest disturbance to brook trout populations in Maryland and Virginia. In general, the largest increases in stream temperature have occurred in the southern part of the watershed. 29

33 RELATIVE SEA LEVEL RISE IN INCHES( ) LEGEND Tide Gauge Monitoring Station Baltimore Washington, DC Annapolis Cambridge Soloman s Island Kiptopeke Sewell s Point Relative sea level has increased at each of the Chesapeake Bay s long-term tide gauge stations. Between , sea level increased between one-eighth of an inch to approximately one-sixth of an inch each year. Total increases in sea level range from seven inches in Baltimore, Maryland to more than 10 inches in Sewell s Point, Virginia. Regionally, relative sea level rise is compounded by the natural sinking of the land s surface. Locally, it can be exacerbated by the human extraction of groundwater. Members of the Chesapeake Bay Program Principals Staff Committee agreed to a three-part climate strategy in March First, jurisdictions will include a narrative strategy in their 2019 Phase III Watershed Implementation Plans (WIPs) about how they will address climate change. Second, the Bay Program will sharpen its understanding of the impacts of climate change on the Bay watershed, identify research needs and refine nutrient and sediment load estimates for each watershed jurisdiction in March Third, jurisdictions will account for additional nutrient and sediment loads, and improved understanding of best management practices, beginning in September These will be reflected in a Phase III WIP addendum and/or the two-year milestones. 30

34 THE CHESAPEAKE BAY PROGRAM The Chesapeake Bay Program is a regional partnership that works across state lines to protect and restore the Chesapeake Bay watershed. Our partners include the U.S. Environmental Protection Agency, the Chesapeake Bay Commission, the District of Columbia and the states of Delaware, Maryland, New York, Pennsylvania, Virginia and West Virginia. Through the Bay Program, federal, state and local agencies, non-profit organizations, academic institutions and citizens come together to secure a brighter future for the Bay region. Learn more at The Chesapeake Bay Program has created several resources, including ChesapeakeProgress, Bay Backpack and Wetlands Work, dedicated to tracking and advancing our progress toward achieving the goals and outcomes outlined in the Chesapeake Bay Watershed Agreement.

35 CHESAPEAKEPROGRESS ChesapeakeProgress helps federal, public and internal oversight groups track the Chesapeake Bay Program s progress toward the goals and outcomes of the Chesapeake Bay Watershed Agreement. It includes accurate, up-to-date and accessible data and information on the indicators of environmental health, restoration and stewardship which are outlined in this Bay Barometer. Learn more at BAY BACKPACK Bay Backpack is an online resource that supports hands-on environmental learning. By providing educators with information about funding opportunities, field studies, and curriculum guides and lesson plans related to the Chesapeake Bay, Bay Backpack helps educators find the tools they need to give their students Meaningful Watershed Educational Experiences (MWEEs) and ultimately help meet our Student MWEE Outcome. Learn more at WETLANDS WORK Wetlands Work is a resource for agricultural landowners in the Chesapeake Bay watershed. It was developed by the Chesapeake Bay Program s Wetland Workgroup to connect landowners with the people and programs that can support wetland restoration on their land and meet the Wetlands Outcome in the Chesapeake Bay Watershed Agreement. Learn more at


36 CHESAPEAKE BAY PROGRAM SEVERN AVENUE, SUITE 112 ANNAPOLIS, MD YOUR-BAY PRINTED ON RECYCLED PAPER DESIGN, CONTENT & PHOTOGRAPHY: CHESAPEAKE BAY PROGRAM CREATIVE TEAM