Overview of Florida s s Regulatory Environment
|
|
|
- Sophia Armstrong
- 5 years ago
- Views:
Transcription

1 Overview of Florida s s Regulatory Environment October 21 st, 2011 Eduardo Balbis, P.E. Commissioner Florida Public Service Commission


2 Florida Public Service Commission Gubernatorial Appointees Confirmed by Senate C O M M I S S I O N E R C O M M I S S I O N E R C H A I R M A N C O M M I S S I O N E R C O M M I S S I O N E R Eduardo E. Balbis Lisa Polak Edgar Art Graham Ronald A. Brisé Julie Imanuel Brown West Palm Beach Tallahassee Jacksonville Miami Tampa


3 The PSC was established in 1887 and regulates: Electric Natural Gas Water & Wastewater Telecommunications
4 ELECTRIC
 18 rural electric cooperatives (limited to safety, rate structure, territorial boundaries, bulk power supply, operations, and")
5 PSC s Regulatory Authority: 5 investor-owned electric companies (all aspects of operations, including rates and safety) 35 municipally owned electric companies (limited to safety, rate structure, territorial boundaries, bulk power supply, operations, and planning) 18 rural electric cooperatives (limited to safety, rate structure, territorial boundaries, bulk power supply, operations, and planning)

6 Investor-Owned Electric Utilities Approximate Company Service Areas


7 Florida Power Plants 89 Power Plant Sites Source: Department of Environmental Protection All facilities shown are greater than 25 MW

8 Statewide Generating Fuel Portfolio 2010
9 State of Florida Generation Fuel Mix (% Total Net Energy for Load) Energy Generation by Fuel Type (% NEL) 60% 50% 40% 30% 20% 10% 0% 15.6% 9.8% 13.4% 36.4% 24.8% 25.1% 17.6% 46.8% 55.5% Nuclear Coal Natural Gas Oil Interchange, NUG, Renewables (1.2%), Other 2000 Actual 2010 Actual 2020 Projected 15.7% 2.4% 0.7% 14.7% 12.2% 5.4%
10 Florida s Renewable Capacity in MW (2009) Current Florida Reliability Coordinating Council data expected in mid to late July Landfill Gas % Hydro % Solar % Waste Heat % Biomass % Municipal Solid Waste % Total Florida Renewable Capacity: 1,219.9 MW Total Florida Electric Generation Capacity: 58,420 MW (Summer)


11 Increasing Renewable Generation There are three paths to increasing renewable generation: Utility-Owned Third Party-Owned Customer-Owned
12 Utility-Owned Renewable Resources Utility-owned renewables are the smallest portion of the total: Represents 13 percent of existing renewables. Hydroelectric generation is limited by Florida s geography. Existing Utility-Owned Renewable Resources (MW) MW Total Solar Biomass Landfill Gas Hydro
13 Building New Renewable Generation Utility-owned renewable generation has three paths: Power Plant Site Act (PPSA) Facilities > 75 MW of steam or solar capacity; cost recovery through base rates. Non-PPSA units Facilities < 75 MW of steam or solar capacity; cost recovery through base rates. Enabling Legislation e.g., Section (4), F.S., allowed recovery for up to 110 MW through Environmental Cost Recovery Clause.
14 Third Party Generators A majority of renewable generation is from purchased power: Represents 87 percent of renewable energy generated. Roughly 2/3 of purchases are non-firm. Existing Renewable Purchases (MW) - 1,116.5 MW Total Solar Biomass Municipal Solid Waste Waste Heat Landfill Gas 408.6
15 Purchased Power Agreements Florida statutes require utilities to interconnect with and purchase electricity from renewable and alternative generators. Utilities purchase capacity and energy via two methods: Standard offer contract with flexible pricing options, including levelized capacity payments and fixed energy payment options. Recent Examples of Negotiated Contracts Purchasing Utility Renewable Provider MW PEF Trans World 40 PEF BG&E 45 PEF FB Energy 60 FPL SWA 55 FPL SWA Negotiated contracts at rates that do not exceed the utility s cost to produce electricity (avoided cost).
16 Customer-Owned Renewables Standard interconnection, net metering, and other policies have resulted in a steady growth of smaller customer-owned renewable resources. Net Metering Connections: 2,833 Total Net Metering Capacity (MW): 20.4 MW Investor-Owned Municipal Rural Electric Cooperatives ,
17 C R I T I C A L I S S U E S Electric Fuel Diversity Nuclear Conservation Goals Natural Gas Price Stability EPA Regulations ($4.4B to $6.7B)
18 Natural Gas
 4 special gas districts (limited to safety and territorial boundaries) Safety jurisdiction also applies to housing authorities and sales laterals off of interstate pipelines.")
19 PSC s Regulatory Authority: 7 investor-owned natural gas utilities (all aspects of operations, including safety) 27 municipally owned natural gas utilities (limited to safety and territorial boundaries) 4 special gas districts (limited to safety and territorial boundaries) Safety jurisdiction also applies to housing authorities and sales laterals off of interstate pipelines. (Interstate pipelines are subject to the direct jurisdiction of the U.S. Dept. of Transportation.)

20 Natural Gas Companies in Florida
21 Natural Gas Pipelines in Florida
22 Shale Gas Development

23 Shale Gas Developments Location of Shale Gas Current Major Shale Plays: Barnett Fayetteville Haynesville Marcellus Eagle Ford Woodford 23


24 Bcf/d Shale Gas Developments Estimated Growth by Basin Estimated growth of nearly 15 Bcf/d from 2005 to 2011 Woodford Eagle Ford Marcellus Haynesville Fayetteville Barnett Source: Wood Mackenzie


25 How About Shale Production by Itself? 2011 Navigant Consulting, Inc. 25

 6 6 Base")


26 Trillion Cubic Feet Supply Trends Looking Forward 2007 U.S. Natural Gas Supply Sources Forecast 2011 U.S. Natural Gas Supply Sources Forecast LNG Imports Alaskan Production 26 Alaskan Production LNG Imports 22 Net Pipeline Imports 20 Net Pipeline Imports Shale Gas 18 Shale Gas Base and Conventional Production (all sources) 6 6 Base and Conventional Production (all sources) Trillion Cubic Feet EIA projects shale gas will offset declining base and conventional production and meet growing U.S. natural gas demand 26 Source: U.S. Department of Energy, 2007 & 2011 Annual Energy Outlooks
 18.6 Bcf/day (31%) 22.")
 29.2 Bcf/day (40%) 20.2 Bcf/day (28%) 22.")
27 U.S. Demand Trends Projected Growth Bcf/day Bcf/day (0.1%) U.S. Natural Gas Demand 2010 Total 60.2 Bcf/day 19.4 Bcf/day (32%) 18.6 Bcf/day (31%) 22.1 Bcf/day (37%) Transportation Power Generation Industrial Residential & Commercial Total ~72.5 Bcf/day 0.8 Bcf/day (1%) 29.2 Bcf/day (40%) 20.2 Bcf/day (28%) 22.3 Bcf/day (31%) Power generation is projected to be the driver for gas demand growth Source: El Paso 27
28 Shale Gas Developments Production 1,600 1,400 1,200 Efficiency and Gas Rig Count July 2008: Total Rig Count (1,394) NYMEX Henry Hub ~$13/MMBtu May 2011: Gross Production 69.4 Bcf/day Natural Gas Rigwell Count 1, Hurricanes Katrina, Rita (49 Bcf/day) Hurricane Ike (56 Bcf/day) June 2009: Total Rig Count (596) NYMEX Henry Hub ~$4/MMBtu Jan 05 Apr 05 Jul 05 Oct 05 Jan 06 Apr 06 Jul 06 Oct 06 Jan 07 Apr 07 Jul 07 Oct 07 Jan 08 Apr 08 Jul 08 Oct 08 Jan 09 Apr 09 Jul 09 Oct 09 Jan 10 Apr 10 Jul 10 Oct 10 Jan 11 Apr 11 Gross Production (Bcf/day) Horizontal Rigs Directional Rigs Vertical Rigs Lower 48 States Production Total production has increased while the rigwell count has decreased The percentage of horizontal rigs of total grew from ~10% in Jan 2005 to ~70% in May Source: Smith International, EIA 914 Production Report
29 C R I T I C A L I S S U E S Natural Gas Interstate Pipeline Capacity Natural Gas Vehicles Fuel Diversity Environmental Regulations
30 WATER & WASTEWATER

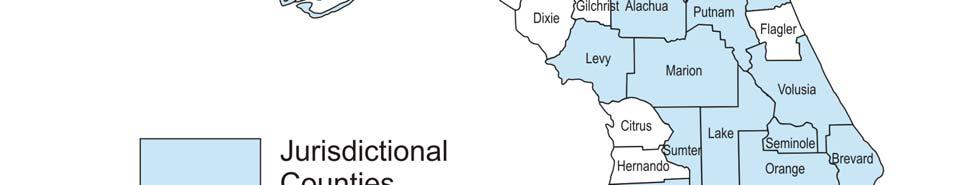


31 Water & Wastewater Jurisdictional Counties (36) 158 investor-owned water and/or wastewater utilities in 36 Florida counties.
32 C R I T I C A L I S S U E S Water & Wastewater Aging Systems Conservation High Cost Systems (Private vs. Government-Owned)
33 TELECOMMUNICATIONS

34 Incumbent Local Exchange Telephone Companies
35 C R I T I C A L I S S U E S Telecommunications New Legislation Changing PSC Authority
36 Questions?