Where Do We Go From Here? Magnusson Consulting Group 1
|
|
|
- Silvester Cameron
- 5 years ago
- Views:
Transcription


1 Where Do We Go From Here? Magnusson Consulting Group 1
2 Agenda Global Economic Outlook Effects on Agriculture Impact of China Us & Canadian Economy Oil & Gas Carbon Tax Magnusson Consulting Group 2

3 Impact of Global Economics on Markets Magnusson Consulting Group 3
4 Commodity Markets Magnusson Consulting Group 4
5 Copper Futures 31/01/2017 Magnusson Consulting Group 5
6 Canola 31/01/2017 Magnusson Consulting Group 6
7 Crude Oil 31/01/2017 Magnusson Consulting Group 7

8 Magnusson Consulting Group 8
9 Global Economic Outlook U.S. election results Increased protectionism could effect export oriented economies such as emerging markets. Increasing US dollar could effect US exports Uncertainties from Brexit will increase risk to the global economy. Immigration of Migrants & Refugees China moving from manufacturing economy to consumer based economy. Magnusson Consulting Group 9
10 Global Economic Outlook (P) Magnusson Consulting Group 10
11 GDP BY County (P) (P) Source: IMF & MCG Magnusson Consulting Group 11
12 Global Trade Growth Year-on-year growth in volume of global goods trade (% Very Low Global Growth Magnusson Consulting Group 12


13 Impact of China Magnusson Consulting Group 13
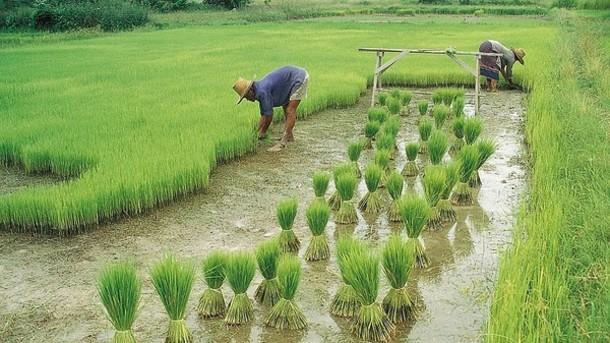
14 China: Agricultural Output China produces over 20% of the world s cereal grains, 25% of the world s meat, and 50% of the world s vegetables. China is the world s largest agricultural economy, and it ranks as the top global producer of pork, wheat, rice, tea, cotton, tomatoes, potatoes, eggs, wool, apples, walnuts, and fish, etc. In fact, the annual value of China s agricultural output is about two and one-half times the U.S. total. Magnusson Consulting Group 14
15 China: Agricultural Output China was the fourth largest exporter and second largest importer of agricultural Its import growth has been driven by a shift in its domestic production mix, and changing consumer diets with rising incomes and urbanization. Magnusson Consulting Group 15
16 China: Agricultural Imports Today cotton and soybeans account for over 40% of China s agricultural imports, a very concentrated portfolio. China is the world s largest importer of soybeans and cotton, accounting for over 60% of global soybean imports and approximately 40% of cotton imports. China s agricultural exports have increased by more than 12% annually. Import growth has averaged 19% per annum, while total agricultural trade has grown by more than 16% per annum from 2002 to These are truly impressive annual growth rates. Magnusson Consulting Group 16
17 China: GDP & Trade Growth (percentage change, year over year) Expansion of Import & Export Volume & boosted commodity prices Rebalancing & Transitioning to a more Consumer Based Economy Magnusson Consulting Group 17
18 China: Global Clout & Rebalancing Second Largest Economy in the World China s Share of Global GDP & Imports Since GDP has Averaged 9.6% Magnusson Consulting Group 18
19 Global trade: Wheat, coarse grains, and soybeans and soybean products Million metric tons Soybeans and soybean products 1 Impact of China Relatively Flat Wheat Coarse grains Total of soybeans, soybean meal, and soybean oil. Source: USDA & Magnusson Consulting Group Magnusson Consulting Group 19
20 U.S. farm-level prices: Corn, wheat, and soybeans Dollars per bushel Soybeans 8 6 Wheat 4 2 Corn Source: USDA & Magnusson Consulting Group Magnusson Consulting Group 20
21 Nominal U.S. livestock prices Dollars per hundredweight Beef cattle: Steers, 5-area Broilers: National composite Hogs: National base Source: USDA & Magnusson Consulting Group Magnusson Consulting Group 21

22 Magnusson Consulting Group 22
23 Canadian Canola Exports China is the biggest market for Canadian canola seed, taking 45 per cent of seed exports in and 39 per cent in China is 2 nd largest (20% ) market for canola Oil. The U.S. is the biggest market for Canadian canola oil, taking 67 per cent in and 64 per cent in The U.S. also takes most of our canola meal, importing 95 per cent in and 89 per cent in Source: Stats Can Magnusson Consulting Group 23

24 U.S. United states Magnusson Consulting Group 24
25 1 in 3 exports to Canada or Mexico 25
26 U.S. Canada Agriculture and Agri- Food Trade = $47B Exports to Canada $25 Billion Top 5 U.S. Exports to Canada Fruits and Nuts $3.5B Vegetables $2.7B Prepared Vegetables, Fruit and Nuts $1.9B Meat $1.6B Beverages $1.0B Imports from Canada $22 Billion Top 5 U.S. Imports from Canada Meat $2.4B Animal Feed $1.7B Baked Goods, Pasta, Mixes, Doughs $1.6B Vegetables $1.5B Cereal Grains $1.4B 26
27 U.S. Economy Outlook New Republican President - Donald Trump Uncharted Waters Protectionism Lower Taxes Growth 2-3% Inflation is contained Strong dollar Unfavourable demographics Magnusson Consulting Group 27
28 US GDP 3 rd Quarter of 2016 Magnusson Consulting Group 28
29 US Dollar Vs Canadian Dollar Magnusson Consulting Group 29

30 Canada Magnusson Consulting Group 30
31 Canadian Economy Outlook U.S. election result: Energy & Keystone Pipeline (Keystone may be announced with first 30 days announced Jan 24, 2017) TPP NAFTA Cattle/Hogs/Dairy Canada s GDP to grow 2.1% in 2017 and 2.3% in 2018 Impact of Carbon Tax But we acknowledge downside risks to those forecasts should U.S.-Canada trade relations or the global economy take a turn for the worse. Magnusson Consulting Group 31

32 CDN/US Exchange Rate and WTI Price 32
33 Canada: Household Debt to Disposable Income Magnusson Consulting Group 33

34 % 34

35 World Potash Demand Source: PotashCorp & Magnusson Consulting Group 35
36 36
37 37
38 38

39 Oil Magnusson Consulting Group 39

40 Global Oil Demand 2016/2017 mbd 31.3/ / / / / /33.9 Total Source: IEA Magnusson Consulting Group 40

41 If OPEC & Non OPEC Producers Do Not Cheat Magnusson Consulting Group 41
42 OPEC - Production Cuts are to be reviewed at the next OPEC ministerial meeting at the end of May. Once production cuts are factored into global supply, additional production will limit upside price movement Magnusson Consulting Group 42
43 WTI Futures March 2017 Magnusson Consulting Group 43

44 Carbon Tax Magnusson Consulting Group 44
45 Carbon Tax Under the Paris climate change accord Canada will cut its greenhouse gas emissions by 30 per cent from 2005 levels by To meet Canada s target Prime Minister Justin Trudeau announced Oct. 3 a $10-a-tonne floor price on carbon emissions starting in 2018, increasing annually by $10 a tonne to $50 in Each province must implement its own pricing system or the federal government will do it for them. Provinces can craft a cap-and-trade system or put a direct price on carbon pollution but it must meet the federal benchmark or "floor price." Magnusson Consulting Group 45
46
47 GHG Emissions (mt CO 2 eq) B.C. Greenhouse Gas Emissions 72 $10/tonne $15/tonne $20/tonne $25/tonne $30/tonne
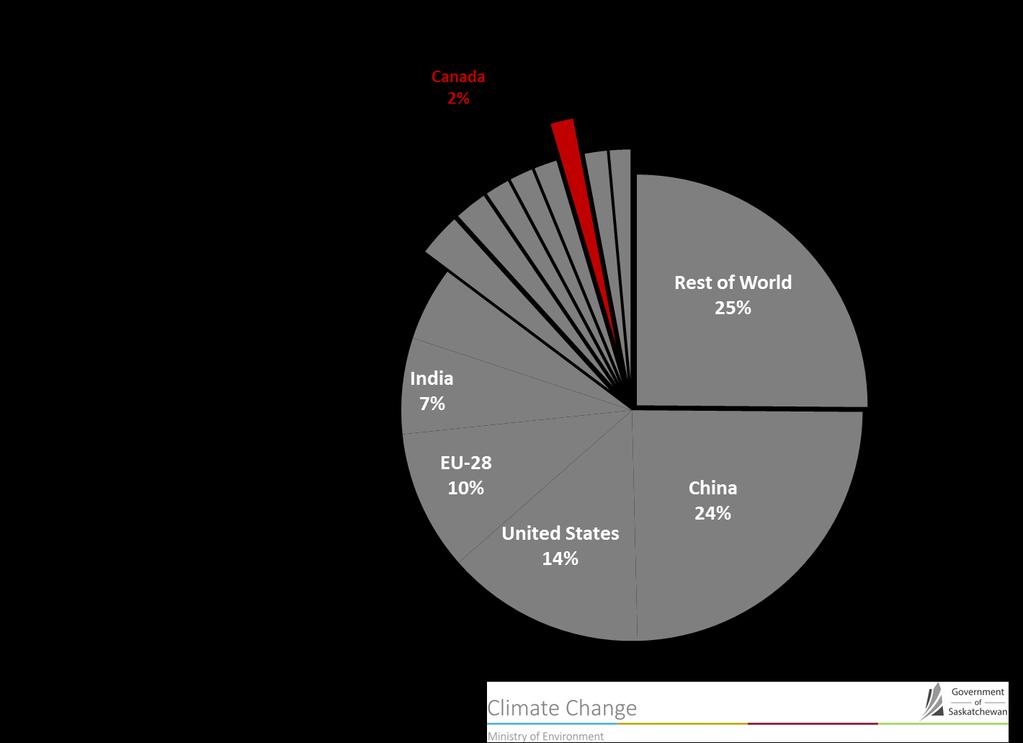
48 Provincial and Territorial GHG Emissions Magnusson Consulting Group 48
49 Provincial and Territorial GHG Emissions & Targets GHG Emissions (Mt CO2 equivalent) CDN Total Target % per year (starting in 2018) NL PE NS NB QC ON MB SK AB BC YT NT Magnusson Consulting Group 49


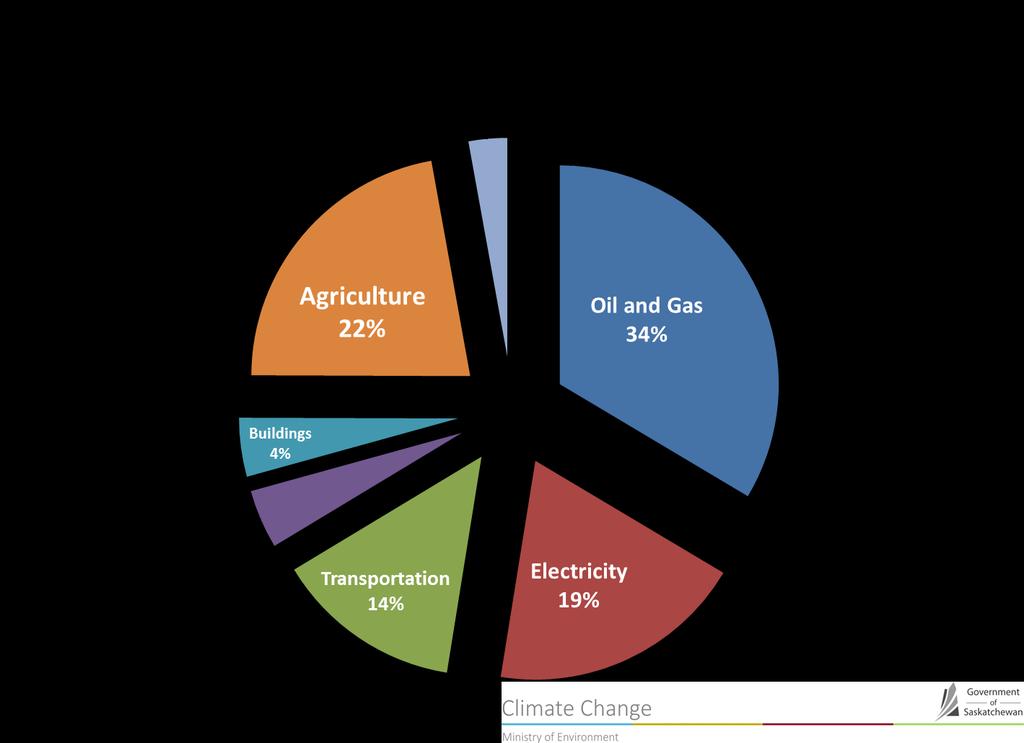
50 Canada's Emissions Breakdown by Economic Sector (2014) Waste & Others Mt Agriculture - 73 Mt CO2, 7.38% CO2, 9.97% Oil and Gas -192 Mt CO2, 26.23% Buildings - 87 Mt CO2, 11.89% Emissions-Intensive and Trade-Exposed Industries - 76 Mt CO2, 10.38% Electricity - 78 Mt CO2, 10.66% Transportation Mt CO2, 23.36% Magnusson Consulting Group 50
51
52 Effect of Federal Carbon Price Policy Saskatchewan had 75.5 million tonnes of greenhouse gases in % taxed at $50 per tonne totals $2.6 billion/year $50/tonne carbon tax means: $0.09 per cubic metre of natural gas $0.03 per kilowatt hour of electricity $0.12 per liter of gasoline $0.13 per liter of diesel fuel cost to average family of $1,250/year Electricity lighting and appliances - $285/year Natural Gas space and water heating - $365/year Transportation family vehicles - $600/year cost to a grain farmer of $10 to $12 an acre
53 Impacts on Industry Differing impacts on Canadian industries & provinces. Significant impact on the energy - intensive sectors, comprised of fossil-fuel electric utilities, natural gas distributors, and petroleum refiners. These sectors of Canadian economy account for approximately one-quarter of all Canadian emissions One quarter of Canadian emissions come directly from oil and gas production concentrated in Alberta, Saskatchewan, and Newfoundland and Labrador. Agricultural activities, concentrated in Saskatchewan and Manitoba, comprise about one-tenth of Canadian emissions but represent significant contribution to provincial economies. Magnusson Consulting Group 53
54 Impacts on Industry EITE (Emission-Intensive and Trade Exposed Industries) represent another 10 percent Mining Maunfacturing (particularly energy intensive) Chemical manufacturing Basic Chemicals Fertilizers Synthetic Material Metals Pulp & paper, non-metallic minerals. Particularly hard hot will be primary metals manufacturers: Three quarters of national output in Alberta, Saskatchewan & Ontario Iron, steel, zinc, and aluminium smelting in Manitoba, Ontario, Quebec, producing nearly 90% of the national output. Chemical manufacturers particularly vulnerable are those that produce basic chemicals, fertilizers, and synthetic fibres industries most prevalent in Alberta, Saskatchewan and Ontario which together account for three quarters of national output. Magnusson Consulting Group 54
55 Impacts on Industry EITE industries typically account for less than 5% of GDP they make up as much as 20% of industrial production in some provinces, with spillover impacts that could extend further upstream. Farmers, for instance, will likely feel the effects indirectly through suppliers, such as Potash & Nitrogen fertilizers. Provinces such as Saskatchewan could see considerable negative economic impacts as the province has a high percentage of industries that will be adversely effected by the carbon tax. Most of the remaining emissions are related to service sector activities, including air and truck transportation, which can typically pass on the higher costs to customers and are not very mobile. Magnusson Consulting Group 55
56 PROVINCIAL CHARGES ON GASOLINE AND DIESEL, 2017 AB BC SK MB ON Gas Diesel Gas Diesel Gas Diesel Gas Diesel Gas Diesel QC NB NS PE NL Gas Diesel Gas Diesel Gas Diesel Gas Diesel Gas Diesel Fuel Tax Sales Tax on Fuel Carbon Tax Carbon charges include Alberta's carbon levy and BC s carbon tax. Ontario & Quebec also impose a charge on fuel through their cap-trade systems, which is not included in this chart. Sales tax on fuel is based on average retail prices of gasoline and diesel for the week ending March 8, Based on provincial tax rates known as March 24, 2016 Magnusson Consulting Group 56